You are not logged in.
This means you
CAN ONLY VIEW reports that were published prior to Monday, April 14, 2025.
You
MUST UPGRADE YOUR MEMBERSHIP if you want to see any current reports.
AFTER MARKET UPDATE - FRIDAY, JUNE 5TH, 2009
Previous After Market Report Next After Market Report >>>
|
|
|
|
DOW |
+12.89 |
8,763.13 |
+0.15% |
|
Volume |
1,261,431,860 |
-7% |
|
Volume |
2,366,312,680 |
-7% |
|
NASDAQ |
-0.60 |
1,849.42 |
-0.03% |
|
Advancers |
1,460 |
47% |
|
Advancers |
1,255 |
44% |
|
S&P 500 |
-2.37 |
940.09 |
-0.25% |
|
Decliners |
1,541 |
49% |
|
Decliners |
1,469 |
51% |
|
Russell 2000 |
-1.32 |
530.36 |
-0.25% |
|
52 Wk Highs |
26 |
|
|
52 Wk Highs |
42 |
|
|
S&P 600 |
-0.71 |
280.09 |
-0.25% |
|
52 Wk Lows |
2 |
|
|
52 Wk Lows |
5 |
|
|
 |
Leadership Expanded As Indices Rose Above Longer-Term Averages
Adam Sarhan, Contributing Writer,
The major averages ended mixed but virtually flat on Friday, yet higher for the week. Decliners narrowly led decliners on the NYSE and on the Nasdaq exchange while the volume totals were reported lighter than the prior session on both major exchanges. Ideally, one would like to see volume expand when the market rallies and contract when it pulls back. This is exactly what we have seen this week, which is encouraging action. There were 17 high-ranked companies from the CANSLIM.net Leaders List that made a new 52-week high and appeared on the CANSLIM.net BreakOuts Page, higher than the 11 issues that appeared on the prior session. The greater expansion recently occurring in the new highs list has offered encouraging news for growth oriented investors. Additionally, the Dow Jones Industrial Average, S&P 500 Index, and Nasdaq Composite are now collectively trading above their respective 200-day moving average (DMA) lines. The major indices' progress above their 200 DMA lines, and the expansion in the new highs list, were the two very important improvements which Ken Gruneisen mentioned investors should be watching for in the June 2009 issue of CANSLIM.net News under the headline "Leadership Expansion Needed To Fuel A Healthy Summer Rally" (published last weekend -read here).
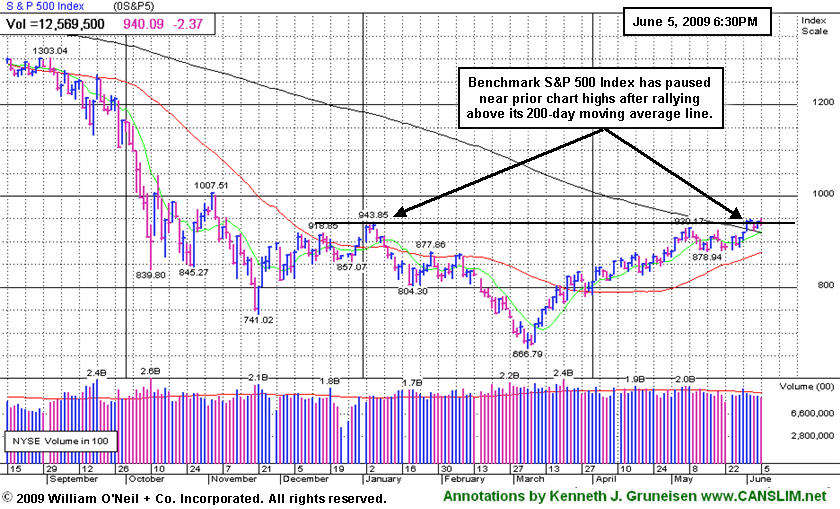
On Monday, General Motors (GM delisted) filed for Chapter 11 bankruptcy protection. The market opened higher, rallying in the face of the largest bankruptcy ever, sending the major averages above their respective near-term resistance levels as volume expanded. The market's ability to shrug off the bad news and roar higher set the stage for a very healthy weekly advance. Aftering enjoying very healthy gains from the March 2009 lows, the market had spent the latter half of May consolidating. Now, the market vaulted above resistance near the major averages' respective 200 day moving average (DMA) lines. The prior resistance now serves as a very important support level to watch. In the weeks and months ahead, the bulls remain in control as long as support (formerly resistance) is not breached. In other news, shares of GM and Citigroup (C -3.08%) were removed from the Dow Jones Industrial Average, and Cisco Systems Inc (CSCO +1.02%) and Travelers Cos Inc (TRV +0.30%) replaced the two icons.
The news on the economic front was positive, personal spending for April declined -0.1%, which topped the average forecast and was an improvement from March. Meanwhile, personal income for April showed a surprise +0.5% in the face of higher unemployment. Construction spending for April was also stronger than expected and rose by +0.8% month-over-month. The ISM Manufacturing Index for May was +42.8, which largely matched expectations however it was stronger than the prior month's reading. The reading indicated that manufacturing activity continues to contract but the rate of contraction is falling.
On Tuesday, the major averages edged higher for the fourth straight day on signs of improvement in the housing market. Home resales rose at the fastest pace in seven years, which was the latest in a series of stronger-than-expected data concerning the housing market. The rally helped the S&P 500 Index close above its 200-day moving average (DMA) line for the first time since December 2007. According to Bloomberg, this was its longest streak below its 200 DMA line since the 1930's.
On Wednesday, the major averages snapped a four day winning streak, impacted by sour economic news and a stronger US dollar. The country's largest private employer services firm ADP said employers slashed -532,000 jobs in May. Later in the day, the Institute for Supply Management’s (ISM) index of service industries was 44 which missed the Street's forecast. The latest studies show that the service industry presently makes up over +80% of the economy. Federal Reserve Chairman Ben S. Bernanke testified in Washington today and told lawmakers that large US budget deficits threaten financial stability. The big news on Wednesday was the US Dollar and its relationship to both equities and commodities. A slew of commodities got smacked on Wednesday as the US dollar advanced. It is important to remember that the US dollar and commodities are inversely related, meaning commodity prices fall when the dollar rallies. The inverse is also true, such that commodity prices rise when the dollar falls. This relationship is important because the US dollar rallied smartly during the latter half of 2008 while commodities plunged. Meanwhile, the greenback has spent the past few months in a virtual free fall which has helped lift a slew of commodities. Interestingly, the inverse relationship between the dollar and stocks also exists. The major averages have surged since the March near term low while the dollar has virtually imploded. This is an important relationship that will likely continue to dominate global capital markets as investors scan the globe for outsized returns.
On Thursday, the major averages shrugged off negative retail sales data and ended higher as commodity prices rebounded sharply from Wednesday's sharp sell off and the dollar fell. The Labor Department said initial jobless claims slid by 4,000 to 621,000 in the week ended May 30. This was in line with forecasts from a revised 625,000 the prior week. The report also showed that the total number of people collecting unemployment insurance fell for the first time in nearly five months which broke the streak of 17 consecutive records.
Before Friday's opening bell, the Labor Department released May's job's report. The government said that US employers cut a lower-than-expected -345,000 jobs last month which was the smallest reading in eight months. Meanwhile, the unemployment rate jumped to +9.4% which was the highest level since 1983.
Money Management Services - STOP WAITING; ACT NOW!- Open An Account today!
After remaining in cash from May 2008-May 2009, our portfolio managers began buying stocks last week. You may inquire about having your account professionally managed using this fact-based investment system by clicking HERE. *Accounts over $250,000 please. ** Serious inquiries only.
PICTURED: The benchmark S&P 500 Index has paused near prior chart highs after rallying above its 200-day moving average line. Leadership expanded nicely this week which bodes well for this current rally. Remember to always keep your losses small and never fight the tape!
|
|
|
 |
Internet Index Is Setting A Strong Pace In 2009
Kenneth J. Gruneisen - Passed the CAN SLIM® Master's Exam
The Gold & Silver Index ($XAU -4.29%) was a standout decliner while most groups finished with smaller losses on Friday. The financial group was led lower by the Bank Index ($BKX -2.14%) while the Broker/Dealer Index ($XBD -0.42%) ended with a smaller loss. The Semiconductor Index ($SOX -1.90%) led the tech sector lower, followed by modest losses in the Biotechnology ($BTK -0.95%) and Networking ($NWX -0.25%) indexes. The Oil Services ($OSX -1.05%) and Integrated Oil ($XOI -0.65%) indexes fell, with small losses in the Retail Index ($RLX -0.33%) and Healthcare ($HMO -0.18%) groups rounding out a mostly negative session for the groups routinely covered in the Industry Group Watch section.
Charts courtesy www.stockcharts.com
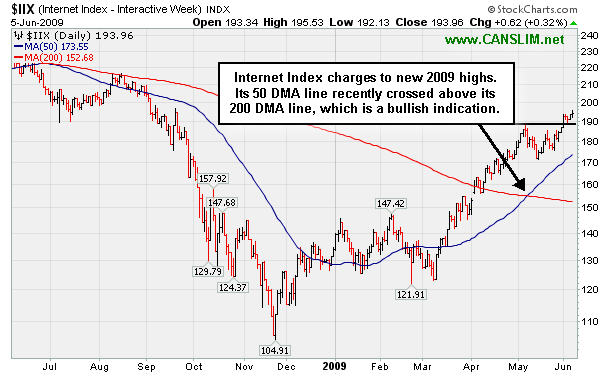
PICTURED: The Internet Index ($IIX +0.32%) posted a modest gain, which made it a standout on Friday. Its 50-day moving average (DMA) line recently crossed above its 200 DMA line, which is a bullish indication that usually bodes well. This week it charged to new 2009 highs, and it is one of the leading gainers for the year thus far!
| Oil Services |
$OSX |
178.90 |
-1.89 |
-1.05% |
+47.38% |
| Healthcare |
$HMO |
1,105.76 |
-1.95 |
-0.18% |
+15.16% |
| Integrated Oil |
$XOI |
980.68 |
-6.37 |
-0.65% |
+0.10% |
| Semiconductor |
$SOX |
270.74 |
-5.25 |
-1.90% |
+27.61% |
| Networking |
$NWX |
193.17 |
-0.49 |
-0.25% |
+34.25% |
| Internet |
$IIX |
193.96 |
+0.62 |
+0.32% |
+45.00% |
| Broker/Dealer |
$XBD |
103.23 |
-0.43 |
-0.41% |
+33.25% |
| Retail |
$RLX |
334.12 |
-1.09 |
-0.33% |
+19.64% |
| Gold & Silver |
$XAU |
150.67 |
-6.75 |
-4.29% |
+21.66% |
| Bank |
$BKX |
37.07 |
-0.81 |
-2.14% |
-16.36% |
|
|
|
 |
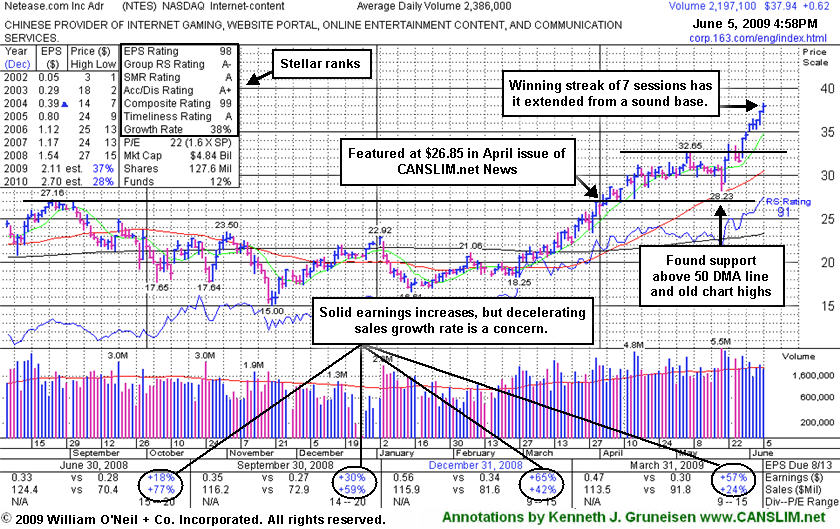
Leader Gets Extended Following Second Stage Breakout
Kenneth J. Gruneisen - Passed the CAN SLIM® Master's Exam
Netease.com Inc (NTES +$0.62 or +1.66% to $37.94) hit another new all-time high today while extending its winning streak to 7 sessions. Disciplined investors avoid chasing stocks that get more than +5% above their pivot point, and it is extended from a sound base now -so it is outside of the investment system's guidelines for any new buying efforts to be justified! In fact, investors with a profitable interest in NTES to protect would be wise to watch closely for future sell signals which could prompt them to lock in profits. Technically, its prior chart highs are now a critical support level to watch, and any subsequent deterioration back into its prior base would obviously raise concerns and trigger technical sell signals.
A considerable gain with above average volume on 5/21/09 was noted as an indication of prompt institutional (the I criteria) support, and its color code was then changed to yellow with a new pivot point of $32.75 based upon its 5/07/09 high plus .10. This followed its first test of support at its 50-day moving average (DMA) line on 5/20/09 after consolidating in a tight range for several weeks following a previous steady advance into new all-time high territory. NTES was first featured at $26.75 in the 3/31/09 CANSLIM.net Mid-Day Breakouts Report (read here). This high-ranked Chinese Internet - Content firm was also summarized in greater detail including an annotated graph in the April 2009 issue of CANSLIM.net News (read here). The number of top-rated funds owning an interest in its shares increased from 18 in June '08 to 66 in March '09, which is very reassuring news in that department.
|
|
|
Color Codes Explained :
Y - Better candidates highlighted by our
staff of experts.
G - Previously featured
in past reports as yellow but may no longer be buyable under the
guidelines.
***Last / Change / Volume quote data in this table corresponds with the timestamp on the note***
Symbol/Exchange
Company Name
Industry Group |
Last |
Chg. |
Vol
% DAV |
Date Featured |
Price Featured |
Latest Pivot Point
Featured |
Status |
| Latest Max Buy Price |
GMCR
- NASDAQ
Green Mtn Coffee Roastrs
FOOD & BEVERAGE - Processed & Packaged Goods
|
$92.19
|
N/A
|
N/A
N/A
|
1/1/2008
(Date
Featured) |
$40.70
(Price
Featured) |
PP = $42.99 |
G |
| MB = $45.14 |
Most Recent Note - 6/5/2009 12:43:23 PM
G - Rallied to another new 52-week high today with a considerable gain backed by heavy volume. Wedging higher in recent weeks after a 4/30/09 "breakaway gap" when it partnered with Wal-Mart Stores. Traded up as much as +138.88% since featured at $39.09 in the January 2009 CANSLIM.net News (read here).
>>> The latest Featured Stock Update with an annotated graph appeared on 5/26/2009. click here.
|
|
C
A
S
I |
News |
Chart |
SEC
View all notes Alert
me of new notes
Company
Profile
|
HMSY
- NASDAQ
H M S Holdings Corp
COMPUTER SOFTWARE & SERVICES - Healthcare Information Service
|
$36.91
|
N/A
|
N/A
N/A
|
2/20/2009
(Date
Featured) |
$34.08
(Price
Featured) |
PP = $36.55 |
Y |
| MB = $38.38 |
Most Recent Note - 6/5/2009 5:49:03 PM
Y - Quietly consolidating in a tight range near all-time highs since gapping up on 6/01/09. No overhead supply is left to hinder the progress for this Commercial Services - Healthcare firm. The group's Relative Strength rank has slipped from A in March to a D+ now, which is a concern. Investors' odds are usually better when chosing leaders within a leading industry group.
>>> The latest Featured Stock Update with an annotated graph appeared on 5/28/2009. click here.
|
|
C
A
S
I |
News |
Chart |
SEC
View all notes Alert
me of new notes
Company
Profile
|
ILMN
- NASDAQ
Illumina Inc
DRUGS - Biotechnology
|
$38.72
|
N/A
|
N/A
N/A
|
5/3/2009
(Date
Featured) |
$38.14
(Price
Featured) |
PP = $39.05 |
Y |
| MB = $41.00 |
Most Recent Note - 6/5/2009 5:54:18 PM
Y - Quietly paused after 6 consecutive small gains on near average volume, rising toward its pivot point. Its Relative Strength rank has slumped to 67, however, raising concerns while consolidating in a very tight trading range for nearly 3 months. Recently found support near its 50 DMA line. Disciplined investors will watch for confirming gains above its pivot point to trigger a proper technical buy signal before taking any action. Recently featured in the May 2009 issue of CANSLIM.net News (read here).
>>> The latest Featured Stock Update with an annotated graph appeared on 5/29/2009. click here.
|
|
C
A
S
I |
News |
Chart |
SEC
View all notes Alert
me of new notes
Company
Profile
|
LFT
-
|
$29.52
|
N/A
|
N/A
N/A
|
4/2/2009
(Date
Featured) |
$22.19
(Price
Featured) |
PP = $21.81 |
G |
| MB = $22.90 |
Most Recent Note - 6/5/2009 6:03:07 PM
G - Hit a new 52-week high today with a considerable gain backed by nearly 5 times average volume, rising from a choppy (improper) base pattern. Its progress could be hindered by future share offerings. Its 5/28/09 gap up and considerable gain followed another strong quarterly financial report. Prompt repair of its recent 50 DMA line violation, and its gap up, were noted as signs of solid institutional (the I criteria) support and buying demand. This Chinese Computer Software firm recently filed a registration of approximately 16 million shares for resale, and it also revealed a planned acquisition of another Chinese service provider.
>>> The latest Featured Stock Update with an annotated graph appeared on 6/4/2009. click here.
|
|
C
A
S
I |
News |
Chart |
SEC
View all notes Alert
me of new notes
Company
Profile
|
NTES
- NASDAQ
Netease Inc Adr
INTERNET - Internet Information Providers
|
$37.94
|
N/A
|
N/A
N/A
|
5/21/2009
(Date
Featured) |
$31.19
(Price
Featured) |
PP = $32.75 |
G |
| MB = $34.39 |
Most Recent Note - 6/5/2009 6:07:05 PM
G - Today's new high close, well above its "max buy" level, was its 7th consecutive gain, leaving it extended from its second-stage base. Its 5/28/09 gap up and considerable gain with +79% above average volume confirmed a technical buy signal as it rose above its pivot point. Indications of institutional (the I criteria) buying demand have been noted after earnings news on 5/20/09 a shakeout tested support near its 50 DMA line. First featured at $26.75 in the 3/31/09 CANSLIM.net Mid-Day Breakouts Report (read here). This high-ranked Chinese Internet - Content firm was also summarized in greater detail including an annotated graph in the April 2009 issue of CANSLIM.net News (read here).
>>> The latest Featured Stock Update with an annotated graph appeared on 6/5/2009. click here.
|
|
C
A
S
I |
News |
Chart |
SEC
View all notes Alert
me of new notes
Company
Profile
|
NVEC
- NASDAQ
N V E Corp
ELECTRONICS - Semiconductor - Specialized
|
$43.47
|
N/A
|
N/A
N/A
|
3/13/2009
(Date
Featured) |
$33.85
(Price
Featured) |
PP = $39.01 |
G |
| MB = $40.96 |
Most Recent Note - 6/5/2009 6:08:38 PM
G - Gain today average volume for a new 52-week high. It recently found support at its 50 DMA line. Earnings per share rose +38% over the year ago period, yet sales were up just +14% and still rather minuscule.
>>> The latest Featured Stock Update with an annotated graph appeared on 5/27/2009. click here.
|
|
C
A
S
I |
News |
Chart |
SEC
View all notes Alert
me of new notes
Company
Profile
|
SNDA
-
|
$62.26
|
N/A
|
N/A
N/A
|
5/31/2009
(Date
Featured) |
$57.62
(Price
Featured) |
PP = $53.95 |
G |
| MB = $56.65 |
Most Recent Note - 6/5/2009 6:10:20 PM
G - Negatively reversed today after hitting a new all-time high, ending its streak of 7 consecutive gains. It is extended from a sound base. Patient investors may watch for a pullback near its 50 DMA line, an important support level which has not been tested since breaking out in March. Just featured in the June 2009 issue of CANSLIM.net News. Be sure to review the "What to Look Out For" section and entire detailed summary - read here).
>>> The latest Featured Stock Update with an annotated graph appeared on 6/3/2009. click here.
|
|
C
A
S
I |
News |
Chart |
SEC
View all notes Alert
me of new notes
Company
Profile
|
SYNA
- NASDAQ
Synaptics Inc
COMPUTER SOFTWARE & SERVICES - Information Technology Service
|
$37.41
|
N/A
|
N/A
N/A
|
5/18/2009
(Date
Featured) |
$32.58
(Price
Featured) |
PP = $34.52 |
G |
| MB = $36.25 |
Most Recent Note - 6/5/2009 6:12:06 PM
G - Hit a new 52-week high today, then reversed and ended with a light volume loss. Its 6/01/09 gap up gain was backed by +62% above average volume, and now there is no overhead supply to hinder its progress. Color code was changed to green after it distanced itself from its prior chart highs. First featured in yellow in the May 18, 2009 mid-day report (read here). The number of top-rated funds owning its shares rose from 123 in June '08 to 185 in March '09, which is good news concerning the I criteria. Strong earnings and sales revenues growth in the 4 latest quarterly comparisons satisfies the C criteria. Its annual earnings (the A criteria) history showed a dowturn in 2006, leaving concerns, but it followed that up with strong growth the next 2 years.
>>> The latest Featured Stock Update with an annotated graph appeared on 6/1/2009. click here.
|
|
C
A
S
I |
News |
Chart |
SEC
View all notes Alert
me of new notes
Company
Profile
|
TNDM
- NASDAQ
Tandem Diabetes Care Inc
TELECOMMUNICATIONS - Wireless Communications
|
$30.87
|
N/A
|
N/A
N/A
|
3/2/2009
(Date
Featured) |
$18.89
(Price
Featured) |
PP = $29.85 |
Y |
| MB = $31.34 |
Most Recent Note - 6/5/2009 6:13:03 PM
Y - Quietly consolidating above prior chart highs in the $30 area that are now an important support level to watch. Color code was changed to yellow as it quietly retreated just under its "max buy" level. It found support near its 50 DMA line, and its impressive "positive reversal" on 5/14/09 was noted as a sign of institutional support. Gapped up on 4/30/09 for a new all-time high after reporting solid quarterly sales and earnings increases. Traded up as much as +72.42% since first featured at $18.89 in the 3/02/09 Mid-Day BreakOuts Report (read here).
>>> The latest Featured Stock Update with an annotated graph appeared on 6/2/2009. click here.
|
|
C
A
S
I |
News |
Chart |
SEC
View all notes Alert
me of new notes
Company
Profile
|
|
|
|
THESE ARE NOT BUY RECOMMENDATIONS!
Comments contained in the body of this report are technical
opinions only. The material herein has been obtained
from sources believed to be reliable and accurate, however,
its accuracy and completeness cannot be guaranteed.
This site is not an investment advisor, hence it does
not endorse or recommend any securities or other investments.
Any recommendation contained in this report may not
be suitable for all investors and it is not to be deemed
an offer or solicitation on our part with respect to
the purchase or sale of any securities. All trademarks,
service marks and trade names appearing in this report
are the property of their respective owners, and are
likewise used for identification purposes only.
This report is a service available
only to active Paid Premium Members.
You may opt-out of receiving report notifications
at any time. Questions or comments may be submitted
by writing to Premium Membership Services 665 S.E. 10 Street, Suite 201 Deerfield Beach, FL 33441-5634 or by calling 1-800-965-8307
or 954-785-1121.
|
|
|


