You are not logged in.
This means you
CAN ONLY VIEW reports that were published prior to Monday, April 14, 2025.
You
MUST UPGRADE YOUR MEMBERSHIP if you want to see any current reports.
AFTER MARKET UPDATE - TUESDAY, JUNE 4TH, 2013
Previous After Market Report Next After Market Report >>>
|
|
|
|
DOW |
-76.49 |
15,177.54 |
-0.50% |
|
Volume |
786,756,000 |
-11% |
|
Volume |
1,768,212,390 |
-10% |
|
NASDAQ |
-20.11 |
3,445.26 |
-0.58% |
|
Advancers |
1,105 |
35% |
|
Advancers |
796 |
31% |
|
S&P 500 |
-9.04 |
1,631.38 |
-0.55% |
|
Decliners |
1,921 |
61% |
|
Decliners |
1,680 |
65% |
|
Russell 2000 |
-8.56 |
981.97 |
-0.86% |
|
52 Wk Highs |
86 |
|
|
52 Wk Highs |
142 |
|
|
S&P 600 |
-4.83 |
551.64 |
-0.87% |
|
52 Wk Lows |
132 |
|
|
52 Wk Lows |
13 |
|
|
 |
Volume Lighter Behind Losses
Kenneth J. Gruneisen - Passed the CAN SLIM® Master's Exam
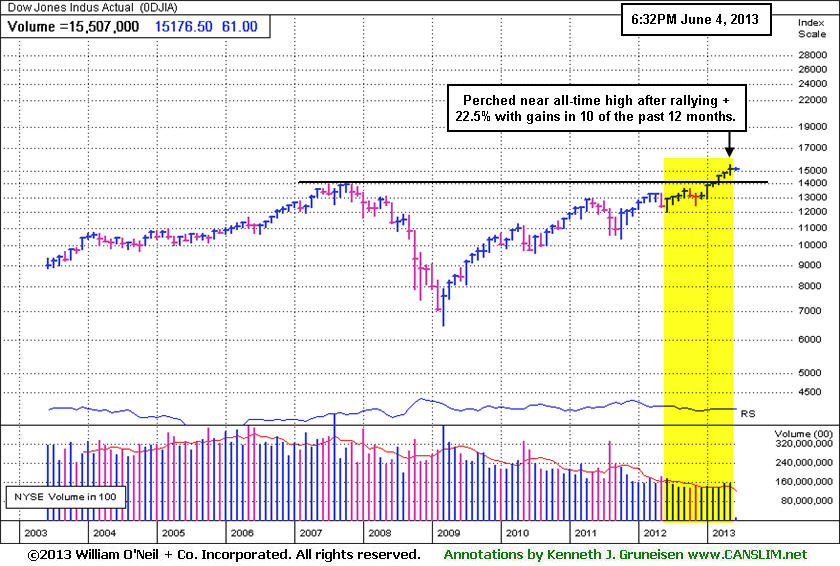
Stocks finished lower in another volatile trading session. The Dow Jones Industrial Average snapped its streak of 20 consecutive Tuesdays in positive territory as it fell over 76 points to 15,177. The S&P 500 Index lost 9 points to 1,631. The Nasdaq Composite Index was lower by 20 points to 3,445. Tuesday's volume totals were reported lighter than the prior session totals on the Nasdaq exchange and on the NYSE, which was a reassuring sign that institutional investors were not increasing their selling efforts even while the market rally has encountered distributional pressure. Breadth was negative as decliners led advancers by a nearly 2-1 margin on the NYSE and by more than a 2-1 margin on the Nasdaq exchange. There were 41 high-ranked companies from the CANSLIM.net Leaders List making new 52-week highs and appearing on the CANSLIM.net BreakOuts Page, up from the prior session total of 30 stocks. New 52-week lows outnumbered new 52-week highs on the NYSE, meanwhile on the Nasdaq exchange new 52-week highs still outnumbered new 52-week lows. There were gains for only 3 of the 12 high-ranked companies currently included on the Featured Stocks Page.
The major averages erased Monday's advance as the Fed continued to deliver a mixed monetary policy message after Kansas City Fed President George reiterated her support for slowing the pace of quantitative easing as economic growth quickens. Investors were also cautious ahead of Japanese Prime Minister Abe's speech on the nation's growth strategy and before Friday's all-important nonfarm payrolls report.
Overall, nearly every sector lost ground. Industrials and Energy were the worst performing groups as United Technologies Corp (UTX -1%) and Exxon Mobil Corp (XOM -0.7%). Consumer Discretionary stocks were also weak, led by Dollar General's (DG -9.17%) drop after the company reduced the top end of its full-year earnings forecast. The defensive characteristics of Telecommunications helped AT&T Inc (T +1.71%), Sprint Nextel Corp (S +0.55%) and others in the group gain ground.
In fixed-income, Treasuries declined. The 10-year note was down 6/32 to yield 2.14% and the 30-year bond lost 24/32 to yield 3.31%.
Lighter volume behind losses and the finish well above the session lows were favorable characteristics typical of a bullish market environment. The market (M criteria) uptrend clearly came under pressure as May drew to a close. Be sure you see last Friday's commentary which also included a Special Notice and annotated graph illustrating the IBD 85-85 Index's Relative Strength line lagging in recent years (read here). More damaging losses in the broader market can serve as a reminder for investors to be protective of any gains and to limit losses by being especially watchful for any individual issues flashing technical sell signals. This is precisely how the fact-based investment system prompts investors to reduce exposure and preserve cash during market downdrafts.
As always, watch upcoming CANSLIM.net reports for new action-worthy leaders best matching the winning models to be covered as they emerge and then included on the Featured Stocks Page - with our Certified experts' latest notes and links to additional resources including detailed analysis with annotated graphs. The Premium Member Homepage - includes "dynamic archives" to all prior pay reports published. Watch for an announcement via email concerning the next WEBCAST.
PICTURED: The Dow Jones Industrial Average is perched near all-time highs after rallying +22% with gains in 10 of the past 12 months.
|
 Kenneth J. Gruneisen started out as a licensed stockbroker in August 1987, a couple of months prior to the historic stock market crash that took the Dow Jones Industrial Average down -22.6% in a single day. He has published daily fact-based fundamental and technical analysis on high-ranked stocks online for two decades. Through FACTBASEDINVESTING.COM, Kenneth provides educational articles, news, market commentary, and other information regarding proven investment systems that work in good times and bad.
Comments contained in the body of this report are technical opinions only and are not necessarily those of Gruneisen Growth Corp. The material herein has been obtained from sources believed to be reliable and accurate, however, its accuracy and completeness cannot be guaranteed. Our firm, employees, and customers may effect transactions, including transactions contrary to any recommendation herein, or have positions in the securities mentioned herein or options with respect thereto. Any recommendation contained in this report may not be suitable for all investors and it is not to be deemed an offer or solicitation on our part with respect to the purchase or sale of any securities. |
|
 |
Retail, Defensive, Tech and Financial Groups Fell
Kenneth J. Gruneisen - Passed the CAN SLIM® Master's Exam
The Retail Index ($RLX -1.11%) was a negative influence and the Bank Index ($BKX -0.96%) also weighed on the major averages while the Broker/Dealer Index ($XBD +0.00%) finished flat. The Oil Services Index ($OSX -0.47%) and the Integrated Oil Index ($XOI -0.87%) edged lower. The tech sector saw modest losses of less than -1% from the Internet Index ($IIX -0.66%), Networking Index ($NWX -0.57%) and Semiconductor Index ($SOX +0.37%) while the Biotechnology Index ($BTK -1.70%) lagged. Defensive groups were also weaker as the Gold & Silver Index ($XAU -1.81%) fell hardest and the Healthcare Index ($HMO -0.32%) only suffered a small loss.
Charts courtesy www.stockcharts.com
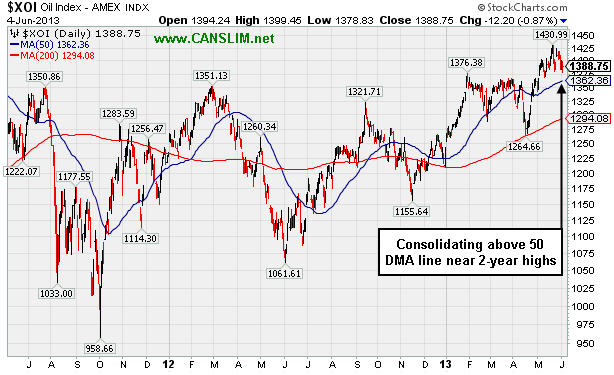
PICTURED: The Integrated Oil Index ($XOI -0.87%) is consolidating above its 50-day moving average near 2-year highs.
| Oil Services |
$OSX |
253.84 |
-1.20 |
-0.47% |
+15.30% |
| Healthcare |
$HMO |
3,062.85 |
-9.74 |
-0.32% |
+21.82% |
| Integrated Oil |
$XOI |
1,388.75 |
-12.20 |
-0.87% |
+11.83% |
| Semiconductor |
$SOX |
472.45 |
+1.73 |
+0.37% |
+23.01% |
| Networking |
$NWX |
252.91 |
-1.45 |
-0.57% |
+11.64% |
| Internet |
$IIX |
376.53 |
-2.49 |
-0.66% |
+15.15% |
| Broker/Dealer |
$XBD |
122.58 |
+0.01 |
+0.00% |
+29.94% |
| Retail |
$RLX |
780.30 |
-8.77 |
-1.11% |
+19.48% |
| Gold & Silver |
$XAU |
108.23 |
-2.00 |
-1.81% |
-34.64% |
| Bank |
$BKX |
61.00 |
-0.59 |
-0.96% |
+18.95% |
| Biotech |
$BTK |
1,921.83 |
-33.22 |
-1.70% |
+24.23% |
|
|
|
 |
Chart Shows "Wedging" Higher In Recent Weeks on Light Volume
Kenneth J. Gruneisen - Passed the CAN SLIM® Master's Exam
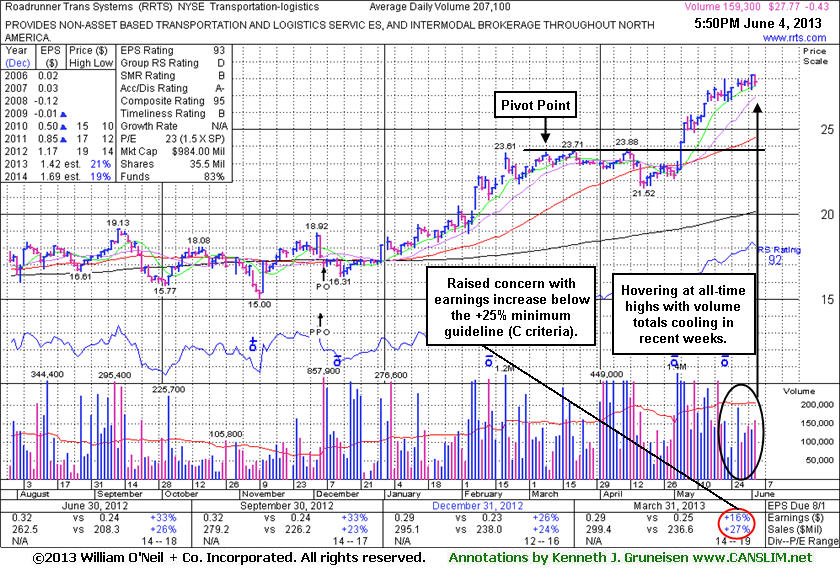
Roadrunner Transportation Systems Inc (RRTS $-0.43 or -1.52% to 27.77) is extended from its latest base. In recent weeks it "wedged" higher with gains lacking great volume conviction while volume totals have been cooling. On pullbacks, the prior highs in the $23 area define support to watch below its 50-day moving average (DMA) line. It showed resilience near its 50-day moving average (DMA) line, then started the month of May with a spike higher with heavy volume behind big gains. However, fundamental concerns were raised by its sub par earnings increase in the Mar '13 quarter, below the +25% minimum guideline (C criteria), as covered in the stock's last appearance in this FSU section on 5/14/13 with an annotated graph under the headline, "Technically Strong Despite Newly Noted Fundamental Shortcoming". It reported earnings +16% on +27% sales revenues for the quarter ended March 31, 2013 versus the year ago period, below the +25% minimum earnings guideline (C criteria). Because the fact-based system suggests watching for technical sell signals before exiting profitable position it was previously noted - "Investors who may own it might choose to give the stock the benefit of the doubt unless it flashes any weak action, however a disciplined investor following the fact-based system would usually avoid making new buying efforts in any companies failing to solidly satisfy the fundamental guidelines."
Decelerating sales revenues and earnings increases in sequential quarterly comparisons through the Dec '12 quarter were noted earlier. Concerns raised by the Mar '13 results added to problem with respect to matching up with with historic models of past great winners. As June has only just begun, it will be many weeks before the results of the company's Jun '13 quarter are reported. It is more ideal when a company shows accelerating sales revenues and earnings increases. Often a bullish price/volume chart anticipates strong results, and a bearish price/volume chart pattern frequently predicts weaker earnings, but only time will say if it can resume growth above the +25% rate. Consensus estimates are currently calling for +21% and +19% earnings growth in FY '13 and '14, respectively. Earnings growth is crucial to the fact-based investment approach and obviously weighs into the newspaper's Earnings Per Share (EPS) rating system. Its current EPS rank of 93 is still well above the 80+ guideline for buy candidates.
The number of top-rated funds owning its shares rose from 168 in Jun '12 to 201 in Mar '13, a reassuring sign concerning the I criteria. The company completed a new Public Offering on 12/06/12 and, technically, it broke out above previously stubborn resistance in $19 area with volume-driven gains in January. Regular readers may recall that, based on weak action, RRTS had been dropped from the Featured Stocks list on 5/18/12 following a choppy period.
|
|
|
Color Codes Explained :
Y - Better candidates highlighted by our
staff of experts.
G - Previously featured
in past reports as yellow but may no longer be buyable under the
guidelines.
***Last / Change / Volume data in this table is the closing quote data***
Symbol/Exchange
Company Name
Industry Group |
PRICE |
CHANGE
(%Change) |
Day High |
Volume
(% DAV)
(% 50 day avg vol) |
52 Wk Hi
% From Hi |
Featured
Date |
Price
Featured |
Pivot Featured |
|
Max Buy |
AL
-
NYSE
Air Lease Corp Cl A
DIVERSIFIED SERVICES - Rental and Leasing Services
|
$27.86
|
-0.73
-2.55% |
$28.80
|
1,037,556
193.86% of 50 DAV
50 DAV is 535,200
|
$31.00
-10.13%
|
5/9/2013
|
$30.95
|
PP = $29.38
|
|
MB = $30.85
|
 Most Recent Note - 6/4/2013 12:18:58 PM
G - Consolidating near its 50 DMA line now, it completed a Secondary Offering on 5/31/13. Often times companies attract additional institutional interest (I criteria) with the help of underwriters when Secondary Offerings are completed, however they can typically be a short-term hindrance to price progress.
>>> The latest Featured Stock Update with an annotated graph appeared on 5/30/2013. Click here.
View all notes |
Alert me of new notes |
CANSLIM.net Company Profile |
SEC |
Zacks Reports |
StockTalk |
News |
Chart |
Request a new note
C
A N
S L
I M


|
AMBA
-
NASDAQ
Ambarella Inc
ELECTRONICS - Semiconductor - Specialized
|
$16.19
|
+0.48
3.06% |
$16.32
|
1,047,911
126.03% of 50 DAV
50 DAV is 831,500
|
$17.90
-9.55%
|
5/6/2013
|
$15.31
|
PP = $16.10
|
|
MB = $16.91
|
Most Recent Note - 6/4/2013 6:59:04 PM
Y - Tallied a solid gain with above average volume today against a mostly negative market backdrop. Consolidating above its 50 DMA line ($14.53 now) an important chart support level to watch.
>>> The latest Featured Stock Update with an annotated graph appeared on 5/29/2013. Click here.
View all notes |
Alert me of new notes |
CANSLIM.net Company Profile |
SEC |
Zacks Reports |
StockTalk |
News |
Chart |
Request a new note
C
A N
S L
I M
|
CELG
-
NASDAQ
Celgene Corp
DRUGS - Drug Manufacturers - Major
|
$117.77
|
-3.12
-2.58% |
$121.44
|
3,689,620
118.10% of 50 DAV
50 DAV is 3,124,200
|
$131.82
-10.66%
|
3/27/2013
|
$113.24
|
PP = $115.54
|
|
MB = $121.32
|
Most Recent Note - 6/4/2013 7:03:50 PM
G - Slumped below its 50 DMA line with 3rd consecutive loss backed by above average volume triggering a technical sell signal. Prior low (5/02/13 low $114.05) defines the next important near-term chart support where a violation may raise more serious concerns.
>>> The latest Featured Stock Update with an annotated graph appeared on 5/13/2013. Click here.
View all notes |
Alert me of new notes |
CANSLIM.net Company Profile |
SEC |
Zacks Reports |
StockTalk |
News |
Chart |
Request a new note
C
A N
S L
I M
|
EQM
-
NYSE
E Q T Midstream Partners
ENERGY - Oil and Gas Pipelines
|
$46.25
|
-1.30
-2.73% |
$47.86
|
312,544
301.39% of 50 DAV
50 DAV is 103,700
|
$51.72
-10.58%
|
4/25/2013
|
$40.16
|
PP = $40.84
|
|
MB = $42.88
|
Most Recent Note - 6/4/2013 7:01:35 PM
G - Down with above average volume today, encountering distributional pressure. Retreating since a "negative reversal" on 5/28/13 at its 52-week high. Still well above its 50 DMA line defining important near-term chart support.
>>> The latest Featured Stock Update with an annotated graph appeared on 5/16/2013. Click here.
View all notes |
Alert me of new notes |
CANSLIM.net Company Profile |
SEC |
Zacks Reports |
StockTalk |
News |
Chart |
Request a new note
C
A N
S L
I M
|
FLT
-
NYSE
Fleetcor Technologies
DIVERSIFIED SERVICES - Business/Management Services
|
$85.33
|
-0.81
-0.94% |
$86.96
|
873,107
95.21% of 50 DAV
50 DAV is 917,000
|
$88.83
-3.94%
|
5/29/2013
|
$86.02
|
PP = $85.66
|
|
MB = $89.94
|
Most Recent Note - 5/31/2013 7:33:26 PM
Y- Was last noted in the mid-day report on 5/29/13 with a new pivot point cited based on its 5/03/13 high, and it rose from an advanced "3-weeks tight" base with a gain on the session backed by +56% above average volume. It may go on to produce more climactic gains, however this was a riskier "late-stage" base. See the latest FSU analysis for more details and a new annotated graph.
>>> The latest Featured Stock Update with an annotated graph appeared on 5/31/2013. Click here.
View all notes |
Alert me of new notes |
CANSLIM.net Company Profile |
SEC |
Zacks Reports |
StockTalk |
News |
Chart |
Request a new note
C
A N
S L
I M
|
Symbol/Exchange
Company Name
Industry Group |
PRICE |
CHANGE
(%Change) |
Day High |
Volume
(% DAV)
(% 50 day avg vol) |
52 Wk Hi
% From Hi |
Featured
Date |
Price
Featured |
Pivot Featured |
|
Max Buy |
LOPE
-
NASDAQ
Grand Canyon Education
DIVERSIFIED SERVICES - Education and; Training Services
|
$31.59
|
-0.38
-1.19% |
$32.23
|
379,688
94.47% of 50 DAV
50 DAV is 401,900
|
$34.07
-7.28%
|
5/10/2013
|
$29.03
|
PP = $27.28
|
|
MB = $28.64
|
Most Recent Note - 6/3/2013 5:43:15 PM
G - Volume totals have been cooling while holding its ground stubbornly perched at its 52-week high, very extended from its previous base. Prior highs in the $27 area define support to watch on pullbacks. Gains of greater than +20% in the first 2-3 weeks following its "breakaway gap" suggest holding for a minimum of 8 week under the fact-based investment system's rules. See the latest FSU analysis for more details and a new annotated graph.
>>> The latest Featured Stock Update with an annotated graph appeared on 6/3/2013. Click here.
View all notes |
Alert me of new notes |
CANSLIM.net Company Profile |
SEC |
Zacks Reports |
StockTalk |
News |
Chart |
Request a new note
C
A N
S L
I M
|
MRLN
-
NASDAQ
Marlin Business Services
DIVERSIFIED SERVICES - Rental and Leasing Services
|
$23.18
|
+0.22
0.96% |
$23.84
|
23,479
100.34% of 50 DAV
50 DAV is 23,400
|
$25.97
-10.74%
|
3/15/2013
|
$22.29
|
PP = $23.18
|
|
MB = $24.34
|
Most Recent Note - 6/3/2013 2:02:46 PM
G - Slumping under its 50 DMA line and its color code is changed to green. The recent low ($21.49 on 5/23/13) defines important near-term support below that short-term average where a violation would raise more serious concerns.
>>> The latest Featured Stock Update with an annotated graph appeared on 5/23/2013. Click here.
View all notes |
Alert me of new notes |
CANSLIM.net Company Profile |
SEC |
Zacks Reports |
StockTalk |
News |
Chart |
Request a new note
C
A N
S L
I M
|
NSM
-
NYSE
Nationstar Mtg Hldgs Inc
FINANCIAL SERVICES - Credit Services
|
$41.63
|
-0.10
-0.24% |
$42.45
|
982,621
77.39% of 50 DAV
50 DAV is 1,269,700
|
$46.91
-11.26%
|
5/7/2013
|
$39.71
|
PP = $42.34
|
|
MB = $44.46
|
Most Recent Note - 6/3/2013 4:30:52 PM
Y - Volume was below average behind today's gain following a spurt of damaging losses marked by above average volume. Weak action recently negated its prior breakout and raised concerns. Disciplined investors always limit losses if any stock falls more than -7% from their purchase price.
>>> The latest Featured Stock Update with an annotated graph appeared on 5/28/2013. Click here.
View all notes |
Alert me of new notes |
CANSLIM.net Company Profile |
SEC |
Zacks Reports |
StockTalk |
News |
Chart |
Request a new note
C
A N
S L
I M
|
PRAA
-
NASDAQ
Portfolio Recovery Assoc
DIVERSIFIED SERVICES - Business/Management Services
|
$150.41
|
-2.14
-1.40% |
$152.92
|
92,835
134.74% of 50 DAV
50 DAV is 68,900
|
$153.85
-2.24%
|
5/1/2013
|
$130.77
|
PP = $127.88
|
|
MB = $134.27
|
Most Recent Note - 5/30/2013 4:55:19 PM
G - Edged higher with below average volume today for a 4th consecutive gain and its best-ever close. Very extended from prior highs in the $127 area and well above its 50 DMA line defining important chart support.
>>> The latest Featured Stock Update with an annotated graph appeared on 5/22/2013. Click here.
View all notes |
Alert me of new notes |
CANSLIM.net Company Profile |
SEC |
Zacks Reports |
StockTalk |
News |
Chart |
Request a new note
C
A N
S L
I M
|
PRLB
-
NYSE
Proto Labs Inc
MANUFACTURING - Small Tools and Accessories
|
$53.00
|
+0.04
0.08% |
$53.82
|
130,956
23.68% of 50 DAV
50 DAV is 553,000
|
$59.84
-11.43%
|
5/3/2013
|
$54.77
|
PP = $54.01
|
|
MB = $56.71
|
Most Recent Note - 6/3/2013 2:10:12 PM
Y - Pulling back again today on light volume. Stayed well above its 50 DMA line during its recent consolidation, but a violation may trigger a technical sell signal.
>>> The latest Featured Stock Update with an annotated graph appeared on 5/24/2013. Click here.
View all notes |
Alert me of new notes |
CANSLIM.net Company Profile |
SEC |
Zacks Reports |
StockTalk |
News |
Chart |
Request a new note
C
A N
S L
I M
|
Symbol/Exchange
Company Name
Industry Group |
PRICE |
CHANGE
(%Change) |
Day High |
Volume
(% DAV)
(% 50 day avg vol) |
52 Wk Hi
% From Hi |
Featured
Date |
Price
Featured |
Pivot Featured |
|
Max Buy |
RRTS
-
NYSE
Roadrunner Trans Systems
TRANSPORTATION - Air Delivery and Freight Service
|
$27.77
|
-0.43
-1.52% |
$28.22
|
159,311
76.92% of 50 DAV
50 DAV is 207,100
|
$28.24
-1.66%
|
4/3/2013
|
$22.77
|
PP = $23.75
|
|
MB = $24.94
|
Most Recent Note - 6/4/2013 6:54:11 PM
G - Volume totals have been cooling while hovering at all-time highs. Fundamental concerns were raised by its sub par earnings increase in the Mar '13 quarter, below the +25% minimum guideline (C criteria). See the latest FSU analysis for more details and a new annotated graph.
>>> The latest Featured Stock Update with an annotated graph appeared on 6/4/2013. Click here.
View all notes |
Alert me of new notes |
CANSLIM.net Company Profile |
SEC |
Zacks Reports |
StockTalk |
News |
Chart |
Request a new note
C
A N
S L
I M
|
VRX
-
NYSE
Valeant Pharmaceuticals
DRUGS - Drug Manufacturers - Other
|
$85.18
|
-3.03
-3.43% |
$89.27
|
1,917,952
104.96% of 50 DAV
50 DAV is 1,827,400
|
$96.25
-11.50%
|
4/30/2013
|
$60.24
|
PP = $76.66
|
|
MB = $80.49
|
Most Recent Note - 6/4/2013 6:56:15 PM
G- Ended near the session low with a loss on average volume. It is extended from prior highs and prior reports cautioned - "Sub par earnings for the Mar '13 quarter below the +25% minimum guideline (C criteria) raised fundamental concerns."
>>> The latest Featured Stock Update with an annotated graph appeared on 5/17/2013. Click here.
View all notes |
Alert me of new notes |
CANSLIM.net Company Profile |
SEC |
Zacks Reports |
StockTalk |
News |
Chart |
Request a new note
C
A N
S L
I M
|
|
|
|
THESE ARE NOT BUY RECOMMENDATIONS!
Comments contained in the body of this report are technical
opinions only. The material herein has been obtained
from sources believed to be reliable and accurate, however,
its accuracy and completeness cannot be guaranteed.
This site is not an investment advisor, hence it does
not endorse or recommend any securities or other investments.
Any recommendation contained in this report may not
be suitable for all investors and it is not to be deemed
an offer or solicitation on our part with respect to
the purchase or sale of any securities. All trademarks,
service marks and trade names appearing in this report
are the property of their respective owners, and are
likewise used for identification purposes only.
This report is a service available
only to active Paid Premium Members.
You may opt-out of receiving report notifications
at any time. Questions or comments may be submitted
by writing to Premium Membership Services 665 S.E. 10 Street, Suite 201 Deerfield Beach, FL 33441-5634 or by calling 1-800-965-8307
or 954-785-1121.
|
|
|

