You are not logged in.
This means you
CAN ONLY VIEW reports that were published prior to Monday, April 14, 2025.
You
MUST UPGRADE YOUR MEMBERSHIP if you want to see any current reports.
AFTER MARKET UPDATE - MONDAY, JUNE 4TH, 2012
Previous After Market Report Next After Market Report >>>
|
|
|
|
DOW |
-17.11 |
12,101.46 |
-0.14% |
|
Volume |
824,335,940 |
-18% |
|
Volume |
1,701,896,930 |
-11% |
|
NASDAQ |
+12.53 |
2,760.01 |
+0.46% |
|
Advancers |
1,288 |
41% |
|
Advancers |
1,245 |
48% |
|
S&P 500 |
+0.14 |
1,278.18 |
+0.01% |
|
Decliners |
1,776 |
56% |
|
Decliners |
1,267 |
48% |
|
Russell 2000 |
-0.18 |
737.24 |
-0.02% |
|
52 Wk Highs |
22 |
|
|
52 Wk Highs |
14 |
|
|
S&P 600 |
-0.08 |
414.87 |
-0.02% |
|
52 Wk Lows |
155 |
|
|
52 Wk Lows |
138 |
|
|
 |
Major Averages Finished Mixed While Volume Cooled
Kenneth J. Gruneisen - Passed the CAN SLIM® Master's Exam
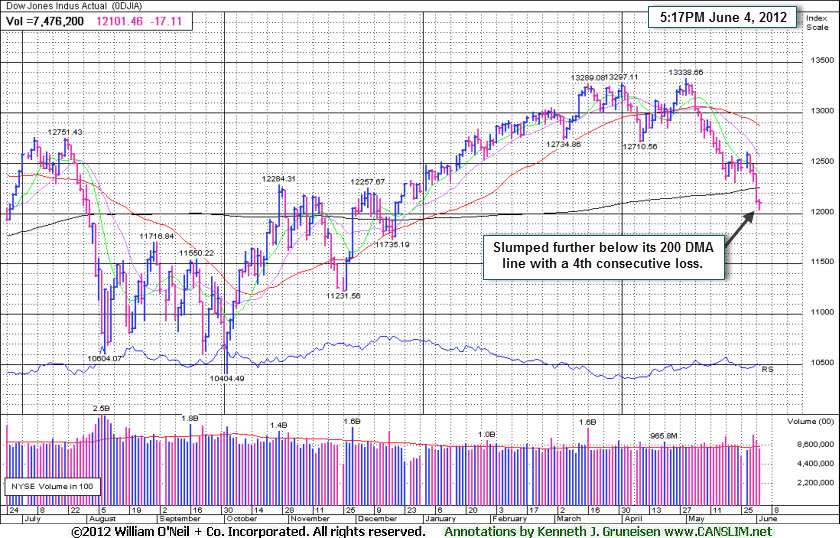
The major averages pared their deepest declines to finish with mixed results on Monday's session. All three of the major averages collectively closed below their longer-term 200-day moving average lines again. Volume was reported lighter than the prior session totals on the Nasdaq exchange and on the NYSE. Breadth was negative as decliners led advancers by about 3-2 on the NYSE while the mix was nearly even on the Nasdaq exchange. The total number of new 52-week lows solidly outnumbered new 52-week highs on the NYSE and on the Nasdaq exchange. There were 3 high-ranked companies from the CANSLIM.net Leaders List made new 52-week highs and appeared on the CANSLIM.net BreakOuts Page, up from the prior session total of 0 stocks. There were gains for 8 of the 15 high-ranked companies currently included on the Featured Stocks Page.
Stocks staged a comeback in the closing minutes of trading. Speculation of further easing from the Federal Reserve helped investors overlook weak U.S. economic data and lingering concerns surrounding Europe. U.S. factory orders in April unexpectedly declined by -0.6%, missing consensus projections for a +0.2% advance.
Industrial and material stocks were the worst performing stocks as global growth concerns weighed on the sector. Caterpillar Inc (CAT -2.64%) was among the big decliners weighing the Dow Jones Industrial Average into the red. Homebuilders including Toll Brothers (TOL -5.07%) also traded in weakness. Telecom stocks were a top performing sector as AT&T Inc (T +0.74%) and Verizon Communications Inc (VZ +0.76%) rung up modest gains. In other news, shares of Facebook, Inc (FB -2.96%) continue to slide.
In bondland, Treasuries were lower along the curve. The benchmark 10-year note was off 5/8 of a point to yield 1.52% and the 30-year bond was down nearly a full point to yield 2.57%.
The major averages (M criteria) are technically considered to be in a "correction" and stocks remain vulnerable to much greater downside, a point repeatedly included in bold in this commentary! Historical studies suggest that the most constructive market rallies produced a solid follow-through day (FTD) between Days 4-7 of a new rally effort. Gains of +1.4% or greater by at least one of the major indexes should be backed by higher volume and preferably above average volume coupled with an expansion in the number of stocks hitting new highs. Only fresh technical proof may give fact-based investors the clearance to begin with new buying efforts strictly in sound buy candidates. Meanwhile, investors should keep up a watchlist of worthy buy candidates while remaining protective of capital.
PICTURED: The Dow Jones Industrial Average slumped further below its 200-day moving average (DMA) line with a 4th consecutive loss. The small gains for the Nasdaq Composite Index and S&P 500 Index (not shown) could meanwhile be noted as a new "Day 1" for another rally attempt.
|
 Kenneth J. Gruneisen started out as a licensed stockbroker in August 1987, a couple of months prior to the historic stock market crash that took the Dow Jones Industrial Average down -22.6% in a single day. He has published daily fact-based fundamental and technical analysis on high-ranked stocks online for two decades. Through FACTBASEDINVESTING.COM, Kenneth provides educational articles, news, market commentary, and other information regarding proven investment systems that work in good times and bad.
Comments contained in the body of this report are technical opinions only and are not necessarily those of Gruneisen Growth Corp. The material herein has been obtained from sources believed to be reliable and accurate, however, its accuracy and completeness cannot be guaranteed. Our firm, employees, and customers may effect transactions, including transactions contrary to any recommendation herein, or have positions in the securities mentioned herein or options with respect thereto. Any recommendation contained in this report may not be suitable for all investors and it is not to be deemed an offer or solicitation on our part with respect to the purchase or sale of any securities. |
|
 |
Financials Fell; Retail and Gold & Silver Index Posted Gains
Kenneth J. Gruneisen - Passed the CAN SLIM® Master's Exam
The Retail Index ($RLX +1.08%) and the Gold & Silver Index ($XAU +1.19%) were standout gainers on Monday. However, losses dragged the Bank Index ($BKX -2.22%) and Broker/Dealer Index ($XBD -1.35%) lower, whereas strength from those important leading indicators would be a more encouraging sign for investors. The Internet Index ($IIX +0.58%) posted a small gain while the Networking Index ($NWX -0.29%), Biotechnology Index ($BTK -0.15%), and Semiconductor Index ($SOX -0.14%) each suffered small losses. The Healthcare Index ($HMO -0.06%) was flat, meanwhile energy-related shares were mixed and little changed as the Oil Services Index ($OSX -0.19%) edged lower and the Integrated Oil Index ($XOI +0.12%) edged higher.
Charts courtesy www.stockcharts.com
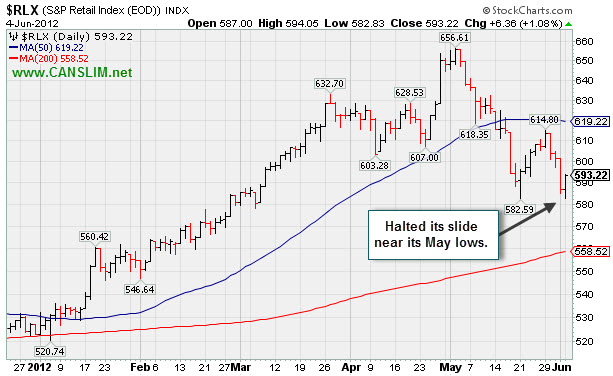
PICTURED: The Retail Index's ($RLX +1.08%) gain halted its 3-day slide near its May lows.
| Oil Services |
$OSX |
195.64 |
-0.38 |
-0.19% |
-9.54% |
| Healthcare |
$HMO |
2,228.63 |
-1.34 |
-0.06% |
-2.32% |
| Integrated Oil |
$XOI |
1,074.00 |
+1.25 |
+0.12% |
-12.62% |
| Semiconductor |
$SOX |
352.69 |
-0.48 |
-0.14% |
-3.22% |
| Networking |
$NWX |
199.00 |
-0.57 |
-0.29% |
-7.51% |
| Internet |
$IIX |
287.47 |
+1.66 |
+0.58% |
+2.03% |
| Broker/Dealer |
$XBD |
81.88 |
-1.12 |
-1.35% |
-1.67% |
| Retail |
$RLX |
593.22 |
+6.36 |
+1.08% |
+13.38% |
| Gold & Silver |
$XAU |
164.65 |
+1.94 |
+1.19% |
-8.85% |
| Bank |
$BKX |
41.00 |
-0.93 |
-2.22% |
+4.11% |
| Biotech |
$BTK |
1,380.02 |
-2.09 |
-0.15% |
+26.44% |
|
|
|
 |
Consolidating Above 50-Day Moving Average and Prior Highs
Kenneth J. Gruneisen - Passed the CAN SLIM® Master's Exam
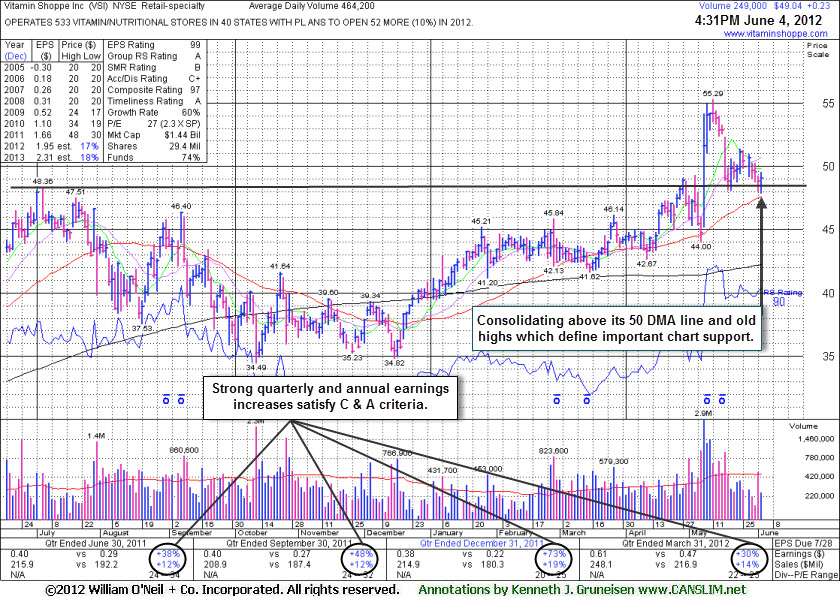
Vitamin Shoppe Inc (VSI +$0.23 or +0.47% to $49.04) halted its slide today with a small gain on light volume. During its consolidation it has slumped near its 50-day moving average (DMA) line. Support to watch is defined by that important short-term average and its old highs in the $48 area. It may eventually build a new base-on-base type pattern, yet meanwhile the direction of the broader market averages (M criteria) would need to be helped by a confirmed rally with follow-through day (FTD) before any new (or add-on) buying efforts might be justified.
It was last shown in this FSU section on 4/25/12 with an annotated graph under the headline, "Fundamentals Strong After 10-Month Cup Shaped Base", when we observed - "In the context of great winners illustrated in the book, "How to Make Money in Stocks", one may argue that a powerful breakout to new 52-week high territory could be far more telling as to its ability to go on producing gains and make a meaningful advance in the coming days and weeks." Subsequent volume-driven gains came after it reported another quarter of strong earnings growth. The gains on 5/08/12 and 5/09/12 resulted in a convincing breakout to new 52-week highs clearing the pivot point cited and triggering a new (or add-on) technical buy signal.
Fundamentally, it has earned high ranks after showing strong quarterly and annual earnings increases satisfying the C and A criteria. The number of top-rated funds owning its shares rose from 290 in Jun '11 to 334 in Mar '12, a reassuring sign concerning the I criteria. Leadership (L criteria) provided by its peer in the Retail - Specialty group, GNC Holdings Inc (GNC), has been cited as another reassuring sign. Vitamin Shoppe (29.4 million) has less than 1/3 as many shares outstanding as GNC (106.5 million). That small supply is not a bad thing, but could contribute to greater price volatility. However, historic studies have shown that once companies have grown their supply (S criteria) of shares outstanding to hundreds of millions, or even billions of shares outstanding, they are less likely candidates to be "above average" gainers.
|
|
|
Color Codes Explained :
Y - Better candidates highlighted by our
staff of experts.
G - Previously featured
in past reports as yellow but may no longer be buyable under the
guidelines.
***Last / Change / Volume data in this table is the closing quote data***
Symbol/Exchange
Company Name
Industry Group |
PRICE |
CHANGE
(%Change) |
Day High |
Volume
(% DAV)
(% 50 day avg vol) |
52 Wk Hi
% From Hi |
Featured
Date |
Price
Featured |
Pivot Featured |
|
Max Buy |
ALXN
-
NASDAQ
Alexion Pharmaceuticals
DRUGS - Drug Manufacturers - Other
|
$88.39
|
+0.79
0.90% |
$88.48
|
1,989,688
97.12% of 50 DAV
50 DAV is 2,048,700
|
$95.01
-6.97%
|
5/1/2012
|
$91.73
|
PP = $95.11
|
|
MB = $99.87
|
Most Recent Note - 6/1/2012 7:12:59 PM
G - Color code is changed to green after a 5th consecutive loss led to a close below its 50 DMA line. Faces some resistance in the $94-95 area.
>>> The latest Featured Stock Update with an annotated graph appeared on 5/31/2012. Click here.
View all notes |
Alert me of new notes |
CANSLIM.net Company Profile |
SEC |
Zacks Reports |
StockTalk |
News |
Chart |
Request a new note
C
A N
S L
I M


|
ARBA
-
NASDAQ
Zumiez Inc
INTERNET - Internet Software and Services
|
$44.60
|
-0.20
-0.45% |
$44.75
|
4,997,505
1,254.08% of 50 DAV
50 DAV is 398,500
|
$45.48
-1.93%
|
4/27/2012
|
$38.53
|
PP = $37.24
|
|
MB = $39.10
|
 Most Recent Note - 6/4/2012 12:02:29 PM
G - Holding its ground near its 52-week high since a considerable gain on 5/22/12 with heavy volume on news it will be bought by SAP in a $4.3 billion deal.
>>> The latest Featured Stock Update with an annotated graph appeared on 4/30/2012. Click here.
View all notes |
Alert me of new notes |
CANSLIM.net Company Profile |
SEC |
Zacks Reports |
StockTalk |
News |
Chart |
Request a new note
C
A N
S L
I M
|
CERN
-
NASDAQ
Cerner Corp
COMPUTER SOFTWARE and SERVICES - Healthcare Information Service
|
$76.47
|
+0.10
0.13% |
$77.34
|
1,510,384
123.15% of 50 DAV
50 DAV is 1,226,500
|
$84.10
-9.07%
|
4/27/2012
|
$77.23
|
PP = $78.63
|
|
MB = $82.56
|
Most Recent Note - 6/1/2012 7:09:29 PM
G - Color code is changed to green after a gap down today and violation of its 50 DMA line and prior lows with a 2nd consecutive loss on above average volume.
>>> The latest Featured Stock Update with an annotated graph appeared on 5/1/2012. Click here.
View all notes |
Alert me of new notes |
CANSLIM.net Company Profile |
SEC |
Zacks Reports |
StockTalk |
News |
Chart |
Request a new note
C
A N
S L
I M
|
CMCSA
-
NASDAQ
Comcast Corp Cl A
MEDIA - CATV Systems
|
$28.95
|
+0.32
1.12% |
$29.05
|
21,242,584
166.90% of 50 DAV
50 DAV is 12,728,000
|
$30.88
-6.23%
|
5/2/2012
|
$30.04
|
PP = $30.51
|
|
MB = $32.04
|
Most Recent Note - 6/4/2012 12:10:41 PM
G - Still sputtering below its 50 DMA line which is now downward sloping. The prior low ($28.09 on 5/21/12) defines important near-term support to watch where further deterioration would raise more serious concerns.
>>> The latest Featured Stock Update with an annotated graph appeared on 5/7/2012. Click here.
View all notes |
Alert me of new notes |
CANSLIM.net Company Profile |
SEC |
Zacks Reports |
StockTalk |
News |
Chart |
Request a new note
C
A N
S L
I M
|
COO
-
NYSE
Cooper Companies Inc
HEALTH SERVICES - Medical Instruments and Supplies
|
$79.30
|
-3.57
-4.31% |
$82.67
|
1,014,557
227.48% of 50 DAV
50 DAV is 446,000
|
$89.31
-11.21%
|
3/9/2012
|
$83.05
|
PP = $81.02
|
|
MB = $85.07
|
Most Recent Note - 6/4/2012 1:16:32 PM
G - Slumping further below its 50 DMA line with today's 4th consecutive loss, violating prior highs in the $83-84 area and triggering more worrisome technical sell signals.
>>> The latest Featured Stock Update with an annotated graph appeared on 5/18/2012. Click here.
View all notes |
Alert me of new notes |
CANSLIM.net Company Profile |
SEC |
Zacks Reports |
StockTalk |
News |
Chart |
Request a new note
C
A N
S L
I M
|
Symbol/Exchange
Company Name
Industry Group |
PRICE |
CHANGE
(%Change) |
Day High |
Volume
(% DAV)
(% 50 day avg vol) |
52 Wk Hi
% From Hi |
Featured
Date |
Price
Featured |
Pivot Featured |
|
Max Buy |
DG
-
NYSE
Dollar General Corp
RETAIL - Discount, Variety Stores
|
$48.49
|
-0.13
-0.27% |
$48.97
|
5,186,903
180.93% of 50 DAV
50 DAV is 2,866,800
|
$49.50
-2.04%
|
5/7/2012
|
$48.51
|
PP = $47.69
|
|
MB = $50.07
|
Most Recent Note - 6/1/2012 11:54:38 AM
Y - Pulling back today from new all-time highs hit this week after 3 consecutive gains. No resistance remains due to overhead supply. The broader market (M criteria) has yet to confirm a new rally, however, and without a solid follow-through day from at least one of the major averages all new buying efforts are discouraged under the fact-based investment system.
>>> The latest Featured Stock Update with an annotated graph appeared on 5/9/2012. Click here.
View all notes |
Alert me of new notes |
CANSLIM.net Company Profile |
SEC |
Zacks Reports |
StockTalk |
News |
Chart |
Request a new note
C
A N
S L
I M
|
EXPE
-
NASDAQ
Expedia Inc
INTERNET - Internet Information Providers
|
$44.93
|
+0.28
0.63% |
$45.43
|
3,682,514
78.44% of 50 DAV
50 DAV is 4,694,800
|
$46.49
-3.36%
|
4/27/2012
|
$41.80
|
PP = $35.57
|
|
MB = $37.35
|
Most Recent Note - 6/1/2012 2:04:26 PM
G - Pulling back from its 52-week high today after a spurt of 3 consecutive gains. As previously noted, heavy volume behind a considerable gain on 5/23/12 technically helped it break out from an advanced "3-weeks tight" base with no resistance remaining due to overhead supply, however no new pivot point was cited. Until the market confirms a new rally with a solid follow through day from at least one of the major averages (M criteria) the fact-based investment system argues against new buying efforts in any stocks.
>>> The latest Featured Stock Update with an annotated graph appeared on 5/3/2012. Click here.
View all notes |
Alert me of new notes |
CANSLIM.net Company Profile |
SEC |
Zacks Reports |
StockTalk |
News |
Chart |
Request a new note
C
A N
S L
I M
|
GNC
-
NYSE
G N C Holdings Inc
RETAIL - Drug Stores
|
$36.50
|
-0.09
-0.25% |
$37.17
|
1,885,282
100.59% of 50 DAV
50 DAV is 1,874,300
|
$41.95
-12.99%
|
1/19/2012
|
$28.99
|
PP = $29.60
|
|
MB = $31.08
|
Most Recent Note - 6/1/2012 2:07:55 PM
G - Slumping below its 50 DMA line today, raising concerns with its 5th consecutive loss on ever-increasing volume. Prior low ($35.13 on 5/18/12) defines the next important chart support where a violation would raise more serious concerns
>>> The latest Featured Stock Update with an annotated graph appeared on 4/26/2012. Click here.
View all notes |
Alert me of new notes |
CANSLIM.net Company Profile |
SEC |
Zacks Reports |
StockTalk |
News |
Chart |
Request a new note
C
A N
S L
I M
|
NTES
-
NASDAQ
Netease Inc Adr
INTERNET - Internet Information Providers
|
$59.21
|
-0.83
-1.38% |
$60.88
|
520,799
69.96% of 50 DAV
50 DAV is 744,400
|
$63.07
-6.12%
|
3/19/2012
|
$56.18
|
PP = $55.10
|
|
MB = $57.86
|
Most Recent Note - 6/1/2012 12:05:25 PM
G - Pulling back today after 3 consecutive gains to within close striking distance of its 52-week high. It has not formed a sound base pattern. Recent lows near the $55 area define important chart support to watch where a violation may trigger a worrisome technical sell signal.
>>> The latest Featured Stock Update with an annotated graph appeared on 5/24/2012. Click here.
View all notes |
Alert me of new notes |
CANSLIM.net Company Profile |
SEC |
Zacks Reports |
StockTalk |
News |
Chart |
Request a new note
C
A N
S L
I M
|
SWI
-
NYSE
Solarwinds Inc
COMPUTER SOFTWARE and SERVICES - Application Software
|
$42.56
|
-0.01
-0.02% |
$43.25
|
1,045,012
91.72% of 50 DAV
50 DAV is 1,139,300
|
$48.64
-12.50%
|
4/26/2012
|
$45.15
|
PP = $42.32
|
|
MB = $44.44
|
Most Recent Note - 6/1/2012 1:51:44 PM
G - Damaging loss today has undercut prior lows and has it slumping near its 50 DMA line defining important support. A violation of that short-term average may trigger a more worrisome technical sell signal.
>>> The latest Featured Stock Update with an annotated graph appeared on 5/21/2012. Click here.
View all notes |
Alert me of new notes |
CANSLIM.net Company Profile |
SEC |
Zacks Reports |
StockTalk |
News |
Chart |
Request a new note
C
A N
S L
I M
|
Symbol/Exchange
Company Name
Industry Group |
PRICE |
CHANGE
(%Change) |
Day High |
Volume
(% DAV)
(% 50 day avg vol) |
52 Wk Hi
% From Hi |
Featured
Date |
Price
Featured |
Pivot Featured |
|
Max Buy |
SXCI
-
NASDAQ
S X C Health Solutions
COMPUTER SOFTWARE and SERVICES - Healthcare Information Service
|
$87.88
|
-0.68
-0.77% |
$89.51
|
690,037
58.20% of 50 DAV
50 DAV is 1,185,700
|
$100.50
-12.56%
|
2/23/2012
|
$68.24
|
PP = $66.05
|
|
MB = $69.35
|
Most Recent Note - 6/4/2012 1:18:57 PM
G - Sinking near its 50 DMA line ($86.03) defining important support to watch. Completed a new Public Offering on 5/10/12. Consolidating in a tight range since it posted huge volume-driven gains on 4/18 and 4/19 while rallying on M&A news.
>>> The latest Featured Stock Update with an annotated graph appeared on 5/17/2012. Click here.
View all notes |
Alert me of new notes |
CANSLIM.net Company Profile |
SEC |
Zacks Reports |
StockTalk |
News |
Chart |
Request a new note
C
A N
S L
I M
|
TDG
-
NYSE
Transdigm Group Inc
AEROSPACE/DEFENSE - Aerospace/Defense Products and; Services
|
$121.73
|
+0.02
0.02% |
$122.36
|
573,082
109.62% of 50 DAV
50 DAV is 522,800
|
$132.69
-8.26%
|
2/29/2012
|
$120.10
|
PP = $118.93
|
|
MB = $124.88
|
Most Recent Note - 6/4/2012 1:21:13 PM
G - Slumping today near important support at its 50 DMA line. Its prior low ($118.43 on 5/18/12) defines the next important near-term chart support level to watch.
>>> The latest Featured Stock Update with an annotated graph appeared on 5/23/2012. Click here.
View all notes |
Alert me of new notes |
CANSLIM.net Company Profile |
SEC |
Zacks Reports |
StockTalk |
News |
Chart |
Request a new note
C
A N
S L
I M
|
UA
-
NYSE
Under Armour Inc Cl A
CONSUMER NON-DURABLES - Textile - Apparel Clothing
|
$97.31
|
+1.56
1.63% |
$97.89
|
886,480
95.53% of 50 DAV
50 DAV is 928,000
|
$102.86
-5.40%
|
2/15/2012
|
$85.77
|
PP = $84.86
|
|
MB = $89.10
|
Most Recent Note - 6/1/2012 1:56:38 PM
G - Slumping under its 50 DMA line today after a gap down amid widespread market weakness. Concerns were recently raised by weaker fundamentals, its first quarterly earnings increase below the +25% minimum guideline in more than 2 years.
>>> The latest Featured Stock Update with an annotated graph appeared on 5/29/2012. Click here.
View all notes |
Alert me of new notes |
CANSLIM.net Company Profile |
SEC |
Zacks Reports |
StockTalk |
News |
Chart |
Request a new note
C
A N
S L
I M
|
VSI
-
NYSE
Vitamin Shoppe Inc
SPECIALTY RETAIL - Specialty Retail, Other
|
$49.04
|
+0.23
0.47% |
$49.52
|
265,191
57.13% of 50 DAV
50 DAV is 464,200
|
$55.29
-11.30%
|
4/25/2012
|
$47.77
|
PP = $48.46
|
|
MB = $50.88
|
Most Recent Note - 6/4/2012 4:30:02 PM
G - Halted its slide with a small gain today on light volume. Slumped near its 50 DMA line with 3 consecutive losses. Support to watch is defined by that important short-term average and its old highs in the $48 area.
>>> The latest Featured Stock Update with an annotated graph appeared on 6/4/2012. Click here.
View all notes |
Alert me of new notes |
CANSLIM.net Company Profile |
SEC |
Zacks Reports |
StockTalk |
News |
Chart |
Request a new note
C
A N
S L
I M
|
WFM
-
NASDAQ
Whole Foods Market Inc
RETAIL - Grocery Stores
|
$86.55
|
+0.87
1.02% |
$86.67
|
1,714,486
98.25% of 50 DAV
50 DAV is 1,745,000
|
$91.50
-5.41%
|
5/3/2012
|
$90.28
|
PP = $86.45
|
|
MB = $90.77
|
Most Recent Note - 6/1/2012 12:25:45 PM
G - Encountered distributional pressure this week while rebounding toward its 52-week high. Recently found prompt support near its 50 DMA line but damaging losses negated the latest technical breakout after it stalled following its considerable "breakaway gap" on 5/03/12.
>>> The latest Featured Stock Update with an annotated graph appeared on 5/11/2012. Click here.
View all notes |
Alert me of new notes |
CANSLIM.net Company Profile |
SEC |
Zacks Reports |
StockTalk |
News |
Chart |
Request a new note
C
A N
S L
I M
|
Symbol/Exchange
Company Name
Industry Group |
PRICE |
CHANGE
(%Change) |
Day High |
Volume
(% DAV)
(% 50 day avg vol) |
52 Wk Hi
% From Hi |
Featured
Date |
Price
Featured |
Pivot Featured |
|
Max Buy |
|
|
|
THESE ARE NOT BUY RECOMMENDATIONS!
Comments contained in the body of this report are technical
opinions only. The material herein has been obtained
from sources believed to be reliable and accurate, however,
its accuracy and completeness cannot be guaranteed.
This site is not an investment advisor, hence it does
not endorse or recommend any securities or other investments.
Any recommendation contained in this report may not
be suitable for all investors and it is not to be deemed
an offer or solicitation on our part with respect to
the purchase or sale of any securities. All trademarks,
service marks and trade names appearing in this report
are the property of their respective owners, and are
likewise used for identification purposes only.
This report is a service available
only to active Paid Premium Members.
You may opt-out of receiving report notifications
at any time. Questions or comments may be submitted
by writing to Premium Membership Services 665 S.E. 10 Street, Suite 201 Deerfield Beach, FL 33441-5634 or by calling 1-800-965-8307
or 954-785-1121.
|
|
|

