You are not logged in.
This means you
CAN ONLY VIEW reports that were published prior to Monday, April 14, 2025.
You
MUST UPGRADE YOUR MEMBERSHIP if you want to see any current reports.
AFTER MARKET UPDATE - THURSDAY, JUNE 4TH, 2009
Previous After Market Report Next After Market Report >>>
|
|
|
|
DOW |
+74.96 |
8,750.24 |
+0.86% |
|
Volume |
1,359,254,730 |
+2% |
|
Volume |
2,535,490,320 |
+10% |
|
NASDAQ |
+24.10 |
1,850.02 |
+1.32% |
|
Advancers |
2,341 |
75% |
|
Advancers |
1,956 |
68% |
|
S&P 500 |
+10.70 |
942.46 |
+1.15% |
|
Decliners |
673 |
22% |
|
Decliners |
772 |
27% |
|
Russell 2000 |
+8.97 |
531.68 |
+1.72% |
|
52 Wk Highs |
17 |
|
|
52 Wk Highs |
32 |
|
|
S&P 600 |
+4.75 |
280.80 |
+1.72% |
|
52 Wk Lows |
3 |
|
|
52 Wk Lows |
1 |
|
|
 |
Indices Rise Despite Negative Sales Data
Adam Sarhan, Contributing Writer,
The major averages shrugged off negative retail sales data and ended higher and commodity prices rebounded sharply from yesterday's sell off. Advancers trumped decliners by a 3-to-1 ratio on the NYSE and by over a 2-to-1 ratio on the Nasdaq exchange. It was encouraging to see volume expand compared to the prior session on both major exchanges as the market rallied. Ideally, one would like to see volume expand when the market rallies and contract when it pulls back and this is exactly what has happened in recent sessions. There were 11 high-ranked companies from the CANSLIM.net Leaders List that made a new 52-week high and appeared on the CANSLIM.net BreakOuts Page, matching the 11 issues that appeared on the prior session. The greater expansion recently occurring in the new highs list has offered encouraging news for growth oriented investors.
The major averages ended higher as investors digested tepid retail sales data from several of the country's largest retailers. Wal Mart (WMT -0.02%), the country's largest retailer, announced they will no longer be announcing monthly sales data. In other economic news, the Labor Department said initial jobless claims slid by 4,000 to 621,000 in the week ended May 30. This was in line with forecasts from a revised 625,000 the prior week. The report also showed that the total number of people collecting unemployment insurance fell for the first time in nearly five months which broke the streak of 17 consecutive records. Before Friday's opening bell, the Labor Department will release May's non farm payrolls report. The report will likely show over half a million jobs were cut last month sending the unemployment rate up over +9%! While it is important to study the data, it is even more important to see how the market reacts to that data.
Goldman Sachs (GS +5.15%) released a report saying that crude oil will hit $85 a barrel by the end of this year. The report was released one day after a slew of commodities, including crude oil, fell sharply. It is important to note that in 2008, Goldman released a report calling for a "super-spike" in crude oil. The report said that crude oil would surge to $200 per barrel. Obviously, that "call" was dead wrong. In any event, the market decided to bid crude higher, and at the end of the day, price is king. We should also note that the USD fell on Thursday, which played an important role in the higher commodity prices.
PICTURED: The Nasdaq Composite Index's action continues to be strong. It hit another new high for 2009, and it is also healthy to see its 50-day moving average (DMA) line converging with its 200 DMA line. A bullish crossover would be yet another technical sign of improving strength - a healthier market environment (better M criteria).
|
|
|
 |
Financial, Energy, And Tech Groups Lead Gainers
Kenneth J. Gruneisen - Passed the CAN SLIM® Master's Exam
The financial sector helped underpin the major averages on Thursday as the Broker/Dealer ($XBD +4.32%) and Bank ($BKX +4.81%) indexes were among the leading gainers. Commodity linked areas also advanced as the Gold & Silver ($XAU +3.22%), Oil Services ($OSX +3.25%), and Integrated Oil ($XOI +1.84%) indexes posted solid gains. The Semiconductor ($SOX +2.15%), Networking ($NWX +2.08%), and Internet ($IIX +1.36%) indexes also traded with a positive bias. Recent strength in the biotech index was illustrated in Wednesday's Industry Group Watch section (read here), and today, while posting a 6th consecutive gain, the Biotechnology Index ($BTK +0.09%) lagged the other tech indices. Elsewhere, the Healthcare Index ($HMO -0.17%) inched lower, and the Retail Index ($RLX -1.15%) was a standout laggard.
Charts courtesy www.stockcharts.com
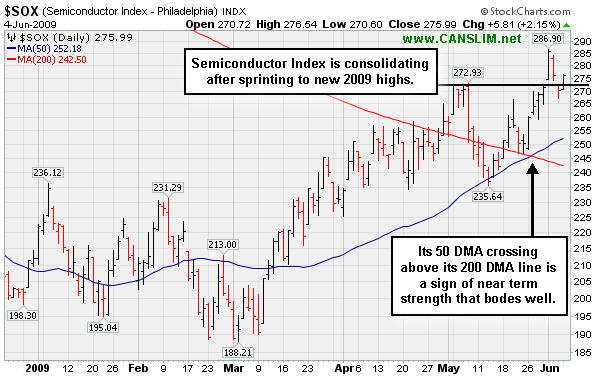
PICTURED: The Semiconductor ($SOX +2.15%) is consolidating after Monday's sprint to new 2009 highs. Its 50-day moving average (DMA) line recently crossed above its 200 DMA line, which is a sign of near-term strength that generally bodes well.
| Oil Services |
$OSX |
180.79 |
+5.69 |
+3.25% |
+48.93% |
| Healthcare |
$HMO |
1,107.71 |
-1.88 |
-0.17% |
+15.36% |
| Integrated Oil |
$XOI |
987.05 |
+17.82 |
+1.84% |
+0.75% |
| Semiconductor |
$SOX |
275.99 |
+5.81 |
+2.15% |
+30.08% |
| Networking |
$NWX |
193.66 |
+3.94 |
+2.08% |
+34.59% |
| Internet |
$IIX |
193.34 |
+2.60 |
+1.36% |
+44.53% |
| Broker/Dealer |
$XBD |
103.66 |
+4.29 |
+4.32% |
+33.81% |
| Retail |
$RLX |
335.21 |
-3.89 |
-1.15% |
+20.04% |
| Gold & Silver |
$XAU |
157.42 |
+4.91 |
+3.22% |
+27.11% |
| Bank |
$BKX |
37.88 |
+1.74 |
+4.81% |
-14.53% |
|
|
|
 |
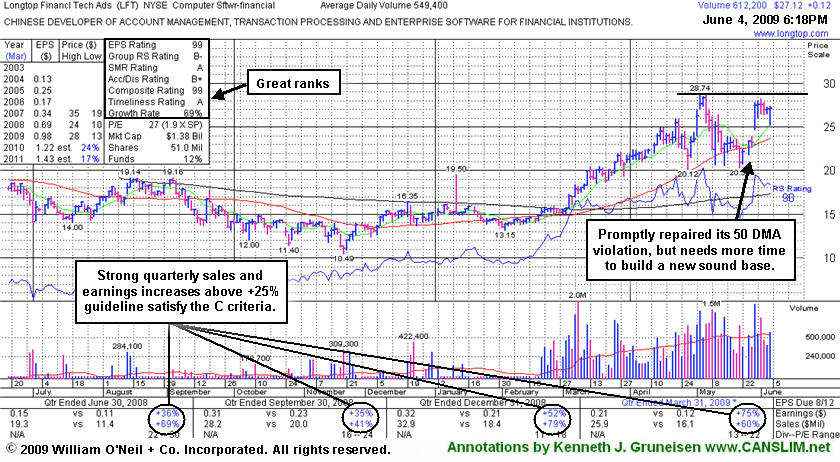
More Time Needed For Another Sound Base To Form
Kenneth J. Gruneisen - Passed the CAN SLIM® Master's Exam
Longtop Financl Tech Ads (LFT +$0.12 or +0.44% to $27.12) has been holding its ground since it gapped up on 5/28/09 after reporting another strong quarter. It needs more time to form another sound base, and its progress could be hindered by future share offerings. The stock's prompt repair of its recent 50-day moving average (DMA) line violation, and its gap up are both indicative of solid institutional (the I criteria) support and buying demand. It found support on its first test of its 50 DMA line, then sprinted to new highs with gains backed by heavier volume, but it was soon hit with a wave of distributional pressure and technically violated its 50 DMA line, triggering a technical sell signal. That prompted its last appearance in this Featured Stock Update section on 5/21/09 under the headline "Technical Violation of 50-Day Average Raises Concerns".
As previously noted, this Chinese Computer Software firm might be hindered by future share offerings. On 4/27/09 it filed a registration of approximately 16 million shares for resale, and revealed a planned acquisition of another Chinese service provider. Often, light volume consolidations under the "max buy" level after a powerful breakout can offer patient investors opportunities to accumulate a high-ranked leader's shares within the guidelines of the investment system. But in this case, heavy distribution and a potentially diluting stock offering are two very good reasons to be cautious for the near term. If it forms a new orderly base in the weeks ahead, then another ideal entry point may present itself."
LFT was first featured at $22.19 on Thursday, April 02, 2009 in the CANSLIM.net Mid Day Breakouts Report (read here). Return on Equity of +24% is above the +17% guideline. It has reported strong annual and quarterly earnings increases (good concerning the C & A criteria) backed by strong sales revenues increases.
|
|
|
Color Codes Explained :
Y - Better candidates highlighted by our
staff of experts.
G - Previously featured
in past reports as yellow but may no longer be buyable under the
guidelines.
***Last / Change / Volume quote data in this table corresponds with the timestamp on the note***
Symbol/Exchange
Company Name
Industry Group |
Last |
Chg. |
Vol
% DAV |
Date Featured |
Price Featured |
Latest Pivot Point
Featured |
Status |
| Latest Max Buy Price |
GMCR
- NASDAQ
Green Mtn Coffee Roastrs
FOOD & BEVERAGE - Processed & Packaged Goods
|
$89.77
|
N/A
|
N/A
N/A
|
1/1/2008
(Date
Featured) |
$40.70
(Price
Featured) |
PP = $42.99 |
G |
| MB = $45.14 |
Most Recent Note - 6/4/2009 6:04:01 PM
G - Rallied to a new 52-week high today with a considerable gain backed by heavy volume. Wedging higher in recent weeks after a 4/30/09 "breakaway gap" when it partnered with Wal-Mart Stores. Traded up as much as +132.79% since featured at $39.09 in the January 2009 CANSLIM.net News (read here).
>>> The latest Featured Stock Update with an annotated graph appeared on 5/26/2009. click here.
|
|
C
A
S
I |
News |
Chart |
SEC
View all notes Alert
me of new notes
Company
Profile
|
HMSY
- NASDAQ
H M S Holdings Corp
COMPUTER SOFTWARE & SERVICES - Healthcare Information Service
|
$36.91
|
N/A
|
N/A
N/A
|
2/20/2009
(Date
Featured) |
$34.08
(Price
Featured) |
PP = $36.55 |
Y |
| MB = $38.38 |
Most Recent Note - 6/4/2009 6:10:43 PM
Y - Closed in the lower half of its intra-day range today, negatively reversing after gapping up. No overhead supply is there to act as resistance for this Commercial Services - Healthcare firm. The group's Relative Strength rank has slipped from A in March to a D+ now, which is a concern. Investors' odds are usually better when chosing leaders within a leading industry group.
>>> The latest Featured Stock Update with an annotated graph appeared on 5/28/2009. click here.
|
|
C
A
S
I |
News |
Chart |
SEC
View all notes Alert
me of new notes
Company
Profile
|
ILMN
- NASDAQ
Illumina Inc
DRUGS - Biotechnology
|
$38.84
|
N/A
|
N/A
N/A
|
5/3/2009
(Date
Featured) |
$38.14
(Price
Featured) |
PP = $39.05 |
Y |
| MB = $41.00 |
Most Recent Note - 6/4/2009 6:11:31 PM
Y - Today was its 6th consecutive small gain on near average volume, rising toward its pivot point. Recently found support near its 50 DMA line. Consolidating in a very tight trading range for nearly 3 months. This high-ranked stock has yet to produce confirming gains above its pivot point to trigger a proper technical buy signal. Recently featured in the May 2009 issue of CANSLIM.net News (read here).
>>> The latest Featured Stock Update with an annotated graph appeared on 5/29/2009. click here.
|
|
C
A
S
I |
News |
Chart |
SEC
View all notes Alert
me of new notes
Company
Profile
|
LFT
-
|
$27.12
|
N/A
|
N/A
N/A
|
4/2/2009
(Date
Featured) |
$22.19
(Price
Featured) |
PP = $21.81 |
G |
| MB = $22.90 |
Most Recent Note - 6/4/2009 6:15:25 PM
G - Ended near its session high after a positive reversal, stubbornly holding its ground within close striking distance of its 52-week high. Its 5/28/09 gap up and considerable gain followed another strong quarterly financial report. Prompt repair of its recent 50 DMA line violation, and its gap up, were noted as signs of solid institutional (the I criteria) support and buying demand. This Chinese Computer Software firm recently filed a registration of approximately 16 million shares for resale, and it also revealed a planned acquisition of another Chinese service provider.
>>> The latest Featured Stock Update with an annotated graph appeared on 6/4/2009. click here.
|
|
C
A
S
I |
News |
Chart |
SEC
View all notes Alert
me of new notes
Company
Profile
|
NTES
- NASDAQ
Netease Inc Adr
INTERNET - Internet Information Providers
|
$37.32
|
N/A
|
N/A
N/A
|
5/21/2009
(Date
Featured) |
$31.19
(Price
Featured) |
PP = $32.75 |
G |
| MB = $34.39 |
Most Recent Note - 6/4/2009 7:01:15 PM
G - Today's new high close, well above its "max buy" level, was its 6th consecutive gain. Color code was changed to green as it is now extended from a sound base. Its 5/28/09 gap up and considerable gain with +79% above average volume confirmed a technical buy signal as it rose above its pivot point. Indications of institutional (the I criteria) buying demand have been noted after earnings news on 5/20/09 a shakeout tested support near its 50 DMA line. First featured at $26.75 in the 3/31/09 CANSLIM.net Mid-Day Breakouts Report (read here). This high-ranked Chinese Internet - Content firm was also summarized in greater detail including an annotated graph in the April 2009 issue of CANSLIM.net News (read here).
>>> The latest Featured Stock Update with an annotated graph appeared on 5/22/2009. click here.
|
|
C
A
S
I |
News |
Chart |
SEC
View all notes Alert
me of new notes
Company
Profile
|
NVEC
- NASDAQ
N V E Corp
ELECTRONICS - Semiconductor - Specialized
|
$42.93
|
N/A
|
N/A
N/A
|
3/13/2009
(Date
Featured) |
$33.85
(Price
Featured) |
PP = $39.01 |
G |
| MB = $40.96 |
Most Recent Note - 6/4/2009 7:02:18 PM
G - Gain today on lighter than average volume for a new high close. It recently found support at its 50 DMA line. Earnings per share rose +38% over the year ago period, yet sales were up just +14% and still rather minuscule.
>>> The latest Featured Stock Update with an annotated graph appeared on 5/27/2009. click here.
|
|
C
A
S
I |
News |
Chart |
SEC
View all notes Alert
me of new notes
Company
Profile
|
SNDA
-
|
$63.36
|
N/A
|
N/A
N/A
|
5/31/2009
(Date
Featured) |
$57.62
(Price
Featured) |
PP = $53.95 |
G |
| MB = $56.65 |
Most Recent Note - 6/4/2009 7:04:14 PM
G - New high close today, posting a 7th consecutive gain. It is extended from a sound base. Patient investors may watch for a pullback near its 50 DMA line, an important support level which has not been tested since breaking out in March. Just featured in the June 2009 issue of CANSLIM.net News. Be sure to review the "What to Look Out For" section and entire detailed summary - read here).
>>> The latest Featured Stock Update with an annotated graph appeared on 6/3/2009. click here.
|
|
C
A
S
I |
News |
Chart |
SEC
View all notes Alert
me of new notes
Company
Profile
|
SYNA
- NASDAQ
Synaptics Inc
COMPUTER SOFTWARE & SERVICES - Information Technology Service
|
$37.57
|
N/A
|
N/A
N/A
|
5/18/2009
(Date
Featured) |
$32.58
(Price
Featured) |
PP = $34.52 |
G |
| MB = $36.25 |
Most Recent Note - 6/4/2009 7:06:10 PM
G - Gapped up and posted a solid gain today on slightly above average volume for a new 52-week high. Its 6/01/09 gap up gain was backed by +62% above average volume, and now there is no overhead supply to hinder its progress. Color code was changed to green after it distanced itself from its prior chart highs. First featured in yellow in the May 18, 2009 mid-day report (read here). The number of top-rated funds owning its shares rose from 123 in June '08 to 185 in March '09, which is good news concerning the I criteria. Strong earnings and sales revenues growth in the 4 latest quarterly comparisons satisfies the C criteria. Its annual earnings (the A criteria) history showed a dowturn in 2006, leaving concerns, but it followed that up with strong growth the next 2 years.
>>> The latest Featured Stock Update with an annotated graph appeared on 6/1/2009. click here.
|
|
C
A
S
I |
News |
Chart |
SEC
View all notes Alert
me of new notes
Company
Profile
|
TNDM
- NASDAQ
Tandem Diabetes Care Inc
TELECOMMUNICATIONS - Wireless Communications
|
$30.89
|
N/A
|
N/A
N/A
|
3/2/2009
(Date
Featured) |
$18.89
(Price
Featured) |
PP = $29.85 |
Y |
| MB = $31.34 |
Most Recent Note - 6/4/2009 7:07:27 PM
Y - Consolidating above prior chart highs in the $30 area that are now an important support level to watch. Color code was changed to yellow as it quietly retreated under its "max buy" level. It found support near its 50 DMA line, and its impressive "positive reversal" on 5/14/09 was noted as a sign of institutional support. Gapped up on 4/30/09 for a new all-time high after reporting solid quarterly sales and earnings increases. Traded up as much as +72.42% since first featured at $18.89 in the 3/02/09 Mid-Day BreakOuts Report (read here).
>>> The latest Featured Stock Update with an annotated graph appeared on 6/2/2009. click here.
|
|
C
A
S
I |
News |
Chart |
SEC
View all notes Alert
me of new notes
Company
Profile
|
|
|
|
THESE ARE NOT BUY RECOMMENDATIONS!
Comments contained in the body of this report are technical
opinions only. The material herein has been obtained
from sources believed to be reliable and accurate, however,
its accuracy and completeness cannot be guaranteed.
This site is not an investment advisor, hence it does
not endorse or recommend any securities or other investments.
Any recommendation contained in this report may not
be suitable for all investors and it is not to be deemed
an offer or solicitation on our part with respect to
the purchase or sale of any securities. All trademarks,
service marks and trade names appearing in this report
are the property of their respective owners, and are
likewise used for identification purposes only.
This report is a service available
only to active Paid Premium Members.
You may opt-out of receiving report notifications
at any time. Questions or comments may be submitted
by writing to Premium Membership Services 665 S.E. 10 Street, Suite 201 Deerfield Beach, FL 33441-5634 or by calling 1-800-965-8307
or 954-785-1121.
|
|
|


