You are not logged in.
This means you
CAN ONLY VIEW reports that were published prior to Monday, April 14, 2025.
You
MUST UPGRADE YOUR MEMBERSHIP if you want to see any current reports.
AFTER MARKET UPDATE - WEDNESDAY, JUNE 3RD, 2009
Previous After Market Report Next After Market Report >>>
|
|
|
|
DOW |
-65.63 |
8,675.24 |
-0.75% |
|
Volume |
1,326,475,690 |
-6% |
|
Volume |
2,311,550,250 |
-7% |
|
NASDAQ |
-10.88 |
1,825.92 |
-0.59% |
|
Advancers |
837 |
27% |
|
Advancers |
1,064 |
37% |
|
S&P 500 |
-12.98 |
931.76 |
-1.37% |
|
Decliners |
2,177 |
70% |
|
Decliners |
1,634 |
57% |
|
Russell 2000 |
-3.92 |
522.71 |
-0.74% |
|
52 Wk Highs |
12 |
|
|
52 Wk Highs |
26 |
|
|
S&P 600 |
-2.63 |
276.05 |
-0.94% |
|
52 Wk Lows |
2 |
|
|
52 Wk Lows |
7 |
|
|
 |
Major Averages Pull Back On Lighter Volume
Adam Sarhan, Contributing Writer,
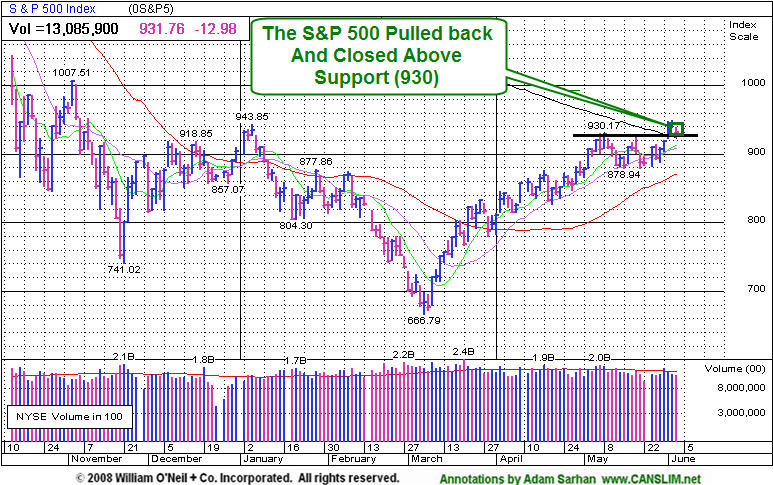
The major averages snapped a four day winning streak, impacted by sour economic news and a stronger US dollar. Decliners trumped advancers by nearly a 3-to-1 ratio on the NYSE and by a 8-to-5 ratio on the Nasdaq exchange. It was encouraging to see volume contract compared to the prior session on both major exchanges as the market pulled back. Ideally, one would like to see volume expand when the market rallies and contract when it pulls back. There were 11 high-ranked companies from the CANSLIM.net Leaders List that made a new 52-week high and appeared on the CANSLIM.net BreakOuts Page, lower than the 26 issues that appeared on the prior session. The greater expansion recently occurring in the new highs list has offered encouraging news for growth oriented investors.
Before Wednesdays opening bell, the country's largest employer ADP said employers slashed -532,000 jobs in May. On Friday, the Labor Department is slated to release its monthly payrolls report which may show that employers cut -520,000 jobs in May. Many analysts believe that the report will show that the unemployment rate will surge to a 25 year high of 9.2%. In other economic news, the Institute for Supply Management’s (ISM) index of service industries was 44 which missed the Street's forecast. The latest studies show that the service industry presently makes up over +80% of the economy.
Federal Reserve Chairman Ben S. Bernanke testified in Washington today and told lawmakers that large US budget deficits threaten financial stability. He also said that the government can not continue to borrow indefinitely to finance the recovery efforts. Bernanke said, “Unless we demonstrate a strong commitment to fiscal sustainability in the longer term, we will have neither financial stability nor healthy economic growth... Maintaining the confidence of the financial markets requires that we, as a nation, begin planning now for the restoration of fiscal balance.” These comments clearly show that the government is aware of its radical spending habits.
A slew of commodities got smacked on Wednesday as the US dollar advanced. It is important to remember that the US dollar and commodities are inversely related, meaning commodity prices fall when the dollar rallies. The inverse is also true, such that commodity prices rise when the dollar falls. This relationship is important because the US dollar rallied smartly during the latter half of 2008 while commodities plunged. Meanwhile, the greenback has spent the past few months in a virtual free fall which has helped lift a slew of commodities. Interestingly, the inverse relationship between the dollar and stocks also exists. The major averages have surged since the March near term low while the dollar has virtually imploded.
PICTURED: The S&P 500 Index pulled back and closed near support (930) at recent chart highs.
|
|
|
 |
Biotech Group A Standout Gainer On Mostly Negative Session
Kenneth J. Gruneisen - Passed the CAN SLIM® Master's Exam
A stronger US dollar put pressure on commodity prices and contributed to losses for the Gold & Silver ($XAU -5.38%), Oil Services ($OSX -4.82%), and Integrated Oil ($XOI -4.22%) indexes. Most other groups were also on the retreat after their recent gains. The Broker/Dealer ($XBD -1.56%), Bank ($BKX -1.47%), and Retail ($RLX -1.33%) indexes traded with a slightly negative bias and also weighed on the major averages. The tech sector suffered modest losses as the Semiconductor Index ($SOX -2.21%) outpaced the Networking ($NWX -1.32%) and Internet ($IIX -0.99%) indexes to the downside. The Healthcare ($HMO -1.43%) group also slid.
Charts courtesy www.stockcharts.com
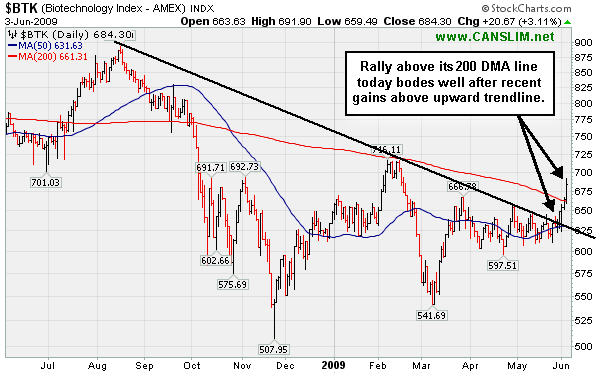
PICTURED: The Biotechnology Index ($BTK +3.17%) recently cleared a downward trendline connecting its August '08 and February-May '09 chart highs. It was a standout gainer today as it rallied above its 200-day moving average (DMA) line. Human Genome Sciences, Inc. (HGSI +15.21%) was among the biotech group leaders. However, its earnings history has been poor, so it would not be appropriate choice under the investment system's guidelines.
| Oil Services |
$OSX |
175.10 |
+0.00 |
+0.00% |
+44.25% |
| Healthcare |
$HMO |
1,109.59 |
-16.07 |
-1.43% |
+15.56% |
| Integrated Oil |
$XOI |
969.23 |
-42.72 |
-4.22% |
-1.07% |
| Semiconductor |
$SOX |
270.18 |
+0.00 |
+0.00% |
+27.34% |
| Networking |
$NWX |
189.72 |
-2.53 |
-1.32% |
+31.85% |
| Internet |
$IIX |
190.74 |
-1.91 |
-0.99% |
+42.59% |
| Broker/Dealer |
$XBD |
99.37 |
-1.57 |
-1.56% |
+28.27% |
| Retail |
$RLX |
339.10 |
-4.57 |
-1.33% |
+21.43% |
| Gold & Silver |
$XAU |
152.51 |
+0.00 |
+0.00% |
+23.14% |
| Bank |
$BKX |
36.14 |
-0.54 |
-1.47% |
-18.46% |
|
|
|
 |
New Highs Hit After Reporting Solid Quarterly Increases
Kenneth J. Gruneisen - Passed the CAN SLIM® Master's Exam
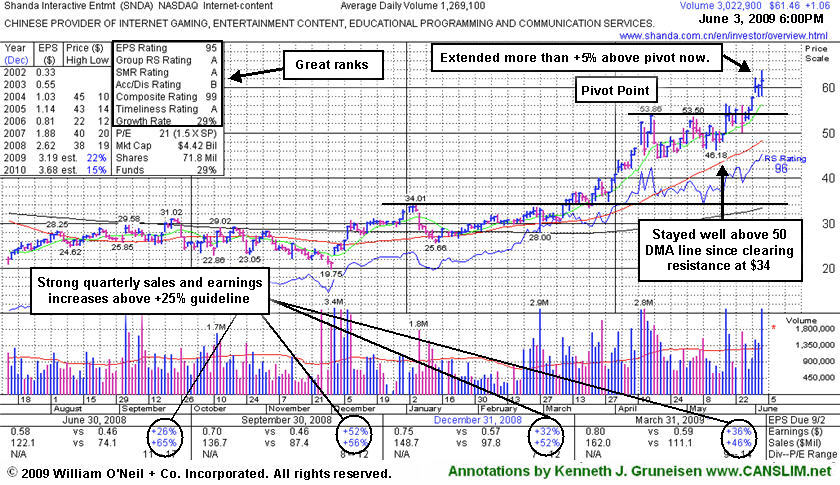
Shanda Interactive Ent Ltd (SNDA $+1.06 or +1.75% to $60.99) hit a new all-time high today and then closed in the middle of its intra-day trading range following the release of solid earnings and sales news for the latest quarter. It is extended from a sound base now. Disciplined investors avoid chasing any stock more than +5% above its pivot point. Patient investors may watch for a pullback near its 50-day moving average (DMA) line, an important support level which has not been tested since breaking out above resistance at $34.00 back in March. Just featured in the June 2009 issue of CANSLIM.net News. Be sure to review the "What to Look Out For" section and entire detailed summary - read here).
C A N S L I M | StockTalk | News | Chart | SEC | Zacks Reports |   
View all notes | Alert me of new notes | CANSLIM.net Company Profile
|
|
|
Color Codes Explained :
Y - Better candidates highlighted by our
staff of experts.
G - Previously featured
in past reports as yellow but may no longer be buyable under the
guidelines.
***Last / Change / Volume quote data in this table corresponds with the timestamp on the note***
Symbol/Exchange
Company Name
Industry Group |
Last |
Chg. |
Vol
% DAV |
Date Featured |
Price Featured |
Latest Pivot Point
Featured |
Status |
| Latest Max Buy Price |
GMCR
- NASDAQ
Green Mtn Coffee Roastrs
FOOD & BEVERAGE - Processed & Packaged Goods
|
$84.29
|
N/A
|
N/A
N/A
|
1/1/2008
(Date
Featured) |
$40.70
(Price
Featured) |
PP = $42.99 |
G |
| MB = $45.14 |
Most Recent Note - 6/3/2009 4:07:08 PM
G - Stubbornly holding its recent gains while wedging higher in recent weeks. Its 4/30/09 "breakaway gap" followed another strong quarterly financial report and news of a partnership with Wal-Mart Stores. Traded up as much as +123.59% since featured at $39.09 in the January 2009 CANSLIM.net News (read here).
>>> The latest Featured Stock Update with an annotated graph appeared on 5/26/2009. click here.
|
|
C
A
S
I |
News |
Chart |
SEC
View all notes Alert
me of new notes
Company
Profile
|
HMSY
- NASDAQ
H M S Holdings Corp
COMPUTER SOFTWARE & SERVICES - Healthcare Information Service
|
$37.01
|
N/A
|
N/A
N/A
|
2/20/2009
(Date
Featured) |
$34.08
(Price
Featured) |
PP = $36.55 |
Y |
| MB = $38.38 |
Most Recent Note - 6/3/2009 4:10:34 PM
Y - Quietly held its ground today, closing down a penny from its highest close ever. Volume totals dried up in recent weeks while it formed a downward sloping high handle. No overhead supply is there to act as resistance for this Commercial Services - Healthcare firm. However, the group's Relative Strength rank has slipped from A in March to a D+ now, which is a concern. Investors' odds are usually better when chosing leaders within a leading industry group.
>>> The latest Featured Stock Update with an annotated graph appeared on 5/28/2009. click here.
|
|
C
A
S
I |
News |
Chart |
SEC
View all notes Alert
me of new notes
Company
Profile
|
ILMN
- NASDAQ
Illumina Inc
DRUGS - Biotechnology
|
$38.75
|
N/A
|
N/A
N/A
|
5/3/2009
(Date
Featured) |
$38.14
(Price
Featured) |
PP = $39.05 |
Y |
| MB = $41.00 |
Most Recent Note - 6/3/2009 4:13:06 PM
Y - Today was its 5th consecutive gain on near average volume, rising toward its pivot point. Recently found support near its 50 DMA line. Consolidating in a very tight trading range for nearly 3 months. This high-ranked stock has yet to produce confirming gains above its pivot point to trigger a proper technical buy signal. Recently featured in the May 2009 issue of CANSLIM.net News (read here).
>>> The latest Featured Stock Update with an annotated graph appeared on 5/29/2009. click here.
|
|
C
A
S
I |
News |
Chart |
SEC
View all notes Alert
me of new notes
Company
Profile
|
LFT
-
|
$27.00
|
N/A
|
N/A
N/A
|
4/2/2009
(Date
Featured) |
$22.19
(Price
Featured) |
PP = $21.81 |
G |
| MB = $22.90 |
Most Recent Note - 6/3/2009 4:15:33 PM
G - Stubbornly holding its ground -6% off its 52-week high. Its 5/28/09 gap up and considerable gain followed another strong quarterly financial report. Prompt repair of its recent 50 DMA line violation, and its gap up, were noted as signs of solid institutional (the I criteria) support and buying demand. This Chinese Computer Software firm recently filed a registration of approximately 16 million shares for resale, and it also revealed a planned acquisition of another Chinese service provider.
>>> The latest Featured Stock Update with an annotated graph appeared on 5/21/2009. click here.
|
|
C
A
S
I |
News |
Chart |
SEC
View all notes Alert
me of new notes
Company
Profile
|
NTES
- NASDAQ
Netease Inc Adr
INTERNET - Internet Information Providers
|
$36.28
|
N/A
|
N/A
N/A
|
5/21/2009
(Date
Featured) |
$31.19
(Price
Featured) |
PP = $32.75 |
G |
| MB = $34.39 |
Most Recent Note - 6/3/2009 4:20:00 PM
G - Gain on average volume today for a new high close further above its "max buy" level. Color code was changed to green as it is now extended from a sound base. Its 5/28/09 gap up and considerable gain with +79% above average volume confirmed a technical buy signal as it rose above its pivot point. Indications of institutional (the I criteria) buying demand have been noted after earnings news on 5/20/09 a shakeout tested support near its 50 DMA line. First featured at $26.75 in the 3/31/09 CANSLIM.net Mid-Day Breakouts Report (read here). This high-ranked Chinese Internet - Content firm was also summarized in greater detail including an annotated graph in the April 2009 issue of CANSLIM.net News (read here).
>>> The latest Featured Stock Update with an annotated graph appeared on 5/22/2009. click here.
|
|
C
A
S
I |
News |
Chart |
SEC
View all notes Alert
me of new notes
Company
Profile
|
NVEC
- NASDAQ
N V E Corp
ELECTRONICS - Semiconductor - Specialized
|
$41.42
|
N/A
|
N/A
N/A
|
3/13/2009
(Date
Featured) |
$33.85
(Price
Featured) |
PP = $39.01 |
G |
| MB = $40.96 |
Most Recent Note - 6/3/2009 4:22:05 PM
G - Small loss today on lighter than average volume, ending -4% off its 52-week high. It recently found support at its 50 DMA line. Earnings per share rose +38% over the year ago period, yet sales were up just +14% and still rather minuscule.
>>> The latest Featured Stock Update with an annotated graph appeared on 5/27/2009. click here.
|
|
C
A
S
I |
News |
Chart |
SEC
View all notes Alert
me of new notes
Company
Profile
|
SNDA
-
|
$61.46
|
N/A
|
N/A
N/A
|
5/31/2009
(Date
Featured) |
$57.62
(Price
Featured) |
PP = $53.95 |
G |
| MB = $56.65 |
Most Recent Note - 6/3/2009 4:45:53 PM
G - Ended in the middle of its intra-day range today after hitting a new all-time high following solid results for the latest quarter. It is extended from a sound base. Patient investors may watch for a pullback near its 50 DMA line, an important support level which has not been tested since breaking out in March. Just featured in the June 2009 issue of CANSLIM.net News. Be sure to review the "What to Look Out For" section and entire detailed summary - read here).
>>> The latest Featured Stock Update with an annotated graph appeared on 6/3/2009. click here.
|
|
C
A
S
I |
News |
Chart |
SEC
View all notes Alert
me of new notes
Company
Profile
|
SYNA
- NASDAQ
Synaptics Inc
COMPUTER SOFTWARE & SERVICES - Information Technology Service
|
$35.51
|
N/A
|
N/A
N/A
|
5/18/2009
(Date
Featured) |
$32.58
(Price
Featured) |
PP = $34.52 |
G |
| MB = $36.25 |
Most Recent Note - 6/3/2009 4:49:24 PM
G - Small gap down and loss today on light volume. Its 6/01/09 gap up gain was backed by +62% above average volume, and now there is no overhead supply to hinder its progress. Color code was changed to green after it distanced itself from its prior chart highs. First featured in yellow in the May 18, 2009 mid-day report (read here). The number of top-rated funds owning its shares rose from 123 in June '08 to 185 in March '09, which is good news concerning the I criteria. Strong earnings and sales revenues growth in the 4 latest quarterly comparisons satisfies the C criteria. Its annual earnings (the A criteria) history showed a dowturn in 2006, leaving concerns, but it followed that up with strong growth the next 2 years.
>>> The latest Featured Stock Update with an annotated graph appeared on 6/1/2009. click here.
|
|
C
A
S
I |
News |
Chart |
SEC
View all notes Alert
me of new notes
Company
Profile
|
TNDM
- NASDAQ
Tandem Diabetes Care Inc
TELECOMMUNICATIONS - Wireless Communications
|
$30.32
|
N/A
|
N/A
N/A
|
3/2/2009
(Date
Featured) |
$18.89
(Price
Featured) |
PP = $29.85 |
Y |
| MB = $31.34 |
Most Recent Note - 6/3/2009 6:32:57 PM
Y - Down today on lighter volume, consolidating toward prior chart highs that are now an important support level to watch. Color code is changed to yellow as it has quietly retreated under its "max buy" level. It found support near its 50 DMA line, and its impressive "positive reversal" on 5/14/09 was noted as a sign of institutional support. Gapped up on 4/30/09 for a new all-time high after reporting solid quarterly sales and earnings increases. Traded up as much as +72.42% since first featured at $18.89 in the 3/02/09 Mid-Day BreakOuts Report (read here).
>>> The latest Featured Stock Update with an annotated graph appeared on 6/2/2009. click here.
|
|
C
A
S
I |
News |
Chart |
SEC
View all notes Alert
me of new notes
Company
Profile
|
|
|
|
THESE ARE NOT BUY RECOMMENDATIONS!
Comments contained in the body of this report are technical
opinions only. The material herein has been obtained
from sources believed to be reliable and accurate, however,
its accuracy and completeness cannot be guaranteed.
This site is not an investment advisor, hence it does
not endorse or recommend any securities or other investments.
Any recommendation contained in this report may not
be suitable for all investors and it is not to be deemed
an offer or solicitation on our part with respect to
the purchase or sale of any securities. All trademarks,
service marks and trade names appearing in this report
are the property of their respective owners, and are
likewise used for identification purposes only.
This report is a service available
only to active Paid Premium Members.
You may opt-out of receiving report notifications
at any time. Questions or comments may be submitted
by writing to Premium Membership Services 665 S.E. 10 Street, Suite 201 Deerfield Beach, FL 33441-5634 or by calling 1-800-965-8307
or 954-785-1121.
|
|
|


