You are not logged in.
This means you
CAN ONLY VIEW reports that were published prior to Monday, March 10, 2025.
You
MUST UPGRADE YOUR MEMBERSHIP if you want to see any current reports.
AFTER MARKET UPDATE - TUESDAY, JUNE 2ND, 2009
Previous After Market Report Next After Market Report >>>
|
|
|
|
DOW |
+19.43 |
8,740.87 |
+0.22% |
|
Volume |
1,405,827,550 |
-6% |
|
Volume |
2,473,166,350 |
-7% |
|
NASDAQ |
+8.12 |
1,836.80 |
+0.44% |
|
Advancers |
1,811 |
58% |
|
Advancers |
1,543 |
54% |
|
S&P 500 |
+1.87 |
944.74 |
+0.20% |
|
Decliners |
1,238 |
40% |
|
Decliners |
1,173 |
41% |
|
Russell 2000 |
+5.30 |
526.63 |
+1.02% |
|
52 Wk Highs |
21 |
|
|
52 Wk Highs |
51 |
|
|
S&P 600 |
+2.82 |
278.68 |
+1.02% |
|
52 Wk Lows |
3 |
|
|
52 Wk Lows |
4 |
|
|
 |
Major Averages Post Fourth Consecutive Gains
Adam Sarhan, Contributing Writer,
The major averages rallied for the fourth straight day on signs that the ailing housing market continues to improve. Advancers led decliners by a 3-to-2 ratio on the NYSE and by a 5-to-4 ratio on the Nasdaq exchange. Volume was reported lower than the prior session on both major exchanges. There were 26 high-ranked companies from the CANSLIM.net Leaders List that made a new 52-week high and appeared on the CANSLIM.net BreakOuts Page, lower than the 28 issues that appeared on the prior session. The greater expansion recently occurring in the new highs list has offered encouraging news for growth oriented investors.
The latest data from the ailing housing market helped send stocks higher on Tuesday. Home resales, rose at the fastest pace in seven years which was the latest in a series of stronger-than-expected data from the housing market. Medical stocks rallied after President Barack Obama urged Congress to pass his health-care reform program. The plan is still a work in progress but will be a combination of a private/public funds. The thesis is that the net result for medical companies will be more revenue which should translate into higher profits.
News spread that Ford (F +4.57%) and General Motors (delisted) auto sales were stronger than expected last month. GM also announced that it found a buyer for its Hummer brand. At first the company tried to keep the deal a secret, but around mid-day the NY Times reported that a Chinese company was the buyer, which presents the scenario that the US military will be making future purchases from China to satisfy the need for more Hummer brand vehicles. This is a historic time for the balance of power between the US and China. Both countries rely heavily on each other for continued growth and prosperity. The Chinese sell their low-priced goods to the US and then buy the US' debt. This dynamic has worked for decades, but many are speculating that it will not continue. We find this notion hard to believe because of basic dollars and cents. Would you snub your largest customer? No. Then why would they? As the world appears to be recovering from the economic slump, it is becoming very clear that China will be a leader on the way out. This is best evidenced by the flurry of Chinese stocks that have emerged as leaders in recent weeks.
Financial stocks ended mixed to mostly lower after several high profile financial companies issued more shares in their rush to repay borrowed TARP funds. Morgan Stanley (MS +0.67%), JPMorgan (JPM -4.46%), and American Express (AXP -4.92%) raised capital by selling more shares. The concern is that, by issuing more stock, the banks will dilute their existing shares. While these financial firms are focused on feathering their own nests and digging themselves out of some deep holes, another unfortunate consequence is the lack of funding flowing toward innovative new companies with a desire to bring forth new products and services that might enhance the quality of life of all.
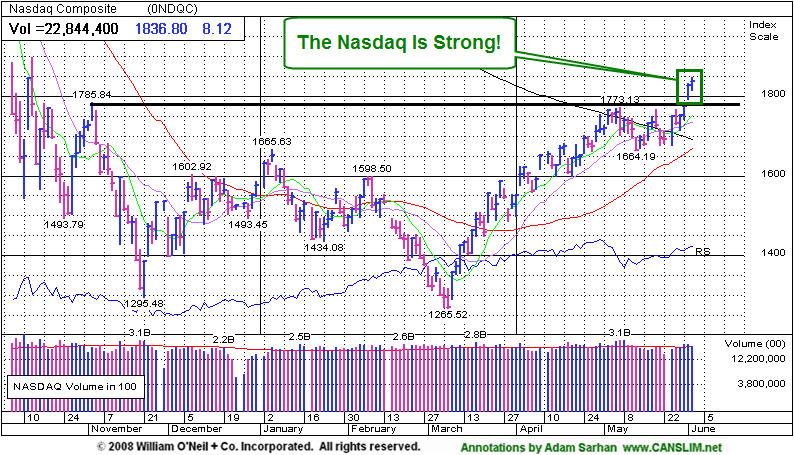
Turning our attention back to the market, the S&P 500 Index added slightly to Monday's gain that had helped it close above its 200-day moving average (DMA) line for the first time since December 2007. According to Bloomberg, this was its longest streak below its 200 DMA line since the 1930's. Looking forward, as long as the benchmark index continues trading above the 930 level (formerly resistance, now support) then the bulls remain in control. The Dow Jones Industrial Average also traded above its 200 DMA line intra-day for the first time since May 2008, but the blue chip index ended off its high and about 11 points below the mark. It is also encouraging to see a few high-ranked leaders manage to recently break out of sound bases, which offers investors a chance to capitalize on the current rally.
PICTURED: The Nadaq Composite Index has been strong. On Tuesday, it rallied further above its 200-day moving average line and above prior chart highs.
|
|
|
 |
Retail Index Climbs to New 2009 High Close
Kenneth J. Gruneisen - Passed the CAN SLIM® Master's Exam
The Retail Index ($RLX +1.53%) posted a gain and helped offset losses in other areas that weighed on the major averages. The Gold & Silver Index ($XAU +2.15%) was a standout gainer, and the Healthcare ($HMO +0.92%) group and Biotechnology Index ($BTK +1.47%) also were a positive influence. Meanwhile, technology, financial, and energy related shares backpedaled on Tuesday. The Semiconductor Index ($SOX -2.44%) created the biggest drag on the tech sector, and the Networking Index ($NWX -0.94%) suffered a smaller loss while the Internet Index ($IIX -0.02%) ended the session virtually flat. The Bank ($BKX -1.45%) and Broker/Dealer ($XBD -0.25%) indexes ended lower, and the Integrated Oil ($XOI -0.82%) and Oil Services ($OSX -0.40%) indexes also finished the session with small losses.
Charts courtesy www.stockcharts.com
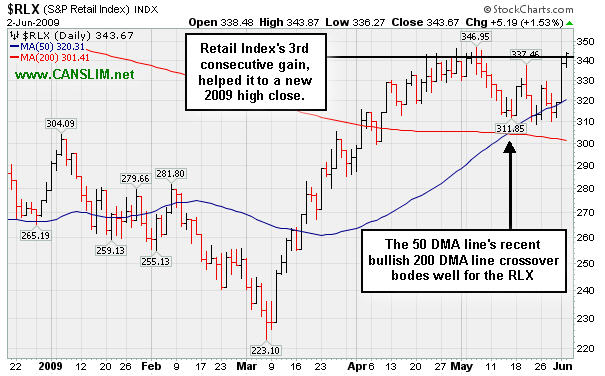
PICTURED: The Retail Index's ($RLX +1.53%) 3rd consecutive gain, helped it to a new 2009 high close. The 50-day moving average (DMA) line's recent bullish 200 DMA line crossover generally bodes well for the RLX.
| Oil Services |
$OSX |
183.96 |
-0.73 |
-0.40% |
+51.54% |
| Healthcare |
$HMO |
1,125.66 |
+10.24 |
+0.92% |
+17.23% |
| Integrated Oil |
$XOI |
1,011.95 |
-8.32 |
-0.82% |
+3.29% |
| Semiconductor |
$SOX |
276.29 |
-6.90 |
-2.44% |
+30.22% |
| Networking |
$NWX |
192.25 |
-1.82 |
-0.94% |
+33.61% |
| Internet |
$IIX |
192.65 |
-0.04 |
-0.02% |
+44.02% |
| Broker/Dealer |
$XBD |
100.94 |
-0.25 |
-0.25% |
+30.30% |
| Retail |
$RLX |
343.67 |
+5.19 |
+1.53% |
+23.06% |
| Gold & Silver |
$XAU |
161.18 |
+3.40 |
+2.15% |
+30.14% |
| Bank |
$BKX |
36.68 |
-0.54 |
-1.45% |
-17.24% |
|
|
|
 |
Window Of Opportunity Closes on Secondary Buy Point
Kenneth J. Gruneisen - Passed the CAN SLIM® Master's Exam
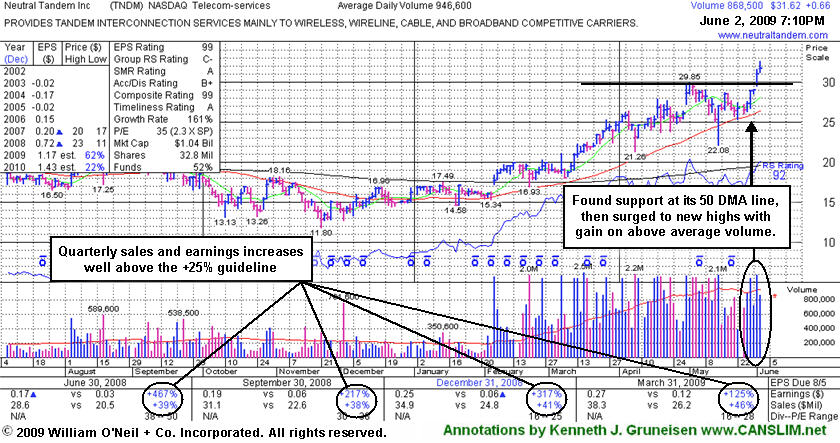
Neutral Tandem Inc (TNDM +$0.66 or +2.13% to $31.62) gapped up again today for a gain on lighter volume to another new all-time high. Its color code has been changed to green after its close above its "max buy" level. It recently found prompt support near its 50-day moving average (DMA) line, and its impressive "positive reversal" on 5/14/09 was noted as a sign of institutional support. It gapped up on 4/30/09 for a new all-time high after reporting solid quarterly sales and earnings increases. It has traded up as much as +72.42% since first featured at $18.89 with a $21.08 pivot point in the 3/02/09 Mid-Day BreakOuts Report (read here).
TNDM's latest pivot point of $29.85 was based upon the stock's May 1st high. For investors who miss a proper buy point whenever any high-ranked stock breaks out from a first stage base, the stock's first pullback to the its 50 DMA line (or its 10-week average when viewing a weekly chart) may offer a them an ideal secondary buy point. Odds of success taper off upon each subsequent test of support at that important short-term average line. The discipline of the investment system that applies still requires for investors to avoid "chasing" and buying any stock more than +5% above its prior chart high or pivot point. As always, investors should sell to limit losses if ever any stock falls more than -7% from their buy price.
C A N S L I M | StockTalk | News | Chart | SEC | Zacks Reports |   
View all notes | Alert me of new notes | CANSLIM.net Company Profile |
|
|
Color Codes Explained :
Y - Better candidates highlighted by our
staff of experts.
G - Previously featured
in past reports as yellow but may no longer be buyable under the
guidelines.
***Last / Change / Volume quote data in this table corresponds with the timestamp on the note***
Symbol/Exchange
Company Name
Industry Group |
Last |
Chg. |
Vol
% DAV |
Date Featured |
Price Featured |
Latest Pivot Point
Featured |
Status |
| Latest Max Buy Price |
GMCR
- NASDAQ
Green Mtn Coffee Roastrs
FOOD & BEVERAGE - Processed & Packaged Goods
|
$85.22
|
N/A
|
N/A
N/A
|
1/1/2008
(Date
Featured) |
$40.70
(Price
Featured) |
PP = $42.99 |
G |
| MB = $45.14 |
Most Recent Note - 6/2/2009 6:46:14 PM
G - Gain on light volume today for a new high close. Wedging higher in recent weeks following its 4/30/09 "breakaway gap" after it reported a strong quarterly financial report and news of a partnership with Wal-Mart Stores. Traded up as much as +123.59% since featured at $39.09 in the January 2009 CANSLIM.net News (read here).
>>> The latest Featured Stock Update with an annotated graph appeared on 5/26/2009. click here.
|
|
C
A
S
I |
News |
Chart |
SEC
View all notes Alert
me of new notes
Company
Profile
|
HMSY
- NASDAQ
H M S Holdings Corp
COMPUTER SOFTWARE & SERVICES - Healthcare Information Service
|
$37.16
|
N/A
|
N/A
N/A
|
2/20/2009
(Date
Featured) |
$34.08
(Price
Featured) |
PP = $36.55 |
Y |
| MB = $38.38 |
Most Recent Note - 6/2/2009 6:48:17 PM
Y - Gain today on average volume for a new highest close ever. Volume totals dried up in recent weeks while it formed a downward sloping high handle. No overhead supply is there to act as resistance for this Commercial Services - Healthcare firm. However, the group's Relative Strength rank has slipped from A in March to a D now, which is a concern. Investors' odds are usually better when chosing leaders within a leading industry group.
>>> The latest Featured Stock Update with an annotated graph appeared on 5/28/2009. click here.
|
|
C
A
S
I |
News |
Chart |
SEC
View all notes Alert
me of new notes
Company
Profile
|
ILMN
- NASDAQ
Illumina Inc
DRUGS - Biotechnology
|
$38.05
|
N/A
|
N/A
N/A
|
5/3/2009
(Date
Featured) |
$38.14
(Price
Featured) |
PP = $39.05 |
Y |
| MB = $41.00 |
Most Recent Note - 6/2/2009 6:49:55 PM
Y - Inched higher on near average volume today after a small gap up on 6/01/09, rising further above its 50 DMA line. Consolidating in a very tight trading range for nearly 3 months. This high-ranked stock has yet to produce confirming gains above its pivot point to trigger a proper technical buy signal. Recently featured in the May 2009 issue of CANSLIM.net News (read here).
>>> The latest Featured Stock Update with an annotated graph appeared on 5/29/2009. click here.
|
|
C
A
S
I |
News |
Chart |
SEC
View all notes Alert
me of new notes
Company
Profile
|
LFT
-
|
$26.89
|
N/A
|
N/A
N/A
|
4/2/2009
(Date
Featured) |
$22.19
(Price
Featured) |
PP = $21.81 |
G |
| MB = $22.90 |
Most Recent Note - 6/2/2009 6:52:32 PM
G - Stubbornly holding its ground near its 52-week high since its 5/28/09 gap up and considerable gain that followed another strong quarterly financial report. Prompt repair of its recent 50 DMA line violation, and its gap up, were noted as signs of solid institutional (the I criteria) support and buying demand. This Chinese Computer Software firm recently filed a registration of approximately 16 million shares for resale, and it also revealed a planned acquisition of another Chinese service provider.
>>> The latest Featured Stock Update with an annotated graph appeared on 5/21/2009. click here.
|
|
C
A
S
I |
News |
Chart |
SEC
View all notes Alert
me of new notes
Company
Profile
|
NTES
- NASDAQ
Netease Inc Adr
INTERNET - Internet Information Providers
|
$35.82
|
N/A
|
N/A
N/A
|
5/21/2009
(Date
Featured) |
$31.19
(Price
Featured) |
PP = $32.75 |
G |
| MB = $34.39 |
Most Recent Note - 6/2/2009 7:01:13 PM
G - Quietly held its ground today after a gap up on 6/01/09 for yet another gain on above average volume, hitting new all-time highs above its "max buy" level. Color code was changed to green as it is now extended from a sound base. Its 5/28/09 gap up and considerable gain with +79% above average volume confirmed a technical buy signal as it rose above its pivot point. Indications of institutional (the I criteria) buying demand have been noted after earnings news on 5/20/09 a shakeout tested support near its 50 DMA line. First featured at $26.75 in the 3/31/09 CANSLIM.net Mid-Day Breakouts Report (read here). This high-ranked Chinese Internet - Content firm was also summarized in greater detail including an annotated graph in the April 2009 issue of CANSLIM.net News (read here).
>>> The latest Featured Stock Update with an annotated graph appeared on 5/22/2009. click here.
|
|
C
A
S
I |
News |
Chart |
SEC
View all notes Alert
me of new notes
Company
Profile
|
NVEC
- NASDAQ
N V E Corp
ELECTRONICS - Semiconductor - Specialized
|
$42.55
|
N/A
|
N/A
N/A
|
3/13/2009
(Date
Featured) |
$33.85
(Price
Featured) |
PP = $39.01 |
G |
| MB = $40.96 |
Most Recent Note - 6/2/2009 7:02:49 PM
G - Traded up today on below average volume for another new 52-week high. It recently found support at its 50 DMA line. Earnings per share rose +38% over the year ago period, yet sales were up just +14% and still rather minuscule.
>>> The latest Featured Stock Update with an annotated graph appeared on 5/27/2009. click here.
|
|
C
A
S
I |
News |
Chart |
SEC
View all notes Alert
me of new notes
Company
Profile
|
SNDA
-
|
$60.40
|
N/A
|
N/A
N/A
|
5/31/2009
(Date
Featured) |
$57.62
(Price
Featured) |
PP = $53.95 |
G |
| MB = $56.65 |
Most Recent Note - 6/2/2009 7:07:54 PM
G - Held its ground at all-time highs today after a gap up on the prior session. Recent gains with only slightly above average volume have it now extended from a sound base. Patient investors may watch for a pullback near its 50 DMA line, an important support level which has not been tested since breaking out in March. Just featured in the June 2009 issue of CANSLIM.net News. Be sure to review the "What to Look Out For" section and entire detailed summary - read here).
>>> The latest Featured Stock Update with an annotated graph appeared on 5/30/2009. click here.
|
|
C
A
S
I |
News |
Chart |
SEC
View all notes Alert
me of new notes
Company
Profile
|
SYNA
- NASDAQ
Synaptics Inc
COMPUTER SOFTWARE & SERVICES - Information Technology Service
|
$36.54
|
N/A
|
N/A
N/A
|
5/18/2009
(Date
Featured) |
$32.58
(Price
Featured) |
PP = $34.52 |
G |
| MB = $36.25 |
Most Recent Note - 6/2/2009 7:09:09 PM
G - Held its ground following a confirming 6/01/09 gap up gain with +62% above average volume. No overhead supply remains to hinder its progress. Color code was changed to green after it distanced itself from its prior chart highs. First featured in yellow in the May 18, 2009 mid-day report (read here). The number of top-rated funds owning its shares rose from 123 in June '08 to 185 in March '09, which is good news concerning the I criteria. Strong earnings and sales revenues growth in the 4 latest quarterly comparisons satisfies the C criteria. Its annual earnings (the A criteria) history showed a dowturn in 2006, leaving concerns, but it followed that up with strong growth the next 2 years.
>>> The latest Featured Stock Update with an annotated graph appeared on 6/1/2009. click here.
|
|
C
A
S
I |
News |
Chart |
SEC
View all notes Alert
me of new notes
Company
Profile
|
TNDM
- NASDAQ
Tandem Diabetes Care Inc
TELECOMMUNICATIONS - Wireless Communications
|
$31.62
|
N/A
|
N/A
N/A
|
3/2/2009
(Date
Featured) |
$18.89
(Price
Featured) |
PP = $29.85 |
G |
| MB = $31.34 |
Most Recent Note - 6/2/2009 7:12:43 PM
G - Gapped up again today for a small gain on lighter volume to another new all-time high. Color code is changed to green after its close above its "max buy" level. Found support near its 50 DMA line, and its impressive "positive reversal" on 5/14/09 was noted as a sign of institutional support. Gapped up on 4/30/09 for a new all-time high after reporting solid quarterly sales and earnings increases. Traded up as much as +72.42% since first featured at $18.89 in the 3/02/09 Mid-Day BreakOuts Report (read here).
>>> The latest Featured Stock Update with an annotated graph appeared on 6/2/2009. click here.
|
|
C
A
S
I |
News |
Chart |
SEC
View all notes Alert
me of new notes
Company
Profile
|
|
|
|
THESE ARE NOT BUY RECOMMENDATIONS!
Comments contained in the body of this report are technical
opinions only. The material herein has been obtained
from sources believed to be reliable and accurate, however,
its accuracy and completeness cannot be guaranteed.
This site is not an investment advisor, hence it does
not endorse or recommend any securities or other investments.
Any recommendation contained in this report may not
be suitable for all investors and it is not to be deemed
an offer or solicitation on our part with respect to
the purchase or sale of any securities. All trademarks,
service marks and trade names appearing in this report
are the property of their respective owners, and are
likewise used for identification purposes only.
This report is a service available
only to active Paid Premium Members.
You may opt-out of receiving report notifications
at any time. Questions or comments may be submitted
by writing to Premium Membership Services 665 S.E. 10 Street, Suite 201 Deerfield Beach, FL 33441-5634 or by calling 1-800-965-8307
or 954-785-1121.
|
|
|


