You are not logged in.
This means you
CAN ONLY VIEW reports that were published prior to Monday, April 14, 2025.
You
MUST UPGRADE YOUR MEMBERSHIP if you want to see any current reports.
AFTER MARKET UPDATE - FRIDAY, JUNE 1ST, 2012
Previous After Market Report Next After Market Report >>>
|
|
|
|
DOW |
-274.88 |
12,118.57 |
-2.22% |
|
Volume |
999,544,590 |
-25% |
|
Volume |
1,922,979,400 |
-7% |
|
NASDAQ |
-79.86 |
2,747.48 |
-2.82% |
|
Advancers |
427 |
13% |
|
Advancers |
412 |
16% |
|
S&P 500 |
-32.29 |
1,278.04 |
-2.46% |
|
Decliners |
2,687 |
84% |
|
Decliners |
2,166 |
82% |
|
Russell 2000 |
-24.40 |
737.42 |
-3.20% |
|
52 Wk Highs |
24 |
|
|
52 Wk Highs |
10 |
|
|
S&P 600 |
-13.18 |
414.95 |
-3.08% |
|
52 Wk Lows |
159 |
|
|
52 Wk Lows |
148 |
|
|
 |
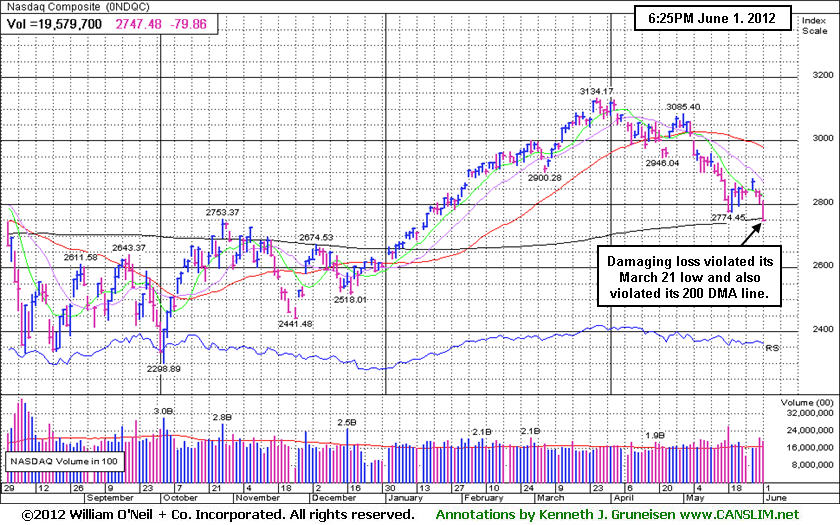
Large Losses Push Major Indices Into Deeper Correction
Kenneth J. Gruneisen - Passed the CAN SLIM® Master's Exam
For the week, the Dow Jones Industrial Average fell -3.3% while the S&P 500 Index and Nasdaq Composite Index each lost -3.2%. On Friday's session the indices finished with substantial losses for their first trading session of June, and all three of the major averages collectively closed below their longer-term 200-day moving average lines for the first time since December. The losses ended the latest rally attempt while clearly undercutting the indices' previously noted "Day 1" lows. Volume was reported lighter than the prior session totals on the Nasdaq exchange and on the NYSE, however that provided little to ease investor concerns. Breadth was solidly negative as decliners led advancers by more than 6-1 on the NYSE and by more than 5-1 on the Nasdaq exchange. The total number of new 52-week lows solidly outnumbered new 52-week highs on the NYSE and on the Nasdaq exchange. There was a complete evaporation of leadership while not a single high-ranked company from the CANSLIM.net Leaders List made a new 52-week high and appeared on the CANSLIM.net BreakOuts Page, down from the prior session total of 15 stocks. Additionally, there were losses for every one of the 18 high-ranked companies currently included on the Featured Stocks Page.
Markets fell after a jobs report showed employers added the fewest workers in a year. Non-farm payrolls for May climbed by 69,000, less than the street estimate for a 150,000 advance and the unemployment rate unexpectedly increased to 8.2% from 8.1%. Manufacturing data added to the negative tone as growth slowed across the globe. The ISM factory index fell to 53.5 in May and manufacturing in the euro zone dropped to a three-year low while China experienced its weakest production growth since December of last year.
Losses in influential financial firms led the declines as big losses were tallied by American International Group, Inc (AIG -6.75%), Morgan Stanley (MS -4.72%), Bank of America Corp (BAC -4.49%), Citigroup Inc (C -4.22%), American Express Company (AXP -4.20%), JP Morgan Chase & Co (JPM -3.68%), and The Goldman Sachs Group, Inc (GS -3.20%).
Facebook, Inc (FB -6.35%) fell again and closed the session -27% from its $38.00 priced IPO, an offering which was completed on May 18th with the helpful assistance of several of the above mentioned financial firms as underwriters.
In bondland, both the yield on the 30-year bond and the 10-year note hit new record lows with the long bond up over a full point and a half to yield 2.53% and the benchmark note gained 30/32 to yield 1.46%.
The major averages (M criteria) are technically considered to be in a "correction" and stocks remain vulnerable to much greater downside, a point repeatedly included in bold in this commentary! Historical studies suggest that the most constructive market rallies produced a solid follow-through day (FTD) between Days 4-7 of a new rally effort. Gains of +1.4% or greater by at least one of the major indexes should be backed by higher volume and preferably above average volume coupled with an expansion in the number of stocks hitting new highs. Only fresh technical proof may give fact-based investors the clearance to begin with new buying efforts strictly in sound buy candidates. Meanwhile, investors should keep up a watchlist of worthy buy candidates while remaining protective of capital.
PICTURED: The Nasdaq Composite Index undercut the May 21st lows ending the latest rally attempt without a confirming follow-through day.
|
 Kenneth J. Gruneisen started out as a licensed stockbroker in August 1987, a couple of months prior to the historic stock market crash that took the Dow Jones Industrial Average down -22.6% in a single day. He has published daily fact-based fundamental and technical analysis on high-ranked stocks online for two decades. Through FACTBASEDINVESTING.COM, Kenneth provides educational articles, news, market commentary, and other information regarding proven investment systems that work in good times and bad.
Comments contained in the body of this report are technical opinions only and are not necessarily those of Gruneisen Growth Corp. The material herein has been obtained from sources believed to be reliable and accurate, however, its accuracy and completeness cannot be guaranteed. Our firm, employees, and customers may effect transactions, including transactions contrary to any recommendation herein, or have positions in the securities mentioned herein or options with respect thereto. Any recommendation contained in this report may not be suitable for all investors and it is not to be deemed an offer or solicitation on our part with respect to the purchase or sale of any securities. |
|
 |
Financials Led Broader Losses; Gold & Silver Index Rallies Back
Kenneth J. Gruneisen - Passed the CAN SLIM® Master's Exam
The always-influential financial groups were the most guilty culprits behind Friday's big losses for the major averages. Large losses for the Broker/Dealer Index ($XBD -3.52%) and Bank Index ($BKX -4.88%) robbed the latest rally attempt of a chance to produce a follow-through day. The Semiconductor Index ($SOX -4.13%), Networking Index ($NWX -3.28%), Biotechnology Index ($BTK -3.01%), and Internet Index ($IIX -2.54%) clicked up unanimous losses in the tech sector. The Retail Index ($RLX -2.42%) ripped lower and the Healthcare Index ($HMO -2.55%) also felt the markets ills. Energy-related stocks also were burned for big losses as the Oil Services Index ($OSX -2.36%) and Integrated Oil Index ($XOI -1.82%) slid lower.
Charts courtesy www.stockcharts.com
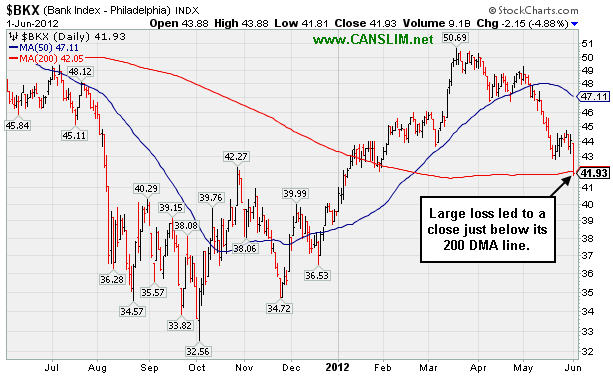
PICTURED 1: The Bank Index's ($BKX -4.88%) large loss led to a close below its 200-day moving average (DMA) line for the first time since January.
Charts courtesy www.stockcharts.com
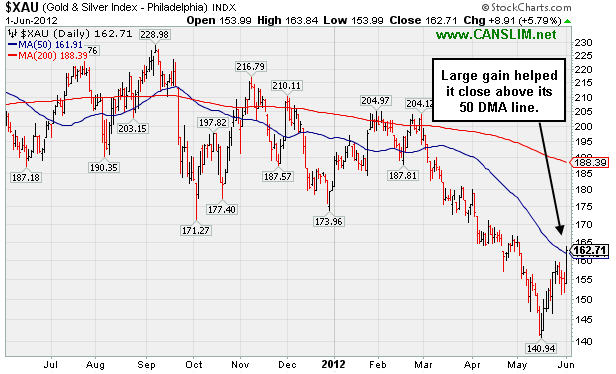
PICTURED 2: The Gold & Silver Index ($XAU +5.79%) had a shining moment on Friday as its large gain helped it rally above its 50-day moving average (DMA) line for the first time since early March.
| Oil Services |
$OSX |
196.02 |
-4.73 |
-2.36% |
-9.37% |
| Healthcare |
$HMO |
2,229.96 |
-58.25 |
-2.55% |
-2.26% |
| Integrated Oil |
$XOI |
1,072.75 |
-19.89 |
-1.82% |
-12.72% |
| Semiconductor |
$SOX |
353.17 |
-15.20 |
-4.13% |
-3.09% |
| Networking |
$NWX |
199.57 |
-6.77 |
-3.28% |
-7.25% |
| Internet |
$IIX |
285.81 |
-7.46 |
-2.54% |
+1.45% |
| Broker/Dealer |
$XBD |
83.00 |
-3.03 |
-3.52% |
-0.32% |
| Retail |
$RLX |
586.86 |
-14.58 |
-2.42% |
+12.17% |
| Gold & Silver |
$XAU |
162.71 |
+8.91 |
+5.79% |
-9.93% |
| Bank |
$BKX |
41.93 |
-2.15 |
-4.88% |
+6.48% |
| Biotech |
$BTK |
1,382.11 |
-42.91 |
-3.01% |
+26.63% |
|
|
|
 |
Distributional Action Brought Technical Damage This Week
Kenneth J. Gruneisen - Passed the CAN SLIM® Master's Exam
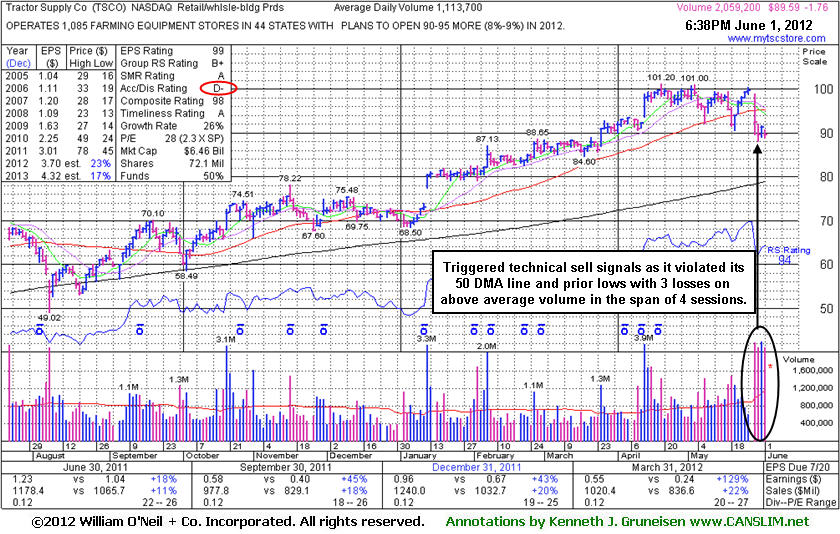
Tractor Supply Co (TSCO -$1.76 or -1.93% to $89.59) was down again today for a 3rd loss with above average volume in the span of 4 sessions. It violated its 50-day moving average (DMA) line and prior lows triggering technical sell signals. It had not triggered a new (or add-on) technical buy signal in recent weeks while it encountered resistance in the $101 area. Its Accumulation/Distribution Rating is now a D- (see red circle), down from an A- when making its last appearance in this FSU section on 4/17/12 with an annotated graph under the headline "Extended From Base Posting 5th Straight Weekly Gain". It had encountered a handful of distribution days (losses with higher volume than the prior session) prior to this week's breakdown. Based on the weak action it will be dropped from the Featured Stocks list tonight.
Disciplined investors might not be wise to give even a long-time leader much opportunity to recover when the market is in an ugly correction. Odds are not favorable when 3 out of 4 stocks tend to move in the direction of the major averages, and regular readers of the market commentary surely have no question what direction the market (M criteria) has been heading lately.
TSCO had traded up more than +25% after it was highlighted in yellow in the 1/12/12 mid-day report (read here) with pivot point cited based on its 12/09/11 high plus 10 cents. Its "breakaway gap" was noted as one exception to the rule of buying stocks only trading within 5% of their prior chart highs, however, investors were reminded that risk increases the further one chases any stock from a sound base pattern. In 3 of the past 4 quarterly comparisons it showed better than +25% earnings increases satisfying C criteria. A slight downturn in FY '08 earnings is a minor flaw concerning the A criteria, but that has been followed by very strong growth, and its 3-5 year "Growth Rate" of +26% is solid. As indicated on the weekly graph below, the number of top-rated funds owning its shares has risen from 525 in Jun '11 to 654 in Mar '12, a reassuring trend concerning the I criteria.
|
|
|
Color Codes Explained :
Y - Better candidates highlighted by our
staff of experts.
G - Previously featured
in past reports as yellow but may no longer be buyable under the
guidelines.
***Last / Change / Volume data in this table is the closing quote data***
Symbol/Exchange
Company Name
Industry Group |
PRICE |
CHANGE
(%Change) |
Day High |
Volume
(% DAV)
(% 50 day avg vol) |
52 Wk Hi
% From Hi |
Featured
Date |
Price
Featured |
Pivot Featured |
|
Max Buy |
ALXN
-
NASDAQ
Alexion Pharmaceuticals
DRUGS - Drug Manufacturers - Other
|
$87.60
|
-2.97
-3.28% |
$89.87
|
2,407,706
118.33% of 50 DAV
50 DAV is 2,034,700
|
$95.01
-7.80%
|
5/1/2012
|
$91.73
|
PP = $95.11
|
|
MB = $99.87
|
 Most Recent Note - 6/1/2012 7:12:59 PM
G - Color code is changed to green after a 5th consecutive loss led to a close below its 50 DMA line. Faces some resistance in the $94-95 area.
>>> The latest Featured Stock Update with an annotated graph appeared on 5/31/2012. Click here.
View all notes |
Alert me of new notes |
CANSLIM.net Company Profile |
SEC |
Zacks Reports |
StockTalk |
News |
Chart |
Request a new note
C
A N
S L
I M


|
ARBA
-
NASDAQ
Ariba Inc
INTERNET - Internet Software and Services
|
$44.80
|
-0.13
-0.29% |
$44.93
|
3,310,236
840.59% of 50 DAV
50 DAV is 393,800
|
$45.48
-1.50%
|
4/27/2012
|
$38.53
|
PP = $37.24
|
|
MB = $39.10
|
Most Recent Note - 6/1/2012 11:47:47 AM
G - Holding its ground since a considerable gain on 5/22/12 with heavy volume on news it will be bought by SAP in a $4.3 billion deal.
>>> The latest Featured Stock Update with an annotated graph appeared on 4/30/2012. Click here.
View all notes |
Alert me of new notes |
CANSLIM.net Company Profile |
SEC |
Zacks Reports |
StockTalk |
News |
Chart |
Request a new note
C
A N
S L
I M
|
CERN
-
NASDAQ
Cerner Corp
COMPUTER SOFTWARE and SERVICES - Healthcare Information Service
|
$76.37
|
-1.59
-2.04% |
$77.28
|
1,516,566
125.45% of 50 DAV
50 DAV is 1,208,900
|
$84.10
-9.19%
|
4/27/2012
|
$77.23
|
PP = $78.63
|
|
MB = $82.56
|
Most Recent Note - 6/1/2012 7:09:29 PM
G - Color code is changed to green after a gap down today and violation of its 50 DMA line and prior lows with a 2nd consecutive loss on above average volume.
>>> The latest Featured Stock Update with an annotated graph appeared on 5/1/2012. Click here.
View all notes |
Alert me of new notes |
CANSLIM.net Company Profile |
SEC |
Zacks Reports |
StockTalk |
News |
Chart |
Request a new note
C
A N
S L
I M
|
CMCSA
-
NASDAQ
Comcast Corp Cl A
MEDIA - CATV Systems
|
$28.63
|
-0.28
-0.97% |
$28.84
|
20,663,387
164.84% of 50 DAV
50 DAV is 12,535,500
|
$30.88
-7.27%
|
5/2/2012
|
$30.04
|
PP = $30.51
|
|
MB = $32.04
|
Most Recent Note - 6/1/2012 2:13:25 PM
G - Down today for a 3rd consecutive loss, sputtering below its 50 DMA line which is now downward sloping. The prior low ($28.09 on 5/21/12) defines important near-term support to watch where further deterioration would raise more serious concerns.
>>> The latest Featured Stock Update with an annotated graph appeared on 5/7/2012. Click here.
View all notes |
Alert me of new notes |
CANSLIM.net Company Profile |
SEC |
Zacks Reports |
StockTalk |
News |
Chart |
Request a new note
C
A N
S L
I M
|
COO
-
NYSE
Cooper Companies Inc
HEALTH SERVICES - Medical Instruments and Supplies
|
$82.87
|
-2.31
-2.71% |
$84.38
|
1,443,290
341.85% of 50 DAV
50 DAV is 422,200
|
$89.31
-7.21%
|
3/9/2012
|
$83.05
|
PP = $81.02
|
|
MB = $85.07
|
Most Recent Note - 6/1/2012 11:52:21 AM
G - Slumping under its 50 DMA line today, raising concerns with a 3rd consecutive loss. Consolidating near prior highs in the $83-84 area, an important near-term support level where more damaging losses may trigger worrisome technical sell signals.
>>> The latest Featured Stock Update with an annotated graph appeared on 5/18/2012. Click here.
View all notes |
Alert me of new notes |
CANSLIM.net Company Profile |
SEC |
Zacks Reports |
StockTalk |
News |
Chart |
Request a new note
C
A N
S L
I M
|
Symbol/Exchange
Company Name
Industry Group |
PRICE |
CHANGE
(%Change) |
Day High |
Volume
(% DAV)
(% 50 day avg vol) |
52 Wk Hi
% From Hi |
Featured
Date |
Price
Featured |
Pivot Featured |
|
Max Buy |
DG
-
NYSE
Dollar General Corp
RETAIL - Discount, Variety Stores
|
$48.62
|
-0.29
-0.59% |
$48.96
|
5,251,874
187.41% of 50 DAV
50 DAV is 2,802,300
|
$49.50
-1.78%
|
5/7/2012
|
$48.51
|
PP = $47.69
|
|
MB = $50.07
|
Most Recent Note - 6/1/2012 11:54:38 AM
Y - Pulling back today from new all-time highs hit this week after 3 consecutive gains. No resistance remains due to overhead supply. The broader market (M criteria) has yet to confirm a new rally, however, and without a solid follow-through day from at least one of the major averages all new buying efforts are discouraged under the fact-based investment system.
>>> The latest Featured Stock Update with an annotated graph appeared on 5/9/2012. Click here.
View all notes |
Alert me of new notes |
CANSLIM.net Company Profile |
SEC |
Zacks Reports |
StockTalk |
News |
Chart |
Request a new note
C
A N
S L
I M
|
EXPE
-
NASDAQ
Expedia Inc
INTERNET - Internet Information Providers
|
$44.65
|
-1.24
-2.70% |
$45.87
|
4,992,986
108.05% of 50 DAV
50 DAV is 4,620,800
|
$46.49
-3.96%
|
4/27/2012
|
$41.80
|
PP = $35.57
|
|
MB = $37.35
|
Most Recent Note - 6/1/2012 2:04:26 PM
G - Pulling back from its 52-week high today after a spurt of 3 consecutive gains. As previously noted, heavy volume behind a considerable gain on 5/23/12 technically helped it break out from an advanced "3-weeks tight" base with no resistance remaining due to overhead supply, however no new pivot point was cited. Until the market confirms a new rally with a solid follow through day from at least one of the major averages (M criteria) the fact-based investment system argues against new buying efforts in any stocks.
>>> The latest Featured Stock Update with an annotated graph appeared on 5/3/2012. Click here.
View all notes |
Alert me of new notes |
CANSLIM.net Company Profile |
SEC |
Zacks Reports |
StockTalk |
News |
Chart |
Request a new note
C
A N
S L
I M
|
GNC
-
NYSE
G N C Holdings Inc
RETAIL - Drug Stores
|
$36.59
|
-1.94
-5.04% |
$38.38
|
2,394,464
129.19% of 50 DAV
50 DAV is 1,853,400
|
$41.95
-12.78%
|
1/19/2012
|
$28.99
|
PP = $29.60
|
|
MB = $31.08
|
Most Recent Note - 6/1/2012 2:07:55 PM
G - Slumping below its 50 DMA line today, raising concerns with its 5th consecutive loss on ever-increasing volume. Prior low ($35.13 on 5/18/12) defines the next important chart support where a violation would raise more serious concerns
>>> The latest Featured Stock Update with an annotated graph appeared on 4/26/2012. Click here.
View all notes |
Alert me of new notes |
CANSLIM.net Company Profile |
SEC |
Zacks Reports |
StockTalk |
News |
Chart |
Request a new note
C
A N
S L
I M
|
NTES
-
NASDAQ
Netease Inc Adr
INTERNET - Internet Information Providers
|
$60.04
|
-2.32
-3.72% |
$62.80
|
1,166,633
157.10% of 50 DAV
50 DAV is 742,600
|
$63.07
-4.80%
|
3/19/2012
|
$56.18
|
PP = $55.10
|
|
MB = $57.86
|
Most Recent Note - 6/1/2012 12:05:25 PM
G - Pulling back today after 3 consecutive gains to within close striking distance of its 52-week high. It has not formed a sound base pattern. Recent lows near the $55 area define important chart support to watch where a violation may trigger a worrisome technical sell signal.
>>> The latest Featured Stock Update with an annotated graph appeared on 5/24/2012. Click here.
View all notes |
Alert me of new notes |
CANSLIM.net Company Profile |
SEC |
Zacks Reports |
StockTalk |
News |
Chart |
Request a new note
C
A N
S L
I M
|
SWI
-
NYSE
Solarwinds Inc
COMPUTER SOFTWARE and SERVICES - Application Software
|
$42.57
|
-3.29
-7.17% |
$44.60
|
1,141,015
99.37% of 50 DAV
50 DAV is 1,148,200
|
$48.64
-12.48%
|
4/26/2012
|
$45.15
|
PP = $42.32
|
|
MB = $44.44
|
Most Recent Note - 6/1/2012 1:51:44 PM
G - Damaging loss today has undercut prior lows and has it slumping near its 50 DMA line defining important support. A violation of that short-term average may trigger a more worrisome technical sell signal.
>>> The latest Featured Stock Update with an annotated graph appeared on 5/21/2012. Click here.
View all notes |
Alert me of new notes |
CANSLIM.net Company Profile |
SEC |
Zacks Reports |
StockTalk |
News |
Chart |
Request a new note
C
A N
S L
I M
|
Symbol/Exchange
Company Name
Industry Group |
PRICE |
CHANGE
(%Change) |
Day High |
Volume
(% DAV)
(% 50 day avg vol) |
52 Wk Hi
% From Hi |
Featured
Date |
Price
Featured |
Pivot Featured |
|
Max Buy |
SXCI
-
NASDAQ
S X C Health Solutions
COMPUTER SOFTWARE and SERVICES - Healthcare Information Service
|
$88.56
|
-1.15
-1.28% |
$90.90
|
1,174,802
100.36% of 50 DAV
50 DAV is 1,170,600
|
$100.50
-11.88%
|
2/23/2012
|
$68.24
|
PP = $66.05
|
|
MB = $69.35
|
Most Recent Note - 5/30/2012 2:06:42 PM
G - Down today with higher volume (but still below average), consolidating above its recent lows and above its 50 DMA line ($84.71) defining important support to watch. Volume totals have been cooling while still holding its ground in a tight range. Completed a new Public Offering on 5/10/12. Consolidating in a tight range since it posted huge volume-driven gains on 4/18 and 4/19 while rallying on M&A news.
>>> The latest Featured Stock Update with an annotated graph appeared on 5/17/2012. Click here.
View all notes |
Alert me of new notes |
CANSLIM.net Company Profile |
SEC |
Zacks Reports |
StockTalk |
News |
Chart |
Request a new note
C
A N
S L
I M
|
TDG
-
NYSE
Transdigm Group Inc
AEROSPACE/DEFENSE - Aerospace/Defense Products and; Services
|
$121.71
|
-1.29
-1.05% |
$122.66
|
727,353
140.55% of 50 DAV
50 DAV is 517,500
|
$132.69
-8.27%
|
2/29/2012
|
$120.10
|
PP = $118.93
|
|
MB = $124.88
|
Most Recent Note - 5/30/2012 2:07:49 PM
G - Pulling back on lighter volume today following a gain on the prior session backed by above average volume. Recently found prompt support at its 50 DMA line and near prior highs.
>>> The latest Featured Stock Update with an annotated graph appeared on 5/23/2012. Click here.
View all notes |
Alert me of new notes |
CANSLIM.net Company Profile |
SEC |
Zacks Reports |
StockTalk |
News |
Chart |
Request a new note
C
A N
S L
I M
|
TNGO
-
NASDAQ
Tangoe Inc
COMPUTER SOFTWARE and SERVICES - Technical and System Software
|
$17.86
|
-1.45
-7.51% |
$18.71
|
752,953
106.73% of 50 DAV
50 DAV is 705,500
|
$23.05
-22.52%
|
3/27/2012
|
$19.35
|
PP = $20.00
|
|
MB = $21.00
|
Most Recent Note - 6/1/2012 1:54:54 PM
Gapped down today amid widespread market weakness, slumping further below its 50 DMA line with a 7th consecutive loss. Based on poor technical action it will be dropped from the Featured Stocks list tonight.
>>> The latest Featured Stock Update with an annotated graph appeared on 5/25/2012. Click here.
View all notes |
Alert me of new notes |
CANSLIM.net Company Profile |
SEC |
Zacks Reports |
StockTalk |
News |
Chart |
Request a new note
C
A N
S L
I M
|
TSCO
-
NASDAQ
Tractor Supply Co
SPECIALTY RETAIL - Specialty Retail, Other
|
$89.59
|
-1.76
-1.93% |
$90.74
|
2,059,800
184.95% of 50 DAV
50 DAV is 1,113,700
|
$101.20
-11.47%
|
5/1/2012
|
$98.38
|
PP = $101.30
|
|
MB = $106.37
|
Most Recent Note - 6/1/2012 7:05:06 PM
Down again today for a 3rd loss with above average volume in the span of 4 sessions. This week it violated its 50 DMA line and prior lows triggering technical sell signals. Based on weak action it will be dropped from the Featured Stocks list tonight. See the latest FSU analysis for more details and a new annotated graph.
>>> The latest Featured Stock Update with an annotated graph appeared on 6/1/2012. Click here.
View all notes |
Alert me of new notes |
CANSLIM.net Company Profile |
SEC |
Zacks Reports |
StockTalk |
News |
Chart |
Request a new note
C
A N
S L
I M
|
UA
-
NYSE
Under Armour Inc Cl A
CONSUMER NON-DURABLES - Textile - Apparel Clothing
|
$95.75
|
-4.98
-4.94% |
$98.77
|
1,037,568
112.52% of 50 DAV
50 DAV is 922,100
|
$102.86
-6.91%
|
2/15/2012
|
$85.77
|
PP = $84.86
|
|
MB = $89.10
|
Most Recent Note - 6/1/2012 1:56:38 PM
G - Slumping under its 50 DMA line today after a gap down amid widespread market weakness. Concerns were recently raised by weaker fundamentals, its first quarterly earnings increase below the +25% minimum guideline in more than 2 years.
>>> The latest Featured Stock Update with an annotated graph appeared on 5/29/2012. Click here.
View all notes |
Alert me of new notes |
CANSLIM.net Company Profile |
SEC |
Zacks Reports |
StockTalk |
News |
Chart |
Request a new note
C
A N
S L
I M
|
Symbol/Exchange
Company Name
Industry Group |
PRICE |
CHANGE
(%Change) |
Day High |
Volume
(% DAV)
(% 50 day avg vol) |
52 Wk Hi
% From Hi |
Featured
Date |
Price
Featured |
Pivot Featured |
|
Max Buy |
V
-
NYSE
Visa Inc Cl A
DIVERSIFIED SERVICES - Business/Management Services
|
$112.25
|
-2.95
-2.56% |
$114.89
|
4,663,641
126.74% of 50 DAV
50 DAV is 3,679,800
|
$125.35
-10.45%
|
3/12/2012
|
$116.53
|
PP = $119.46
|
|
MB = $125.43
|
Most Recent Note - 6/1/2012 2:00:47 PM
Slumping further below its 50 DMA line, today's 3rd consecutive loss has it trading under the prior low ($112.50 on 5/18/12) raising more serious concerns. It now faces overhead supply up through the $125 area that may be a source of resistance. Based on its technical deterioration it will be dropped from the Featured Stocks list tonight.
>>> The latest Featured Stock Update with an annotated graph appeared on 5/16/2012. Click here.
View all notes |
Alert me of new notes |
CANSLIM.net Company Profile |
SEC |
Zacks Reports |
StockTalk |
News |
Chart |
Request a new note
C
A N
S L
I M
|
VSI
-
NYSE
Vitamin Shoppe Inc
SPECIALTY RETAIL - Specialty Retail, Other
|
$48.81
|
-0.71
-1.43% |
$49.24
|
484,233
105.15% of 50 DAV
50 DAV is 460,500
|
$55.29
-11.72%
|
4/25/2012
|
$47.77
|
PP = $48.46
|
|
MB = $50.88
|
Most Recent Note - 6/1/2012 2:02:40 PM
G - Slumping near its 50 DMA line today with a 3rd consecutive loss. Support to watch is defined by that important short-term average and its old highs in the $48 area.
>>> The latest Featured Stock Update with an annotated graph appeared on 4/25/2012. Click here.
View all notes |
Alert me of new notes |
CANSLIM.net Company Profile |
SEC |
Zacks Reports |
StockTalk |
News |
Chart |
Request a new note
C
A N
S L
I M
|
WFM
-
NASDAQ
Whole Foods Market Inc
RETAIL - Grocery Stores
|
$85.68
|
-2.93
-3.31% |
$88.48
|
2,622,430
152.88% of 50 DAV
50 DAV is 1,715,400
|
$91.50
-6.36%
|
5/3/2012
|
$90.28
|
PP = $86.45
|
|
MB = $90.77
|
Most Recent Note - 6/1/2012 12:25:45 PM
G - Encountered distributional pressure this week while rebounding toward its 52-week high. Recently found prompt support near its 50 DMA line but damaging losses negated the latest technical breakout after it stalled following its considerable "breakaway gap" on 5/03/12.
>>> The latest Featured Stock Update with an annotated graph appeared on 5/11/2012. Click here.
View all notes |
Alert me of new notes |
CANSLIM.net Company Profile |
SEC |
Zacks Reports |
StockTalk |
News |
Chart |
Request a new note
C
A N
S L
I M
|
|
|
|
THESE ARE NOT BUY RECOMMENDATIONS!
Comments contained in the body of this report are technical
opinions only. The material herein has been obtained
from sources believed to be reliable and accurate, however,
its accuracy and completeness cannot be guaranteed.
This site is not an investment advisor, hence it does
not endorse or recommend any securities or other investments.
Any recommendation contained in this report may not
be suitable for all investors and it is not to be deemed
an offer or solicitation on our part with respect to
the purchase or sale of any securities. All trademarks,
service marks and trade names appearing in this report
are the property of their respective owners, and are
likewise used for identification purposes only.
This report is a service available
only to active Paid Premium Members.
You may opt-out of receiving report notifications
at any time. Questions or comments may be submitted
by writing to Premium Membership Services 665 S.E. 10 Street, Suite 201 Deerfield Beach, FL 33441-5634 or by calling 1-800-965-8307
or 954-785-1121.
|
|
|

