You are not logged in.
This means you
CAN ONLY VIEW reports that were published prior to Monday, April 14, 2025.
You
MUST UPGRADE YOUR MEMBERSHIP if you want to see any current reports.
AFTER MARKET UPDATE - MONDAY, JUNE 1ST, 2009
Previous After Market Report Next After Market Report >>>
|
|
|
|
DOW |
+221.11 |
8,721.44 |
+2.60% |
|
Volume |
1,499,910,160 |
-19% |
|
Volume |
2,658,816,770 |
+3% |
|
NASDAQ |
+54.35 |
1,828.68 |
+3.06% |
|
Advancers |
2,510 |
80% |
|
Advancers |
2,098 |
73% |
|
S&P 500 |
+23.73 |
942.87 |
+2.58% |
|
Decliners |
564 |
18% |
|
Decliners |
683 |
24% |
|
Russell 2000 |
+19.75 |
521.33 |
+3.94% |
|
52 Wk Highs |
31 |
|
|
52 Wk Highs |
56 |
|
|
S&P 600 |
+10.97 |
275.86 |
+4.14% |
|
52 Wk Lows |
2 |
|
|
52 Wk Lows |
8 |
|
|
 |
Benchmark S&P 500 Rises Above 200-Day Average; GM Files Chapter 11
Adam Sarhan, Contributing Writer,
The market raced higher on Monday, with bullish action sending each of the major averages above near term resistance. Advancers trumped decliners by over a 4-to-1 ratio on the NYSE and by over a 3-to-1 ratio on the Nasdaq exchange. There were 28 high-ranked companies from the CANSLIM.net Leaders List that made a new 52-week high and appeared on the CANSLIM.net BreakOuts Page, higher than the 14 issues that appeared on the prior session. The greater expansion in the new highs list was encouraging news for growth oriented investors. Volume was reported higher than the prior session on the Nasdaq exchange, which was an encouraging sign of institutional accumulation. The NYSE volume total reports from other sources also suggested an increase in trading over Friday's totals, conflicting with the data shown in this market Commentary section's top table. More on this subject of NYSE volume is mentioned in the Editor's Letter in the June 2009 issue of CANSLIM.net News which was published on Sunday (read here).
The market opened higher after General Motors (GM delisted) filed for Chapter 11 bankruptcy protection. The auto giant confirmed all previous rumors that it would file for bankruptcy. The US government announced plans to invest (not loan) an additional $30 billion for a +60% stake in the new company. President Obama made it very clear when he said his administration has no interest in running the day to day operations of the new company. However, he acknowledged that this was their best option. The market rallied on the news that shares of GM and Citigroup (C -0.81%) will be removed from the Dow Jones Industrial Average. Cisco (CSCO +5.41%) and Travelers (TRV +3.07%) will replace the two icons.
The news on the economic front was positive which helped send the major averages above stubborn resistance levels. Personal spending for April declined -0.1%, which was topped the average forecast and was an improvement from March. Meanwhile, personal income for April showed a surprise +0.5% in the face of higher unemployment. Construction spending for April was also stronger than expected and rose by +0.8% month-over-month. The ISM Manufacturing Index for May was +42.8, which largely matched expectations however it was stronger than the prior month's reading. The reading indicated that manufacturing activity continues to contract but the rate of contraction is falling. Monday's data was the latest in a series of stronger than expected economic data which suggests the worst of the recession is behind us and has played a major role in the market's strong rally from the March low.
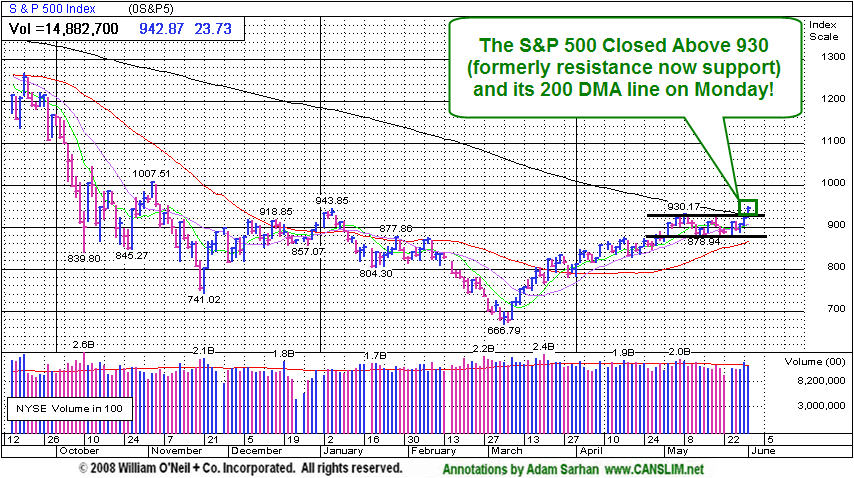
After a brief consolidation the market resolved itself to the upside on Monday, which was a very welcome and healthy sign. Remember it is very important to objectively analyze the tape and let the market guide you. Trying to fight it is a futile activity that does little more than boost your ego and hurt your portfolio. The market continued to push higher, and the major averages managed to breakout and close above important near-term resistance points. Looking forward, the market will remain healthy as long as those resistance points act as support during consolidations. As long as the major averages continue trading above support (formerly resistance) the bulls remain in control. However, if at any point those levels are breached, the deterioration would start to suggest that the bulls are losing their edge.
PICTURED: The S&P 500 Index closed above 930, a former resistance level, and rose above its 200-day moving average (DMA) line on Monday! This was the first time the benchmark index closed above its 200 DMA line since December 2007! The Dow Jones Industrial Average is the only one of the 3 major indices still under its 200 DMA line, yet it appears on the brink of crossing above that important long-term average.
|
|
|
 |
Retail Index Leads Groups With Standout Gain
Kenneth J. Gruneisen - Passed the CAN SLIM® Master's Exam
The Semiconductor Index ($SOX +5.31%) led the tech sector while the Internet ($IIX +3.04%) and Networking ($NWX +3.15%) indexes also posted solid gains. Strength in energy shares boosted the Integrated Oil ($XOI +3.35%) and Oil Services ($OSX +4.73%) indexes substantially, meanwhile the Healthcare ($HMO +2.11%) group and the Biotechnology Index ($BTK +0.82%) posted smaller gains. The Broker/Dealer Index ($XBD +1.65%) also posted a modest gain, but the Bank Index ($BKX -0.53%) ended Monday's session with a small loss The Gold & Silver ($XAU -1.50%) was a laggard, giving up some of its recent gains on profit taking.
Charts courtesy www.stockcharts.com
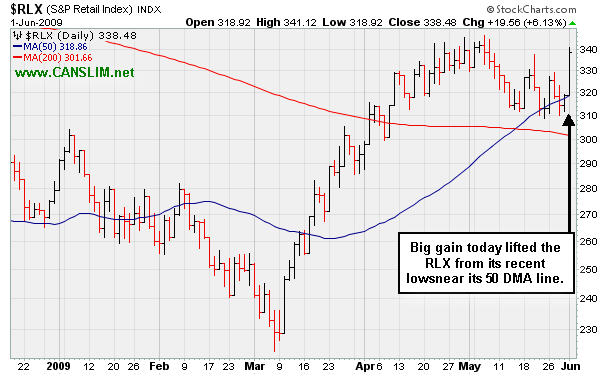
PICTURED: The Retail Index ($RLX +6.13%) set a strong pace on Monday as it posted a large gain and rallied up from its 50-day moving average line.
| Oil Services |
$OSX |
184.70 |
+0.00 |
+0.00% |
+52.15% |
| Healthcare |
$HMO |
1,115.42 |
+23.08 |
+2.11% |
+16.17% |
| Integrated Oil |
$XOI |
1,020.27 |
+33.03 |
+3.35% |
+4.14% |
| Semiconductor |
$SOX |
285.71 |
+0.00 |
+0.00% |
+34.66% |
| Networking |
$NWX |
194.07 |
+5.92 |
+3.15% |
+34.87% |
| Internet |
$IIX |
192.69 |
+5.68 |
+3.04% |
+44.05% |
| Broker/Dealer |
$XBD |
101.19 |
+1.64 |
+1.65% |
+30.62% |
| Retail |
$RLX |
338.48 |
+19.56 |
+6.13% |
+21.21% |
| Gold & Silver |
$XAU |
157.75 |
+0.00 |
+0.00% |
+27.37% |
| Bank |
$BKX |
37.22 |
-0.20 |
-0.53% |
-16.02% |
|
|
|
 |
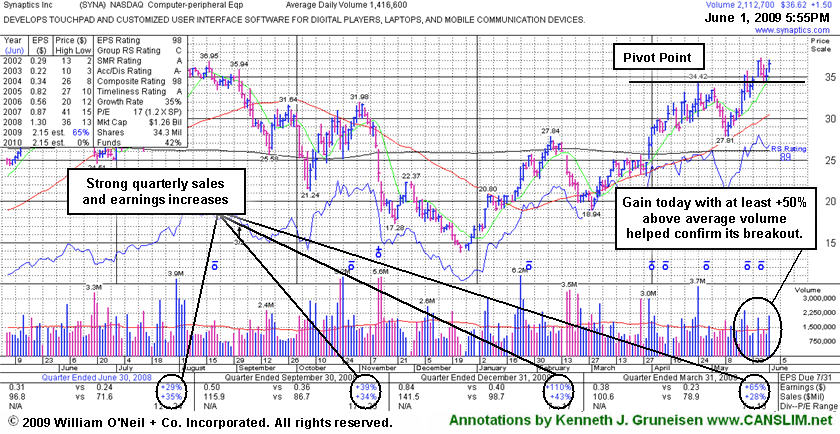
Additional Gain Above Pivot Point With Above Average Volume
Kenneth J. Gruneisen - Passed the CAN SLIM® Master's Exam
Synaptics Inc. (SYNA +$1.50 or +4.27% to $36.62) gapped up today and posted a gain with just better than the minimum +50% above average volume guideline. This confirmed its recent bullish breakout above its pivot point, and it closed just above its "max buy" level, so no resistance remains from overhead supply. It was first featured in yellow in the May 18, 2009 mid-day report (read here). The number of top-rated funds owning its shares rose from 123 in June '08 to 184 in March '09, which is good news concerning the I criteria. Strong earnings and sales revenues growth in the 4 latest quarterly comparisons satisfies the C criteria. Its annual earnings (the A criteria) history showed a downturn in 2006, leaving concerns, but it followed that up with strong growth the next 2 years stock was first featured on Monday, May 18, 2009 in the CANSLIM.net Mid Day Breakouts Report (read here).
C A N S L I M | StockTalk | News | Chart | SEC | Zacks Reports |   
View all notes | Alert me of new notes | CANSLIM.net Company Profile |
|
|
Color Codes Explained :
Y - Better candidates highlighted by our
staff of experts.
G - Previously featured
in past reports as yellow but may no longer be buyable under the
guidelines.
***Last / Change / Volume quote data in this table corresponds with the timestamp on the note***
Symbol/Exchange
Company Name
Industry Group |
Last |
Chg. |
Vol
% DAV |
Date Featured |
Price Featured |
Latest Pivot Point
Featured |
Status |
| Latest Max Buy Price |
GMCR
- NASDAQ
Green Mtn Coffee Roastrs
FOOD & BEVERAGE - Processed & Packaged Goods
|
$83.75
|
N/A
|
N/A
N/A
|
1/1/2008
(Date
Featured) |
$40.70
(Price
Featured) |
PP = $42.99 |
G |
| MB = $45.14 |
Most Recent Note - 6/1/2009 12:34:04 PM
G - Wedging higher in recent weeks following its 4/30/09 "breakaway gap" after it reported a strong quarterly financial report and news of a partnership with Wal-Mart Stores. Traded up as much as +123.59% since featured at $39.09 in the January 2009 CANSLIM.net News (read here).
>>> The latest Featured Stock Update with an annotated graph appeared on 5/26/2009. click here.
|
|
C
A
S
I |
News |
Chart |
SEC
View all notes Alert
me of new notes
Company
Profile
|
HMSY
- NASDAQ
H M S Holdings Corp
COMPUTER SOFTWARE & SERVICES - Healthcare Information Service
|
$36.77
|
N/A
|
N/A
N/A
|
2/20/2009
(Date
Featured) |
$34.08
(Price
Featured) |
PP = $36.55 |
Y |
| MB = $38.38 |
Most Recent Note - 6/1/2009 6:49:17 PM
Y - Gapped up today for a solid gain on average volume, ending at its third highest close ever. Volume totals dried up in recent weeks while forming a downward sloping high handle. No overhead supply is there to act as resistance for this Commercial Services - Healthcare firm. However, the group's Relative Strength rank has slipped from A in March to a D- now, which is a concern. Investors' odds are usually better when chosing leaders within a leading industry group.
>>> The latest Featured Stock Update with an annotated graph appeared on 5/28/2009. click here.
|
|
C
A
S
I |
News |
Chart |
SEC
View all notes Alert
me of new notes
Company
Profile
|
ILMN
- NASDAQ
Illumina Inc
DRUGS - Biotechnology
|
$37.89
|
N/A
|
N/A
N/A
|
5/3/2009
(Date
Featured) |
$38.14
(Price
Featured) |
PP = $39.05 |
Y |
| MB = $41.00 |
Most Recent Note - 6/1/2009 6:50:43 PM
Y - Small gap up today for a 3rd consecutive gain on light volume, rising further above its 50 DMA line. Consolidating in a very tight trading range for nearly 3 months. This high-ranked stock has yet to produce confirming gains above its pivot point to trigger a proper technical buy signal. Recently featured in the May 2009 issue of CANSLIM.net News (read here).
>>> The latest Featured Stock Update with an annotated graph appeared on 5/29/2009. click here.
|
|
C
A
S
I |
News |
Chart |
SEC
View all notes Alert
me of new notes
Company
Profile
|
LFT
-
|
$27.54
|
N/A
|
N/A
N/A
|
4/2/2009
(Date
Featured) |
$22.19
(Price
Featured) |
PP = $21.81 |
G |
| MB = $22.90 |
Most Recent Note - 6/1/2009 6:54:14 PM
G - Higher volume and lack of progress today was indicative of dustributional pressure. Last week's 5/28/09 gap up and considerable gain followed another strong quarterly financail report. Prompt repair of its recent 50 DMA line violation, and its gap up, were noted as signs of solid institutional (the I criteria) support and buying demand. This Chinese Computer Software firm recently filed a registration of approximately 16 million shares for resale, and it also revealed a planned acquisition of another Chinese service provider.
>>> The latest Featured Stock Update with an annotated graph appeared on 5/21/2009. click here.
|
|
C
A
S
I |
News |
Chart |
SEC
View all notes Alert
me of new notes
Company
Profile
|
NFLX
- NASDAQ
Netflix Inc
SPECIALTY RETAIL - Music & Video Stores
|
$40.94
|
N/A
|
N/A
N/A
|
1/29/2009
(Date
Featured) |
$37.13
(Price
Featured) |
PP = $38.93 |
G |
| MB = $40.88 |
Most Recent Note - 6/1/2009 6:56:57 PM
G - Its odds of advancing meaningfully only get worse the longer it struggles under its 50 DMA line, which is what it has been doing for more than 3 weeks since earlier technical sell signals were noted. It needs to rally above that important short-term average for its outlook to improve. Posted gains of as much as +35.31% since it was first featured in yellow at $37.13 in the 1/29/09 CANSLIM.net Mid-Day Breakouts Report (read here).
>>> The latest Featured Stock Update with an annotated graph appeared on 5/20/2009. click here.
|
|
C
A
S
I |
News |
Chart |
SEC
View all notes Alert
me of new notes
Company
Profile
|
NTES
- NASDAQ
Netease Inc Adr
INTERNET - Internet Information Providers
|
$35.81
|
N/A
|
N/A
N/A
|
5/21/2009
(Date
Featured) |
$31.19
(Price
Featured) |
PP = $32.75 |
G |
| MB = $34.39 |
Most Recent Note - 6/1/2009 6:58:52 PM
G - Gapped up today for yet another gain on above average volume, hitting new all-time highs above its "max buy" level. Color code is changed to green as it is now extended from a sound base. Its 5/28/09 gap up and considerable gain with +79% above average volume confirmed a technical buy signal as it rose above its pivot point. Indications of institutional (the I criteria) buying demand have been noted after earnings news on 5/20/09 a shakeout tested support near its 50 DMA line. First featured at $26.75 in the 3/31/09 CANSLIM.net Mid-Day Breakouts Report (read here). This high-ranked Chinese Internet - Content firm was also summarized in greater detail including an annotated graph in the April 2009 issue of CANSLIM.net News (read here).
>>> The latest Featured Stock Update with an annotated graph appeared on 5/22/2009. click here.
|
|
C
A
S
I |
News |
Chart |
SEC
View all notes Alert
me of new notes
Company
Profile
|
NVEC
- NASDAQ
N V E Corp
ELECTRONICS - Semiconductor - Specialized
|
$42.03
|
N/A
|
N/A
N/A
|
3/13/2009
(Date
Featured) |
$33.85
(Price
Featured) |
PP = $39.01 |
G |
| MB = $40.96 |
Most Recent Note - 6/1/2009 7:01:30 PM
G - Traded up and managed a new 52-week high close today on slightly higher than average volume, following weeks of quiet consolidation above important support at its 50 DMA line. Earnings per share rose +38% over the year ago period, yet sales were up just +14% and still rather minuscule.
>>> The latest Featured Stock Update with an annotated graph appeared on 5/27/2009. click here.
|
|
C
A
S
I |
News |
Chart |
SEC
View all notes Alert
me of new notes
Company
Profile
|
SNDA
-
|
$60.23
|
N/A
|
N/A
N/A
|
5/31/2009
(Date
Featured) |
$57.62
(Price
Featured) |
PP = $53.95 |
G |
| MB = $56.65 |
Most Recent Note - 6/1/2009 7:02:49 PM
G - Gapped up today and posted a solid gain with slightly above average volume, getting more dangerously extended from a sound base. Just featured in the June 2009 issue of CANSLIM.net News. Be sure to review the "What to Look Out For" section and entire detailed summary - read here).
>>> The latest Featured Stock Update with an annotated graph appeared on 5/30/2009. click here.
|
|
C
A
S
I |
News |
Chart |
SEC
View all notes Alert
me of new notes
Company
Profile
|
SYNA
- NASDAQ
Synaptics Inc
COMPUTER SOFTWARE & SERVICES - Information Technology Service
|
$36.62
|
N/A
|
N/A
N/A
|
5/18/2009
(Date
Featured) |
$32.58
(Price
Featured) |
PP = $34.52 |
Y |
| MB = $36.25 |
Most Recent Note - 6/1/2009 7:05:25 PM
Y - Gapped up for a gain today with above average volume, closing just above its "max buy" level. No resistance remains due to overhead supply. First featured in yellow in the May 18, 2009 mid-day report (read here). The number of top-rated funds owning its shares rose from 123 in June '08 to 184 in March '09, which is good news concerning the I criteria. Strong earnings and sales revenues growth in the 4 latest quarterly comparisons satisfies the C criteria. Its annual earnings (the A criteria) history showed a dowturn in 2006, leaving concerns, but it followed that up with strong growth the next 2 years.
>>> The latest Featured Stock Update with an annotated graph appeared on 6/1/2009. click here.
|
|
C
A
S
I |
News |
Chart |
SEC
View all notes Alert
me of new notes
Company
Profile
|
TNDM
- NASDAQ
Tandem Diabetes Care Inc
TELECOMMUNICATIONS - Wireless Communications
|
$31.21
|
N/A
|
N/A
N/A
|
3/2/2009
(Date
Featured) |
$18.89
(Price
Featured) |
PP = $29.85 |
Y |
| MB = $31.34 |
Most Recent Note - 6/1/2009 1:32:15 PM
Y - Gapped up today and hit a new all-time high with above average volume behind gains lifting it near its "max buy" level. Found support near its 50 DMA line, and its impressive "positive reversal" on 5/14/09 was noted as a sign of institutional support. Gapped up on 4/30/09 for a new all-time high after reporting solid quarterly sales and earnings increases. Traded up as much as +67.02% since first featured at $18.89 in the 3/02/09 Mid-Day BreakOuts Report (read here).
>>> The latest Featured Stock Update with an annotated graph appeared on 5/19/2009. click here.
|
|
C
A
S
I |
News |
Chart |
SEC
View all notes Alert
me of new notes
Company
Profile
|
|
|
|
THESE ARE NOT BUY RECOMMENDATIONS!
Comments contained in the body of this report are technical
opinions only. The material herein has been obtained
from sources believed to be reliable and accurate, however,
its accuracy and completeness cannot be guaranteed.
This site is not an investment advisor, hence it does
not endorse or recommend any securities or other investments.
Any recommendation contained in this report may not
be suitable for all investors and it is not to be deemed
an offer or solicitation on our part with respect to
the purchase or sale of any securities. All trademarks,
service marks and trade names appearing in this report
are the property of their respective owners, and are
likewise used for identification purposes only.
This report is a service available
only to active Paid Premium Members.
You may opt-out of receiving report notifications
at any time. Questions or comments may be submitted
by writing to Premium Membership Services 665 S.E. 10 Street, Suite 201 Deerfield Beach, FL 33441-5634 or by calling 1-800-965-8307
or 954-785-1121.
|
|
|


