You are not logged in.
This means you
CAN ONLY VIEW reports that were published prior to Monday, April 14, 2025.
You
MUST UPGRADE YOUR MEMBERSHIP if you want to see any current reports.
AFTER MARKET UPDATE - FRIDAY, MAY 31ST, 2013
Previous After Market Report Next After Market Report >>>
|
|
|
|
DOW |
-208.96 |
15,115.57 |
-1.36% |
|
Volume |
1,135,269,960 |
+60% |
|
Volume |
1,793,908,700 |
+4% |
|
NASDAQ |
-35.39 |
3,455.91 |
-1.01% |
|
Advancers |
466 |
15% |
|
Advancers |
694 |
27% |
|
S&P 500 |
-23.67 |
1,630.74 |
-1.43% |
|
Decliners |
2,594 |
83% |
|
Decliners |
1,789 |
69% |
|
Russell 2000 |
-10.29 |
984.14 |
-1.04% |
|
52 Wk Highs |
98 |
|
|
52 Wk Highs |
127 |
|
|
S&P 600 |
-5.29 |
552.06 |
-0.95% |
|
52 Wk Lows |
162 |
|
|
52 Wk Lows |
28 |
|
|
Historic studies have shown that stocks with superior ranks typically outperform the broader market averages. However, the IBD 85-85 Index has been lagging for the past 2 years versus the S&P 500 Index, as indicated by its downward sloping Relative Strength line in the graph below. Time alone will tell us when the batch of high-ranked leaders is again coming into greater favor, but the index's lackluster performance may help explain why fans of the fact-based investment system have found it difficult during this time span to match or beat the performance of the major averages like the S&P 500 Index which is up +14.3% year-to-date.
From the 2009 low until mid-2011 its Relative Strength line had an upward slant to it, indicating that this high-ranked index was achieving "above average" results during that period, as one would normally expect or hope for it to do. If the jagged blue line were flat it would be telling us that the major averages' rally into record high territory was including an even share of stocks ranked at 85 or higher for the newspaper's key proprietary Earnings Per Share (EPS) and Relative Strength (RS) ratings.

|
 |
May Ended Positive But With a Burst Of Selling
Kenneth J. Gruneisen - Passed the CAN SLIM® Master's Exam
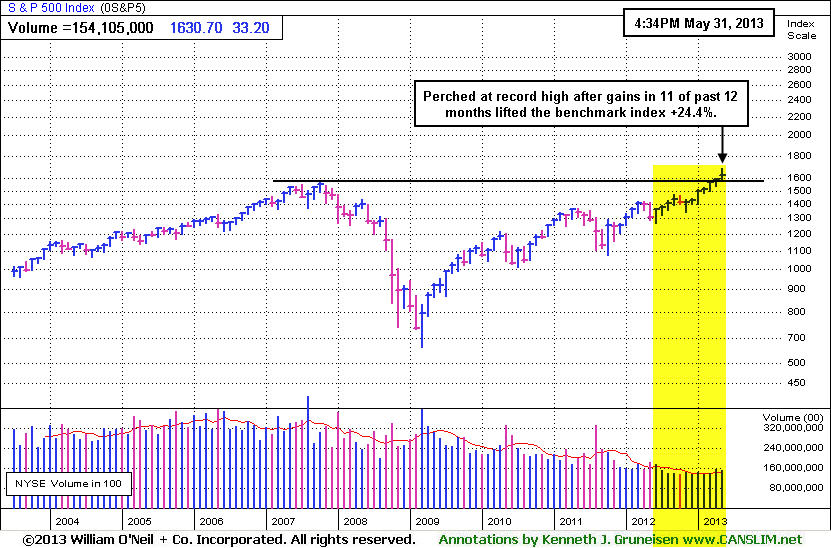
Despite Friday’s decline and unanimous losses for a 2nd consecutive week the three major averages finished higher in May. For the month, the Dow Jones Industrial Average was up +1.9%, the S&P 500 Index advanced +2.1% and the Nasdaq Composite Index climbed +3.8%. The indices ended Friday's choppy trading session firmly in negative territory after receiving mixed economic data. The volume totals were reported higher than the prior session totals on both major exchanges, a clear sign of distributional pressure due to profit taking. Breadth was very negative as decliners led advancers by a 5-1 margin on the NYSE and by nearly 3-1 on the Nasdaq exchange. There were 36 high-ranked companies from the CANSLIM.net Leaders List making new 52-week highs and appearing on the CANSLIM.net BreakOuts Page, down the prior session total of 44 stocks. New 52-week lows outnumbered new 52-week highs on the NYSE, meanwhile on the Nasdaq exchange new 52-week highs still solidly outnumbered new 52-week lows. There were gains for only 3 of the 12 high-ranked companies currently included on the Featured Stocks Page.
The major averages finished May on a down note. Before the open on Friday a report showed personal spending declined -0.2% in April. The market attempted to recover following reports including better-than-expected data on manufacturing and consumer sentiment. The Chicago Purchasing Managers Index activity in the Midwest expanded more than consensus projections. The final May reading on consumer sentiment by the University of Michigan also was revised to its highest level in almost six years.
All 10 sectors in the S&P 500 were lower led by declines in consumer staples and health care companies like Procter & Gamble Co (PG -2.95%) and Pfizer Inc (PFE -3.61%). Exxon Mobil Corp (XOM -1.76%) and energy-related shares fell as the price of oil fell. Dell Inc (DELL +0.64%) was a notable gainer after company set a date for a shareholder vote on the buyout offer by founder Michael Dell and Silver Lake Management.
Treasuries were lower on the session with the 10-year note down 5/32 to yield 2.13%.
The market (M criteria) uptrend clearly came under pressure as May drew to a close. More damaging losses can be a reminder for investors to be protective of any gains and limit losses by being especially watchful for any individual issues flashing technical sell signals. This is precisely how the fact-based investment system prompts investors to reduce exposure and preserve cash during market downdrafts.
As always, watch upcoming CANSLIM.net reports for new action-worthy leaders best matching the winning models to be covered as they emerge and then included on the Featured Stocks Page - with our Certified experts' latest notes and links to additional resources including detailed analysis with annotated graphs. The Premium Member Homepage - includes "dynamic archives" to all prior pay reports published. Watch for an announcement via email concerning the next WEBCAST.
PICTURED 2: The benchmark S&P 500 Index is perched at a record high and it has tallied gains in 11 of the past 12 months while rising +24.4%.
|
 Kenneth J. Gruneisen started out as a licensed stockbroker in August 1987, a couple of months prior to the historic stock market crash that took the Dow Jones Industrial Average down -22.6% in a single day. He has published daily fact-based fundamental and technical analysis on high-ranked stocks online for two decades. Through FACTBASEDINVESTING.COM, Kenneth provides educational articles, news, market commentary, and other information regarding proven investment systems that work in good times and bad.
Comments contained in the body of this report are technical opinions only and are not necessarily those of Gruneisen Growth Corp. The material herein has been obtained from sources believed to be reliable and accurate, however, its accuracy and completeness cannot be guaranteed. Our firm, employees, and customers may effect transactions, including transactions contrary to any recommendation herein, or have positions in the securities mentioned herein or options with respect thereto. Any recommendation contained in this report may not be suitable for all investors and it is not to be deemed an offer or solicitation on our part with respect to the purchase or sale of any securities. |
|
 |
Retail Index Showed Resilience as Defensive, Tech, and Financial Groups Fell
Kenneth J. Gruneisen - Passed the CAN SLIM® Master's Exam
Weakness in defensive groups included big losses for the Healthcare Index ($HMO -2.90%) and the Gold & Silver Index ($XAU -1.95%). Energy-related shares were weak as the Oil Services Index ($OSX -2.05%) and Integrated Oil Index ($XOI -1.93%) both lost ground. The influential financial indexes also created a drag on the major averages as the Bank Index ($BKX -1.66%) and the Broker/Dealer Index ($XBD -1.39%) both fell. The tech sector saw unanimous losses from the Biotechnology Index ($BTK -1.77%), Semiconductor Index ($SOX -1.22%), Internet Index ($IIX -0.81%), and the Networking Index ($NWX -0.55%). The Retail Index ($RLX -0.38%) held up better than most groups as it ended Friday's session with a small loss.
Charts courtesy www.stockcharts.com
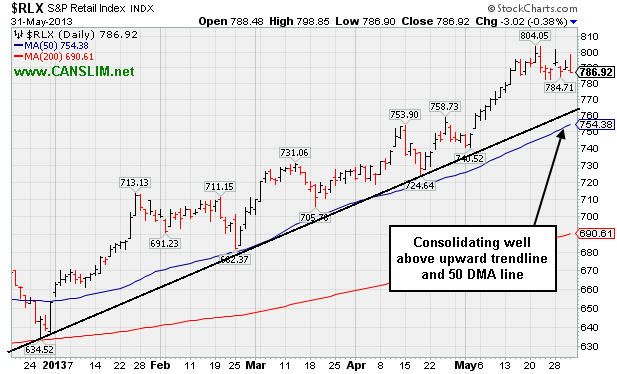
PICTURED: The Retail Index ($RLX -0.38%) is consolidating well above its 50-day moving average (DMA) line and an upward trendline connecting December - April lows.
| Oil Services |
$OSX |
253.70 |
-5.32 |
-2.05% |
+15.23% |
| Healthcare |
$HMO |
3,094.16 |
-92.55 |
-2.90% |
+23.07% |
| Integrated Oil |
$XOI |
1,384.56 |
-27.18 |
-1.93% |
+11.49% |
| Semiconductor |
$SOX |
468.63 |
-5.80 |
-1.22% |
+22.02% |
| Networking |
$NWX |
252.63 |
-1.39 |
-0.55% |
+11.51% |
| Internet |
$IIX |
380.69 |
-3.11 |
-0.81% |
+16.42% |
| Broker/Dealer |
$XBD |
123.65 |
-1.74 |
-1.39% |
+31.08% |
| Retail |
$RLX |
786.92 |
-3.02 |
-0.38% |
+20.50% |
| Gold & Silver |
$XAU |
107.36 |
-2.13 |
-1.95% |
-35.17% |
| Bank |
$BKX |
61.60 |
-1.04 |
-1.66% |
+20.12% |
| Biotech |
$BTK |
1,983.77 |
-35.83 |
-1.77% |
+28.23% |
|
|
|
 |
Institutional Accumulation Lifted This Leader
Kenneth J. Gruneisen - Passed the CAN SLIM® Master's Exam
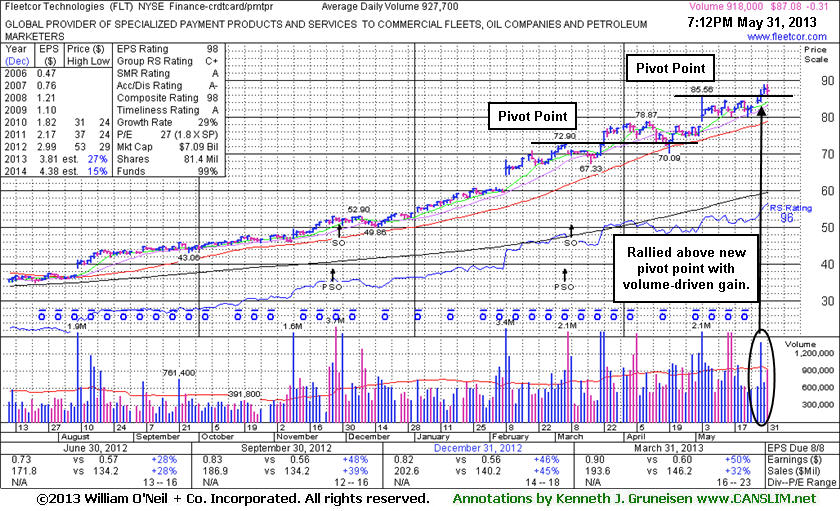
FleetCor Technologies, Inc. (FLT -$0.31 or -0.35% to $87.08) was noted in the mid-day report on 5/29/13 with a new pivot point cited based on its 5/03/13 high, and it rose from an advanced "3-weeks tight" base with a gain on the session backed by +56% above average volume. It may go on to produce more climactic gains, however this was a riskier "late-stage" base. Its 50-day moving average (DMA) line defines support where a violation would raise concerns and trigger a technical sell signal.
FLT currently has a 6-week winning streak going, and it was last shown in this FSU section on 5/08/13 with an annotated graph under the headline, "5th Consecutive Gain And Best Ever Finish". It reported earnings +50% on +32% sales for the Mar '13 quarter, marking its 5th consecutive quarterly comparison with earnings above the +25% guideline (C criteria).
The company completed another Secondary Offering on 3/08/13 after a streak of volume-driven gains into new high territory. On 3/14/12, 6/11/12, and 11/29/12 it priced Secondary Offerings and it was previously noted, "Such offerings often are a short-term hindrance to upward price progress yet typically result in broader institutional ownership interest."
The number of top-rated funds owning its shares rose from 193 in Mar '12 to 360 in Mar '13, a reassuring sign concerning the I criteria. Its current Up/Down Volume Ratio of 1.7 is also an unbiased indication that its shares have been under accumulation over the past 50 days. The company hails from the Finance - Credit Card Payment Processing group which currently has a mediocre 52 Group Relative Strength Rating, however impressive strength and leadership from a couple of other firms in the same industry group is considered sufficient reassurance concerning the L criteria.
|
|
|
Color Codes Explained :
Y - Better candidates highlighted by our
staff of experts.
G - Previously featured
in past reports as yellow but may no longer be buyable under the
guidelines.
***Last / Change / Volume data in this table is the closing quote data***
Symbol/Exchange
Company Name
Industry Group |
PRICE |
CHANGE
(%Change) |
Day High |
Volume
(% DAV)
(% 50 day avg vol) |
52 Wk Hi
% From Hi |
Featured
Date |
Price
Featured |
Pivot Featured |
|
Max Buy |
AL
-
NYSE
Air Lease Corp Cl A
DIVERSIFIED SERVICES - Rental and Leasing Services
|
$28.00
|
+0.54
1.97% |
$28.54
|
3,867,389
839.82% of 50 DAV
50 DAV is 460,500
|
$31.00
-9.68%
|
5/9/2013
|
$30.95
|
PP = $29.38
|
|
MB = $30.85
|
 Most Recent Note - 5/31/2013 12:14:02 PM
G - Rebounding toward its 50 DMA line after pricing a Secondary Offering. It violated important support at its 50 DMA line with volume-driven losses raising concerns and triggering technical sell signals this week, and only a prompt rebound above its 50 DMA would help its outlook improve.
>>> The latest Featured Stock Update with an annotated graph appeared on 5/30/2013. Click here.
View all notes |
Alert me of new notes |
CANSLIM.net Company Profile |
SEC |
Zacks Reports |
StockTalk |
News |
Chart |
Request a new note
C
A N
S L
I M


|
AMBA
-
NASDAQ
Ambarella Inc
ELECTRONICS - Semiconductor - Specialized
|
$16.17
|
+0.00
0.00% |
$16.50
|
785,638
99.30% of 50 DAV
50 DAV is 791,200
|
$17.90
-9.66%
|
5/6/2013
|
$15.31
|
PP = $16.10
|
|
MB = $16.91
|
Most Recent Note - 5/29/2013 7:46:21 PM
Y - Rebounded further above its pivot point with average volume behind its solid gain today. See the latest FSU analysis for more details and a new annotated graph.
>>> The latest Featured Stock Update with an annotated graph appeared on 5/29/2013. Click here.
View all notes |
Alert me of new notes |
CANSLIM.net Company Profile |
SEC |
Zacks Reports |
StockTalk |
News |
Chart |
Request a new note
C
A N
S L
I M
|
CELG
-
NASDAQ
Celgene Corp
DRUGS - Drug Manufacturers - Major
|
$123.65
|
-0.90
-0.72% |
$127.24
|
5,239,771
174.05% of 50 DAV
50 DAV is 3,010,500
|
$131.82
-6.20%
|
3/27/2013
|
$113.24
|
PP = $115.54
|
|
MB = $121.32
|
Most Recent Note - 5/31/2013 7:09:54 PM
G - Loss today on above average volume after a "negative reversal", encountering more worrisome distributional pressure. A violation of its 50 DMA line (now $120.78) would raise concerns and trigger a technical sell signal. It is extended from any sound base pattern, yet may go on to produce more climactic gains.
>>> The latest Featured Stock Update with an annotated graph appeared on 5/13/2013. Click here.
View all notes |
Alert me of new notes |
CANSLIM.net Company Profile |
SEC |
Zacks Reports |
StockTalk |
News |
Chart |
Request a new note
C
A N
S L
I M
|
EQM
-
NYSE
E Q T Midstream Partners
ENERGY - Oil and Gas Pipelines
|
$48.75
|
-0.85
-1.71% |
$49.92
|
67,670
66.54% of 50 DAV
50 DAV is 101,700
|
$51.72
-5.74%
|
4/25/2013
|
$40.16
|
PP = $40.84
|
|
MB = $42.88
|
Most Recent Note - 5/29/2013 12:20:32 PM
G - Churning above average volume today while retreating after a "negative reversal" on the prior session broke a streak of 8 consecutive small gains. It is extended from its latest base and well above its 50 DMA line defining important near-term chart support.
>>> The latest Featured Stock Update with an annotated graph appeared on 5/16/2013. Click here.
View all notes |
Alert me of new notes |
CANSLIM.net Company Profile |
SEC |
Zacks Reports |
StockTalk |
News |
Chart |
Request a new note
C
A N
S L
I M
|
FLT
-
NYSE
Fleetcor Technologies
DIVERSIFIED SERVICES - Business/Management Services
|
$87.08
|
-0.31
-0.35% |
$88.80
|
925,976
99.81% of 50 DAV
50 DAV is 927,700
|
$88.83
-1.97%
|
5/29/2013
|
$86.02
|
PP = $85.66
|
|
MB = $89.94
|
Most Recent Note - 5/31/2013 7:33:26 PM
Y- Was last noted in the mid-day report on 5/29/13 with a new pivot point cited based on its 5/03/13 high, and it rose from an advanced "3-weeks tight" base with a gain on the session backed by +56% above average volume. It may go on to produce more climactic gains, however this was a riskier "late-stage" base. See the latest FSU analysis for more details and a new annotated graph.
>>> The latest Featured Stock Update with an annotated graph appeared on 5/31/2013. Click here.
View all notes |
Alert me of new notes |
CANSLIM.net Company Profile |
SEC |
Zacks Reports |
StockTalk |
News |
Chart |
Request a new note
C
A N
S L
I M
|
Symbol/Exchange
Company Name
Industry Group |
PRICE |
CHANGE
(%Change) |
Day High |
Volume
(% DAV)
(% 50 day avg vol) |
52 Wk Hi
% From Hi |
Featured
Date |
Price
Featured |
Pivot Featured |
|
Max Buy |
LOPE
-
NASDAQ
Grand Canyon Education
DIVERSIFIED SERVICES - Education and; Training Services
|
$32.12
|
-0.59
-1.80% |
$33.01
|
203,905
50.76% of 50 DAV
50 DAV is 401,700
|
$34.07
-5.72%
|
5/10/2013
|
$29.03
|
PP = $27.28
|
|
MB = $28.64
|
Most Recent Note - 5/28/2013 5:50:07 PM
G - Perched at its 52-week high, very extended from its previous base. Prior highs in the $27 area define support to watch on pullbacks. Gains of greater than +20% in the first 2-3 weeks following its "breakaway gap" suggest holding for a minimum of 8 week under the fact-based investment system's rules.
>>> The latest Featured Stock Update with an annotated graph appeared on 5/10/2013. Click here.
View all notes |
Alert me of new notes |
CANSLIM.net Company Profile |
SEC |
Zacks Reports |
StockTalk |
News |
Chart |
Request a new note
C
A N
S L
I M
|
MRLN
-
NASDAQ
Marlin Business Services
DIVERSIFIED SERVICES - Rental and Leasing Services
|
$23.38
|
-0.52
-2.18% |
$23.75
|
6,297
27.03% of 50 DAV
50 DAV is 23,300
|
$25.97
-9.97%
|
3/15/2013
|
$22.29
|
PP = $23.18
|
|
MB = $24.34
|
Most Recent Note - 5/31/2013 7:08:03 PM
Y - Trading near its 50 DMA line after a loss on light volume. The recent low ($21.49 on 5/23/13) defines important near-term support below that short-term average where a violation would raise more serious concerns.
>>> The latest Featured Stock Update with an annotated graph appeared on 5/23/2013. Click here.
View all notes |
Alert me of new notes |
CANSLIM.net Company Profile |
SEC |
Zacks Reports |
StockTalk |
News |
Chart |
Request a new note
C
A N
S L
I M
|
NSM
-
NYSE
Nationstar Mtg Hldgs Inc
FINANCIAL SERVICES - Credit Services
|
$40.71
|
-1.56
-3.69% |
$42.26
|
1,459,633
115.34% of 50 DAV
50 DAV is 1,265,500
|
$46.91
-13.22%
|
5/7/2013
|
$39.71
|
PP = $42.34
|
|
MB = $44.46
|
Most Recent Note - 5/31/2013 7:03:22 PM
Y - Volume was higher and slightly above average behind yet another loss adding to its spurt of damaging losses marked by above average volume. Weak action has negated its prior breakout and raised concerns. Disciplined investors always limit losses if any stock falls more than -7% from their purchase price.
>>> The latest Featured Stock Update with an annotated graph appeared on 5/28/2013. Click here.
View all notes |
Alert me of new notes |
CANSLIM.net Company Profile |
SEC |
Zacks Reports |
StockTalk |
News |
Chart |
Request a new note
C
A N
S L
I M
|
PRAA
-
NASDAQ
Portfolio Recovery Assoc
DIVERSIFIED SERVICES - Business/Management Services
|
$152.27
|
+0.26
0.17% |
$153.65
|
56,004
82.97% of 50 DAV
50 DAV is 67,500
|
$153.85
-1.03%
|
5/1/2013
|
$130.77
|
PP = $127.88
|
|
MB = $134.27
|
Most Recent Note - 5/30/2013 4:55:19 PM
G - Edged higher with below average volume today for a 4th consecutive gain and its best-ever close. Very extended from prior highs in the $127 area and well above its 50 DMA line defining important chart support.
>>> The latest Featured Stock Update with an annotated graph appeared on 5/22/2013. Click here.
View all notes |
Alert me of new notes |
CANSLIM.net Company Profile |
SEC |
Zacks Reports |
StockTalk |
News |
Chart |
Request a new note
C
A N
S L
I M
|
PRLB
-
NYSE
Proto Labs Inc
MANUFACTURING - Small Tools and Accessories
|
$55.24
|
-0.17
-0.31% |
$56.24
|
282,850
50.82% of 50 DAV
50 DAV is 556,600
|
$59.84
-7.69%
|
5/3/2013
|
$54.77
|
PP = $54.01
|
|
MB = $56.71
|
Most Recent Note - 5/30/2013 4:57:28 PM
Y - Finished near its session high with a gain today on light volume, rebounding above its pivot point. Stayed well above its 50 DMA line after slumping back into its prior base.
>>> The latest Featured Stock Update with an annotated graph appeared on 5/24/2013. Click here.
View all notes |
Alert me of new notes |
CANSLIM.net Company Profile |
SEC |
Zacks Reports |
StockTalk |
News |
Chart |
Request a new note
C
A N
S L
I M
|
Symbol/Exchange
Company Name
Industry Group |
PRICE |
CHANGE
(%Change) |
Day High |
Volume
(% DAV)
(% 50 day avg vol) |
52 Wk Hi
% From Hi |
Featured
Date |
Price
Featured |
Pivot Featured |
|
Max Buy |
RRTS
-
NYSE
Roadrunner Trans Systems
TRANSPORTATION - Air Delivery and Freight Service
|
$27.70
|
-0.07
-0.25% |
$27.95
|
143,348
69.96% of 50 DAV
50 DAV is 204,900
|
$28.00
-1.07%
|
4/3/2013
|
$22.77
|
PP = $23.75
|
|
MB = $24.94
|
Most Recent Note - 5/28/2013 5:45:55 PM
G - Today's 4th consecutive gain while led to a best-ever close, getting more extended from its latest base. Prior highs in the $23 area define initial support to watch above its 50 DMA line. Fundamental concerns were raised by its sub par earnings increase in the Mar '13 quarter, below the +25% minimum guideline (C criteria).
>>> The latest Featured Stock Update with an annotated graph appeared on 5/14/2013. Click here.
View all notes |
Alert me of new notes |
CANSLIM.net Company Profile |
SEC |
Zacks Reports |
StockTalk |
News |
Chart |
Request a new note
C
A N
S L
I M
|
VRX
-
NYSE
Valeant Pharmaceuticals
DRUGS - Drug Manufacturers - Other
|
$91.12
|
+0.12
0.13% |
$92.58
|
1,825,065
99.23% of 50 DAV
50 DAV is 1,839,300
|
$96.25
-5.33%
|
4/30/2013
|
$60.24
|
PP = $76.66
|
|
MB = $80.49
|
Most Recent Note - 5/29/2013 1:03:56 PM
G- Perched at its all-time high following 2 consecutive volume-driven gains, extended from prior highs. Announced plans to buy Bausch & Lomb for $8.7 billion. Prior reports cautioned - "Sub par earnings for the Mar '13 quarter below the +25% minimum guideline (C criteria) raised fundamental concerns."
>>> The latest Featured Stock Update with an annotated graph appeared on 5/17/2013. Click here.
View all notes |
Alert me of new notes |
CANSLIM.net Company Profile |
SEC |
Zacks Reports |
StockTalk |
News |
Chart |
Request a new note
C
A N
S L
I M
|
|
|
|
THESE ARE NOT BUY RECOMMENDATIONS!
Comments contained in the body of this report are technical
opinions only. The material herein has been obtained
from sources believed to be reliable and accurate, however,
its accuracy and completeness cannot be guaranteed.
This site is not an investment advisor, hence it does
not endorse or recommend any securities or other investments.
Any recommendation contained in this report may not
be suitable for all investors and it is not to be deemed
an offer or solicitation on our part with respect to
the purchase or sale of any securities. All trademarks,
service marks and trade names appearing in this report
are the property of their respective owners, and are
likewise used for identification purposes only.
This report is a service available
only to active Paid Premium Members.
You may opt-out of receiving report notifications
at any time. Questions or comments may be submitted
by writing to Premium Membership Services 665 S.E. 10 Street, Suite 201 Deerfield Beach, FL 33441-5634 or by calling 1-800-965-8307
or 954-785-1121.
|
|
|

