You are not logged in.
This means you
CAN ONLY VIEW reports that were published prior to Monday, April 14, 2025.
You
MUST UPGRADE YOUR MEMBERSHIP if you want to see any current reports.
AFTER MARKET UPDATE - THURSDAY, MAY 31ST, 2012
Previous After Market Report Next After Market Report >>>
|
|
|
|
DOW |
-26.41 |
12,393.45 |
-0.21% |
|
Volume |
1,327,665,290 |
+73% |
|
Volume |
2,070,815,210 |
+29% |
|
NASDAQ |
-10.02 |
2,827.34 |
-0.35% |
|
Advancers |
1,445 |
45% |
|
Advancers |
1,195 |
45% |
|
S&P 500 |
-2.99 |
1,310.33 |
-0.23% |
|
Decliners |
1,605 |
50% |
|
Decliners |
1,350 |
51% |
|
Russell 2000 |
-0.18 |
761.82 |
-0.02% |
|
52 Wk Highs |
46 |
|
|
52 Wk Highs |
27 |
|
|
S&P 600 |
-0.29 |
428.13 |
-0.07% |
|
52 Wk Lows |
125 |
|
|
52 Wk Lows |
88 |
|
|
Be sure to check out the "Ken's Mailbag Q&A" included below the Featured Stock Update summary table today.
|
 |
Indices Finish Up From Session Lows But Still Lack Strength
Kenneth J. Gruneisen - Passed the CAN SLIM® Master's Exam
The indices finished well off of the day's lows, however Thursday's session brought unanimous losses again for the Dow Jones Industrial Average, S&P 500 Index, and the Nasdaq Composite Index. The losses on "Day 8" were not large enough to end the current rally attempt, but they were the opposite of the confirming gains disciplined investors are still awaiting. Volume was reported higher than the prior session totals on the Nasdaq exchange and on the NYSE. Breadth was slightly negative as decliners narrowly led advancers on the NYSE and on the Nasdaq exchange. New 52-week lows outnumbered new 52-week highs on the NYSE and on the Nasdaq exchange. There were 15 high-ranked companies from the CANSLIM.net Leaders List that made new 52-week highs and appeared on the CANSLIM.net BreakOuts Page, up from the prior session total of 11 stocks. Investors watching for a follow-through day in the days and weeks ahead should be aware that an expansion in the number of stocks hitting new 52-week highs is an important component to any new confirmed rally. There were gains for 6 of the 19 high-ranked companies currently included on the Featured Stocks Page.
The major averages were down for a second day amid disappointment over the latest economic data. Before the open, the ADP private payroll report came below projections while filings for first time unemployment benefits increased to one month high. The market declined after first-quarter GDP was revised down to 1.9%, its slowest pace in two years.
Energy stocks were leading the market lower. Shares of Schlumberger Ltd (SLB -1.45%) fell as oil retreated on data that showed inventories rose to a 22-year high. The industrials also weighed on the market. Joy Global Inc (JOYG -5.12%) lost ground after the mining equipment maker reduced forecasts. Shares of The TJX Companies Inc (TJX +2.73%), parent of T.J. Maxx and Marshall's, gained after it reported better-than-expected same store sales in May.
European markets ended the session lower. The FTSE was down -0.3% in London and the DAX lost -0.8% in Germany. In bondland, Treasury prices were higher, pushing 5-, 7- and 10-year yields to new record lows with the benchmark note up 13/32 to yield 1.58%
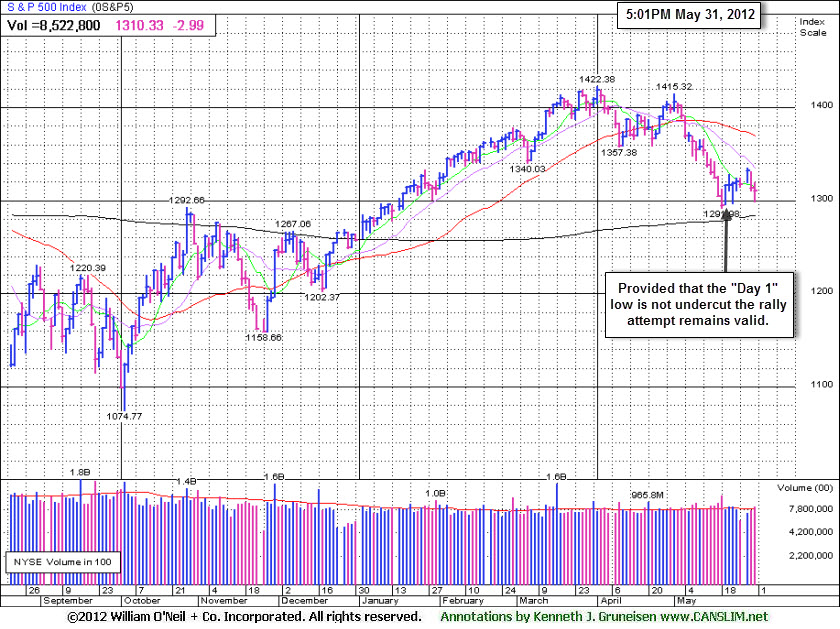
Historical studies suggest that the most constructive market rallies produced a solid follow-through day (FTD) between Days 4-7 of a new rally effort. That did not happen, yet provided the "Day 1" lows for the Nasdaq Composite Index (2,774.76) and S&P 500 Index (1,295.73) are not undercut the current rally attempt remains valid and the window is still open for a new confirmed rally to present itself. Such technical proof may give fact-based investors the clearance to begin with new buying efforts only in sound candidates. Meanwhile, investors should keep up a watchlist of worthy buy candidates while remaining protective of capital. The major averages (M criteria) are technically still considered to be in a "correction" and stocks remain vulnerable to much greater downside.
PICTURED: The S&P 500 Index finished the session near the middle of its intra-day range. Thus far it has narrowly avoided undercutting the May 21 (Day 1) lows which would end the current rally attempt. A follow-through day (FTD) of additional confirming gains of +1.4% or greater by either the Nasdaq Composite Index or the S&P 500 Index backed by higher volume and coupled with an expansion in the number of stocks hitting new highs may "confirm" a new rally. Meanwhile, the Dow Jones Industrial Average's ongoing weakness leaves it in need of a new "Day 1" gain.
|
 Kenneth J. Gruneisen started out as a licensed stockbroker in August 1987, a couple of months prior to the historic stock market crash that took the Dow Jones Industrial Average down -22.6% in a single day. He has published daily fact-based fundamental and technical analysis on high-ranked stocks online for two decades. Through FACTBASEDINVESTING.COM, Kenneth provides educational articles, news, market commentary, and other information regarding proven investment systems that work in good times and bad.
Comments contained in the body of this report are technical opinions only and are not necessarily those of Gruneisen Growth Corp. The material herein has been obtained from sources believed to be reliable and accurate, however, its accuracy and completeness cannot be guaranteed. Our firm, employees, and customers may effect transactions, including transactions contrary to any recommendation herein, or have positions in the securities mentioned herein or options with respect thereto. Any recommendation contained in this report may not be suitable for all investors and it is not to be deemed an offer or solicitation on our part with respect to the purchase or sale of any securities. |
|
 |
Financial Shares Bucked Broader Weakness
Kenneth J. Gruneisen - Passed the CAN SLIM® Master's Exam
Financial shares were a bright spot as the Broker/Dealer Index ($XBD +0.32%) and Bank Index ($BKX +1.05%) bucked broader losses and posted small gains. Weakness in energy-related shares pushed the Oil Services Index ($OSX -1.65%) and Integrated Oil Index ($XOI -0.70%) lower again. The Gold & Silver Index ($XAU -1.00%) lost ground, and medical-related shares were weak as the Biotechnology Index ($BTK -1.52%) and Healthcare Index ($HMO -1.15%) suffered losses. The Retail Index ($RLX -0.37%) ended modestly lower and the Semiconductor Index ($SOX -1.03%) led the tech sector lower while the Internet Index ($IIX -0.15%) and the Networking Index ($NWX -0.00%) ended nearly unchanged.
Charts courtesy www.stockcharts.com
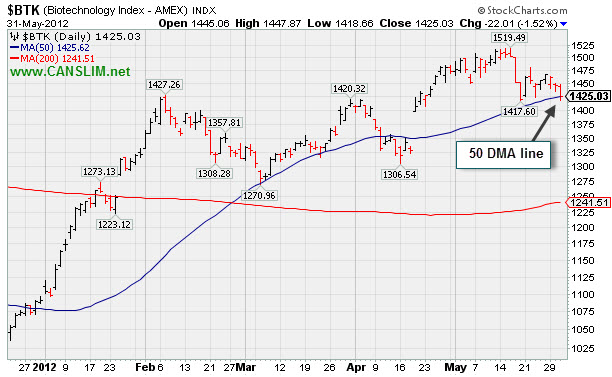
PICTURED: The Biotechnology Index ($BTK -1.52%) is consolidating near its 50-day moving average (DMA) line.
| Oil Services |
$OSX |
200.75 |
-3.37 |
-1.65% |
-7.18% |
| Healthcare |
$HMO |
2,288.21 |
-26.51 |
-1.15% |
+0.29% |
| Integrated Oil |
$XOI |
1,092.64 |
-7.65 |
-0.70% |
-11.10% |
| Semiconductor |
$SOX |
368.37 |
-3.83 |
-1.03% |
+1.08% |
| Networking |
$NWX |
206.34 |
-0.01 |
-0.00% |
-4.10% |
| Internet |
$IIX |
293.28 |
-0.43 |
-0.15% |
+4.10% |
| Broker/Dealer |
$XBD |
86.03 |
+0.27 |
+0.32% |
+3.31% |
| Retail |
$RLX |
601.44 |
-2.22 |
-0.37% |
+14.95% |
| Gold & Silver |
$XAU |
153.80 |
-1.56 |
-1.00% |
-14.86% |
| Bank |
$BKX |
44.08 |
+0.46 |
+1.05% |
+11.93% |
| Biotech |
$BTK |
1,425.03 |
-22.01 |
-1.52% |
+30.57% |
|
|
|
 |
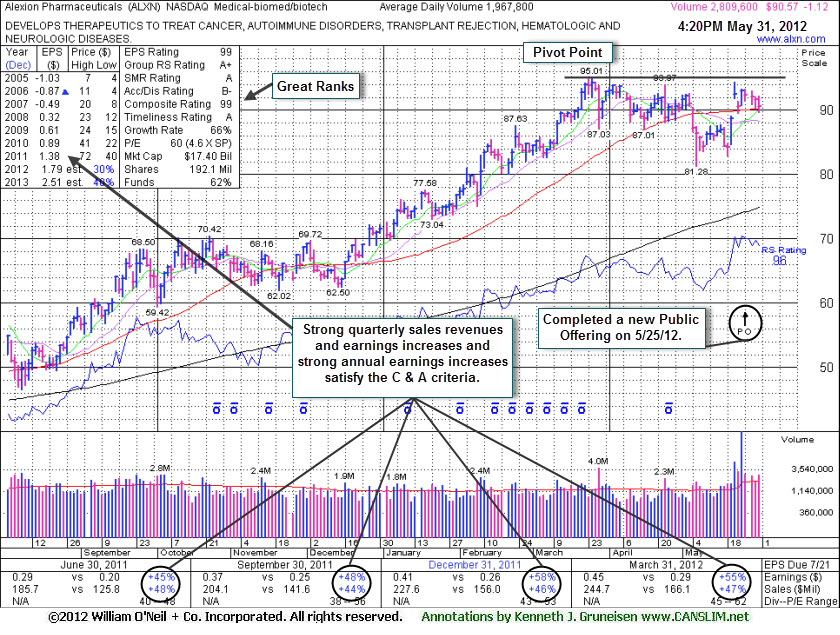
Perched Near All-Time High Following Recent Share Offering
Kenneth J. Gruneisen - Passed the CAN SLIM® Master's Exam
Alexion Pharmaceuticals (ALXN -$1.12 or -1.22% to $90.57) completed a new Public Offering on 5/25/12 and it is consolidating above its 50--day moving average (DMA) line perched within -4.7% of its 52-week high. Its faces little resistance in the $94-95 area. Volume-driven gains to new highs may trigger a new technical buy signal. Without fresh signs of heavier buying demand most disciplined investors would remain cautious. The M criteria remains an overriding concern until a confirmed rally with follow-through day from at least one of the major averages.
ALXN was last shown in this FSU section with an annotated graph on 4/16/12 under the headline, "Support at 50-Day Average Also Near Last Pivot Point Cited". Subsequent losses on higher volume were a sign of distributional pressure as it violated important support at its 50 DMA line raising concerns and triggering a technical sell signal. It had traded as high as $95.01, or +56% above its pivot point cited back when first featured in yellow on September 15, 2011.
The Medical - Biomed/Biotech industry group has demonstrated leadership and earned the best possible rank, 99, for its Group Relative Strength Rating, a reassuring sign concerning the L criteria. ALXN's Relative Strength Rank (96) remains high. It easily satisfies the C and A criteria with a very strong quarterly and annual earnings history which has earned it a highest possible 99 Earnings Per Share rank. The number of top-rated funds owning its shares rose from 842 in Mar '11 to 1,072 in Mar '12, a reassuring sign concerning the I criteria of the fact-based investment system. With the help of underwriters, its latest Public Offering may very likely have helped it attract additional ownership interest from the institutional crowd.
|
|
|
Color Codes Explained :
Y - Better candidates highlighted by our
staff of experts.
G - Previously featured
in past reports as yellow but may no longer be buyable under the
guidelines.
***Last / Change / Volume data in this table is the closing quote data***
Symbol/Exchange
Company Name
Industry Group |
PRICE |
CHANGE
(%Change) |
Day High |
Volume
(% DAV)
(% 50 day avg vol) |
52 Wk Hi
% From Hi |
Featured
Date |
Price
Featured |
Pivot Featured |
|
Max Buy |
ACN
-
NYSE
Accenture Plc
DIVERSIFIED SERVICES - Business/Management Services
|
$57.10
|
-0.62
-1.07% |
$57.94
|
5,113,028
137.60% of 50 DAV
50 DAV is 3,715,900
|
$65.89
-13.34%
|
3/23/2012
|
$64.13
|
PP = $63.76
|
|
MB = $66.95
|
 Most Recent Note - 5/31/2012 4:14:55 PM
Loss today led to a close below its longer-term 200 DMA line. Previously triggered technical sell signals when undercutting prior highs in the $62-63 area and violating its 50 DMA line. Based on weak action it will be dropped from the Featured Stocks list tonight.
>>> The latest Featured Stock Update with an annotated graph appeared on 5/22/2012. Click here.
View all notes |
Alert me of new notes |
CANSLIM.net Company Profile |
SEC |
Zacks Reports |
StockTalk |
News |
Chart |
Request a new note
C
A N
S L
I M


|
ALXN
-
NASDAQ
Alexion Pharmaceuticals
DRUGS - Drug Manufacturers - Other
|
$90.57
|
-1.12
-1.22% |
$92.21
|
4,852,680
246.60% of 50 DAV
50 DAV is 1,967,800
|
$95.01
-4.67%
|
5/1/2012
|
$91.73
|
PP = $95.11
|
|
MB = $99.87
|
Most Recent Note - 5/31/2012 5:38:14 PM
Y - Volume-driven gains to new highs may trigger a technical buy signal. Faces little resistance in the $94-95 area. The M criteria remains an overriding concern until a confirmed rally with follow-through day from at least one of the major averages. See the latest FSU analysis for more details and a new annotated graph.
>>> The latest Featured Stock Update with an annotated graph appeared on 5/31/2012. Click here.
View all notes |
Alert me of new notes |
CANSLIM.net Company Profile |
SEC |
Zacks Reports |
StockTalk |
News |
Chart |
Request a new note
C
A N
S L
I M
|
ARBA
-
NASDAQ
Accenture Plc
INTERNET - Internet Software and Services
|
$44.93
|
-0.03
-0.07% |
$45.00
|
4,022,749
108.26% of 50 DAV
50 DAV is 3,715,900
|
$45.48
-1.21%
|
4/27/2012
|
$38.53
|
PP = $37.24
|
|
MB = $39.10
|
Most Recent Note - 5/29/2012 4:33:06 PM
G - Still holding its ground since tallying a considerable gain on 5/22/12 with heavy volume on news it will be bought by SAP in a $4.3 billion deal. The stock quickly got extended from its prior base after a quiet consolidation above chart support at its 50 DMA line and prior highs.
>>> The latest Featured Stock Update with an annotated graph appeared on 4/30/2012. Click here.
View all notes |
Alert me of new notes |
CANSLIM.net Company Profile |
SEC |
Zacks Reports |
StockTalk |
News |
Chart |
Request a new note
C
A N
S L
I M
|
CERN
-
NASDAQ
Cerner Corp
COMPUTER SOFTWARE and SERVICES - Healthcare Information Service
|
$77.96
|
-1.74
-2.18% |
$79.54
|
1,547,714
129.68% of 50 DAV
50 DAV is 1,193,500
|
$84.10
-7.30%
|
4/27/2012
|
$77.23
|
PP = $78.63
|
|
MB = $82.56
|
Most Recent Note - 5/31/2012 4:11:52 PM
Y - Slumped back toward its 50 DMA line with a loss on higher volume indicative of more distributional pressure today. Negated its recent technical breakout. Still trading only -7.3% off its 52-week high.
>>> The latest Featured Stock Update with an annotated graph appeared on 5/1/2012. Click here.
View all notes |
Alert me of new notes |
CANSLIM.net Company Profile |
SEC |
Zacks Reports |
StockTalk |
News |
Chart |
Request a new note
C
A N
S L
I M
|
CMCSA
-
NASDAQ
Comcast Corp Cl A
MEDIA - CATV Systems
|
$28.91
|
-0.04
-0.14% |
$29.18
|
13,202,973
105.79% of 50 DAV
50 DAV is 12,480,500
|
$30.88
-6.36%
|
5/2/2012
|
$30.04
|
PP = $30.51
|
|
MB = $32.04
|
Most Recent Note - 5/29/2012 4:38:39 PM
G - Gains have lacked volume conviction since slumping under its 50 DMA line and undercutting the prior low ($28.54 on 4/10/12). A rebound above its short-term average would help its technical stance and near-term outlook improve.
>>> The latest Featured Stock Update with an annotated graph appeared on 5/7/2012. Click here.
View all notes |
Alert me of new notes |
CANSLIM.net Company Profile |
SEC |
Zacks Reports |
StockTalk |
News |
Chart |
Request a new note
C
A N
S L
I M
|
Symbol/Exchange
Company Name
Industry Group |
PRICE |
CHANGE
(%Change) |
Day High |
Volume
(% DAV)
(% 50 day avg vol) |
52 Wk Hi
% From Hi |
Featured
Date |
Price
Featured |
Pivot Featured |
|
Max Buy |
COO
-
NYSE
Cooper Companies Inc
HEALTH SERVICES - Medical Instruments and Supplies
|
$85.18
|
-0.15
-0.18% |
$85.46
|
902,431
219.68% of 50 DAV
50 DAV is 410,800
|
$89.31
-4.62%
|
3/9/2012
|
$83.05
|
PP = $81.02
|
|
MB = $85.07
|
Most Recent Note - 5/31/2012 12:01:06 PM
G - Consolidating above prior highs in the $83-84 area and testing its 50 DMA line this week, an important near-term support level. A damaging violation may trigger a worrisome technical sell signal.
>>> The latest Featured Stock Update with an annotated graph appeared on 5/18/2012. Click here.
View all notes |
Alert me of new notes |
CANSLIM.net Company Profile |
SEC |
Zacks Reports |
StockTalk |
News |
Chart |
Request a new note
C
A N
S L
I M
|
DG
-
NYSE
Dollar General Corp
RETAIL - Discount, Variety Stores
|
$48.91
|
+0.35
0.72% |
$49.50
|
4,608,359
166.84% of 50 DAV
50 DAV is 2,762,200
|
$48.76
0.31%
|
5/7/2012
|
$48.51
|
PP = $47.69
|
|
MB = $50.07
|
Most Recent Note - 5/31/2012 12:10:54 PM
Y - Inching to new 52-week and all-time highs with today's 3rd consecutive gain and no resistance remains due to overhead supply. Its color code was changed to yellow based on recent resilience, and it is approaching its "max buy" level. The broader market (M criteria) has yet to confirm a new rally, however, and without a solid follow-through day from at least one of the major averages all new buying efforts are discouraged under the fact-based investment system.
>>> The latest Featured Stock Update with an annotated graph appeared on 5/9/2012. Click here.
View all notes |
Alert me of new notes |
CANSLIM.net Company Profile |
SEC |
Zacks Reports |
StockTalk |
News |
Chart |
Request a new note
C
A N
S L
I M
|
EXPE
-
NASDAQ
Expedia Inc
INTERNET - Internet Information Providers
|
$45.89
|
+0.43
0.95% |
$46.49
|
5,882,362
129.67% of 50 DAV
50 DAV is 4,536,400
|
$46.34
-0.97%
|
4/27/2012
|
$41.80
|
PP = $35.57
|
|
MB = $37.35
|
Most Recent Note - 5/29/2012 4:46:07 PM
G - Held its ground near its 52-week high today. As previously noted, heavy volume behind a considerable gain on 5/23/12 technically helped it break out from an advanced "3-weeks tight" base with no resistance remaining due to overhead supply, however no new pivot point was cited. Until the market confirms a new rally with a solid follow through day from at least one of the major averages (M criteria) the fact-based investment system argues against new buying efforts in any stocks.
>>> The latest Featured Stock Update with an annotated graph appeared on 5/3/2012. Click here.
View all notes |
Alert me of new notes |
CANSLIM.net Company Profile |
SEC |
Zacks Reports |
StockTalk |
News |
Chart |
Request a new note
C
A N
S L
I M
|
GNC
-
NYSE
G N C Holdings Inc
RETAIL - Drug Stores
|
$38.53
|
-0.38
-0.98% |
$39.08
|
1,431,267
76.88% of 50 DAV
50 DAV is 1,861,600
|
$41.95
-8.15%
|
1/19/2012
|
$28.99
|
PP = $29.60
|
|
MB = $31.08
|
Most Recent Note - 5/29/2012 4:47:20 PM
G - Hovering within close striking distance of its 52-week high today. Found support near prior highs and its 50 DMA line while recently consolidating. Reported earnings +82% on +23% sales revenues for the quarter ended March 31, 2012 versus the year ago period.
>>> The latest Featured Stock Update with an annotated graph appeared on 4/26/2012. Click here.
View all notes |
Alert me of new notes |
CANSLIM.net Company Profile |
SEC |
Zacks Reports |
StockTalk |
News |
Chart |
Request a new note
C
A N
S L
I M
|
NTES
-
NASDAQ
Netease Inc Adr
INTERNET - Internet Information Providers
|
$62.36
|
+0.94
1.53% |
$62.73
|
1,130,142
153.12% of 50 DAV
50 DAV is 738,100
|
$63.07
-1.13%
|
3/19/2012
|
$56.18
|
PP = $55.10
|
|
MB = $57.86
|
Most Recent Note - 5/31/2012 12:29:14 PM
G - Found support near its 50 DMA line and today's 3rd consecutive gain has it within close striking distance of it 52-week high, however it has not formed a sound base pattern. Recent lows near the $55 area define important chart support to watch where a violation may trigger a worrisome technical sell signal.
>>> The latest Featured Stock Update with an annotated graph appeared on 5/24/2012. Click here.
View all notes |
Alert me of new notes |
CANSLIM.net Company Profile |
SEC |
Zacks Reports |
StockTalk |
News |
Chart |
Request a new note
C
A N
S L
I M
|
Symbol/Exchange
Company Name
Industry Group |
PRICE |
CHANGE
(%Change) |
Day High |
Volume
(% DAV)
(% 50 day avg vol) |
52 Wk Hi
% From Hi |
Featured
Date |
Price
Featured |
Pivot Featured |
|
Max Buy |
SWI
-
NYSE
Solarwinds Inc
COMPUTER SOFTWARE and SERVICES - Application Software
|
$45.86
|
-0.42
-0.91% |
$46.50
|
1,144,536
100.80% of 50 DAV
50 DAV is 1,135,400
|
$48.64
-5.72%
|
4/26/2012
|
$45.15
|
PP = $42.32
|
|
MB = $44.44
|
Most Recent Note - 5/30/2012 2:03:41 PM
G - Small gap down today from a best-ever close and new all-time high hit on the prior session. It did not form a sound new base of sufficient length.
>>> The latest Featured Stock Update with an annotated graph appeared on 5/21/2012. Click here.
View all notes |
Alert me of new notes |
CANSLIM.net Company Profile |
SEC |
Zacks Reports |
StockTalk |
News |
Chart |
Request a new note
C
A N
S L
I M
|
SXCI
-
NASDAQ
S X C Health Solutions
COMPUTER SOFTWARE and SERVICES - Healthcare Information Service
|
$89.71
|
+0.97
1.09% |
$89.92
|
2,189,169
193.39% of 50 DAV
50 DAV is 1,132,000
|
$100.50
-10.74%
|
2/23/2012
|
$68.24
|
PP = $66.05
|
|
MB = $69.35
|
Most Recent Note - 5/30/2012 2:06:42 PM
G - Down today with higher volume (but still below average), consolidating above its recent lows and above its 50 DMA line ($84.71) defining important support to watch. Volume totals have been cooling while still holding its ground in a tight range. Completed a new Public Offering on 5/10/12. Consolidating in a tight range since it posted huge volume-driven gains on 4/18 and 4/19 while rallying on M&A news.
>>> The latest Featured Stock Update with an annotated graph appeared on 5/17/2012. Click here.
View all notes |
Alert me of new notes |
CANSLIM.net Company Profile |
SEC |
Zacks Reports |
StockTalk |
News |
Chart |
Request a new note
C
A N
S L
I M
|
TDG
-
NYSE
Transdigm Group Inc
AEROSPACE/DEFENSE - Aerospace/Defense Products and; Services
|
$123.00
|
-0.33
-0.27% |
$123.59
|
1,899,272
389.91% of 50 DAV
50 DAV is 487,100
|
$132.69
-7.30%
|
2/29/2012
|
$120.10
|
PP = $118.93
|
|
MB = $124.88
|
Most Recent Note - 5/30/2012 2:07:49 PM
G - Pulling back on lighter volume today following a gain on the prior session backed by above average volume. Recently found prompt support at its 50 DMA line and near prior highs.
>>> The latest Featured Stock Update with an annotated graph appeared on 5/23/2012. Click here.
View all notes |
Alert me of new notes |
CANSLIM.net Company Profile |
SEC |
Zacks Reports |
StockTalk |
News |
Chart |
Request a new note
C
A N
S L
I M
|
TNGO
-
NASDAQ
Tangoe Inc
COMPUTER SOFTWARE and SERVICES - Technical and System Software
|
$19.31
|
-0.73
-3.64% |
$20.34
|
2,158,758
323.41% of 50 DAV
50 DAV is 667,500
|
$23.05
-16.23%
|
3/27/2012
|
$19.35
|
PP = $20.00
|
|
MB = $21.00
|
Most Recent Note - 5/31/2012 2:06:55 PM
G - Volume is above average today as a 6th consecutive loss raises more concerns while slumping under prior highs in the $20 area and violating its 50 DMA line. The M criteria argues against new buying efforts in any stocks until a new rally is confirmed with a solid follow-through day by at least one of the major averages.
>>> The latest Featured Stock Update with an annotated graph appeared on 5/25/2012. Click here.
View all notes |
Alert me of new notes |
CANSLIM.net Company Profile |
SEC |
Zacks Reports |
StockTalk |
News |
Chart |
Request a new note
C
A N
S L
I M
|
TSCO
-
NASDAQ
Tractor Supply Co
SPECIALTY RETAIL - Specialty Retail, Other
|
$91.35
|
+1.83
2.04% |
$91.59
|
4,669,681
455.18% of 50 DAV
50 DAV is 1,025,900
|
$101.20
-9.73%
|
5/1/2012
|
$98.38
|
PP = $101.30
|
|
MB = $106.37
|
Most Recent Note - 5/30/2012 2:11:33 PM
G - Down again today with above average volume. On the prior session it violated its 50 DMA line, triggering a technical sell signal with a damaging loss with more than 4 times average volume. It did not trigger a new (or add-on) technical buy signal in recent weeks.
>>> The latest Featured Stock Update with an annotated graph appeared on 4/17/2012. Click here.
View all notes |
Alert me of new notes |
CANSLIM.net Company Profile |
SEC |
Zacks Reports |
StockTalk |
News |
Chart |
Request a new note
C
A N
S L
I M
|
Symbol/Exchange
Company Name
Industry Group |
PRICE |
CHANGE
(%Change) |
Day High |
Volume
(% DAV)
(% 50 day avg vol) |
52 Wk Hi
% From Hi |
Featured
Date |
Price
Featured |
Pivot Featured |
|
Max Buy |
UA
-
NYSE
Under Armour Inc Cl A
CONSUMER NON-DURABLES - Textile - Apparel Clothing
|
$100.73
|
+0.03
0.03% |
$100.96
|
630,973
68.60% of 50 DAV
50 DAV is 919,800
|
$102.86
-2.07%
|
2/15/2012
|
$85.77
|
PP = $84.86
|
|
MB = $89.10
|
Most Recent Note - 5/29/2012 4:56:55 PM
G - Today's 6th consecutive gain was backed by above average volume as it finished near its best-ever close. Concerns were recently raised by weaker fundamentals, its first quarterly earnings increase below the +25% minimum guideline in more than 2 years.
>>> The latest Featured Stock Update with an annotated graph appeared on 5/29/2012. Click here.
View all notes |
Alert me of new notes |
CANSLIM.net Company Profile |
SEC |
Zacks Reports |
StockTalk |
News |
Chart |
Request a new note
C
A N
S L
I M
|
V
-
NYSE
Visa Inc Cl A
DIVERSIFIED SERVICES - Business/Management Services
|
$115.20
|
-2.29
-1.95% |
$118.36
|
5,204,667
143.47% of 50 DAV
50 DAV is 3,627,700
|
$125.35
-8.10%
|
3/12/2012
|
$116.53
|
PP = $119.46
|
|
MB = $125.43
|
Most Recent Note - 5/30/2012 12:36:00 PM
G - Hovering near its 50 DMA line after volume-driven gains helped it rebound from recent lows. The prior low ($112.50 on 5/18/12) defines important near-term support below its 50 DMA where any subsequent violation may raise more serious concerns and trigger a more worrisome technical sell signal.
>>> The latest Featured Stock Update with an annotated graph appeared on 5/16/2012. Click here.
View all notes |
Alert me of new notes |
CANSLIM.net Company Profile |
SEC |
Zacks Reports |
StockTalk |
News |
Chart |
Request a new note
C
A N
S L
I M
|
VSI
-
NYSE
Vitamin Shoppe Inc
SPECIALTY RETAIL - Specialty Retail, Other
|
$49.52
|
-0.14
-0.28% |
$50.26
|
160,827
34.73% of 50 DAV
50 DAV is 463,100
|
$55.29
-10.44%
|
4/25/2012
|
$47.77
|
PP = $48.46
|
|
MB = $50.88
|
Most Recent Note - 5/29/2012 4:59:08 PM
G - Recent gains have been backed by lighter than average volume as it found some support near its old highs and halted a streak of 5 consecutive losses since a negative reversal at its 52-week high.
>>> The latest Featured Stock Update with an annotated graph appeared on 4/25/2012. Click here.
View all notes |
Alert me of new notes |
CANSLIM.net Company Profile |
SEC |
Zacks Reports |
StockTalk |
News |
Chart |
Request a new note
C
A N
S L
I M
|
WFM
-
NASDAQ
Whole Foods Market Inc
RETAIL - Grocery Stores
|
$88.61
|
-0.90
-1.01% |
$89.59
|
4,401,266
268.30% of 50 DAV
50 DAV is 1,640,400
|
$91.50
-3.16%
|
5/3/2012
|
$90.28
|
PP = $86.45
|
|
MB = $90.77
|
Most Recent Note - 5/29/2012 5:00:16 PM
G - Up today with average volume. Found prompt support last week as it rebounded above its 50 DMA line following a streak of 5 consecutive losses which completely negated the latest breakout. It stalled following its considerable "breakaway gap" on 5/03/12.
>>> The latest Featured Stock Update with an annotated graph appeared on 5/11/2012. Click here.
View all notes |
Alert me of new notes |
CANSLIM.net Company Profile |
SEC |
Zacks Reports |
StockTalk |
News |
Chart |
Request a new note
C
A N
S L
I M
|
|
 |
| Subscriber Question: |
May 29, 2012 |
Dear Ken,
You state this about the Mid-day Breakout Screen: Volume Is: At least 57.5% of 50 Day Average Volume at the time of the screening. Shouldn't volume be at least 150% of the 50-day average to be considered for the yellow list? 57% of average isn't anything to get excited about.
Thanks for your response. Dave |
| Ken's Response: |
May 30, 2012 |
Dear Dave:
Thanks for writing in concerning the Mid-Day BreakOuts Report screening parameters.
We cannot predict the future, but the general idea is that a typical trading session is 6.5 hours long from 9:30AM to 4:00PM, so on most days at about 1/3 of the way through the session, when we screen the Leaders List and start to produce the report, the stocks that have met the screen parameters specified are on pace to potentially meet or exceed the minimum volume threshold needed to be triggering a technical buy signal if they have formed sound base patterns.
Back in 2003 when we first introduced the mid-day report it was to demonstrate the Leaders List and the ways our website allows members to screen/sort all of the high-ranked stocks in the Leaders List at any time they like throughout each trading day. By taking a careful look each trading day at the high-ranked stocks on the Leaders List which are trading with volume running at an above average pace while at new 52-week highs, or very near their 52-week highs, we believe members have the best chance at discovering the most action-worthy buy candidates.
Over time you may notice minor daily adjustments to the Volume %, and the % from 52-week High, and even the Time the screen was done (on holiday-shortened trading sessions, or days when my schedule requires it, or if we encounter any technical problems).
For further insight on the mid-day report screening parameters, might I also refer back to this special notice that was published nearly 4 years ago when the market was so ugly we could barely produce a mid-day report at all. Hopefully this explanation will satisfy your concerns, but if there is anything else that is unclear please free free to write in again ask so we can help to set the record straight. Thanks!
SPECIAL NOTICE FROM CANSLIM.NET FOUNDER KENNETH J. GRUNEISEN:
Friday, October 10, 2008
To produce the CANSLIM.net Mid-Day BreakOuts Report, at around mid-way through each trading day we screen the Leaders List database of high-ranked stocks, searching for possible buy candidates that are trading at or near their 52-week highs on above average volume. Regular readers have noticed that the screen parameters used to generate this report during each trading session are occasionally adjusted. Note that these adjustments are made so that the resulting report will do the best job possible of giving our loyal members a concise list of high-ranked leaders most worthy of closer attention. In recent weeks we had to lower the bar just to find a small handful of companies reaching our screening criteria. Instead of limiting the screen results to show us a list of stocks trading within 5% of their 52-week highs (the usual setting), we included stocks trading with 10% of their 52-week highs in some of the most recent reports. The report yesterday showed stocks within 15%, and today's report including stocks within 20% of their 52-week highs turned up only one high-ranked company........
Read More...
Keep in mind also that the "Date Featured" column tells you the date that any stock was most recently color coded yellow with a new pivot point also cited. It wouldn't have to trade 150% of average volume every day afterward to stay color coded yellow, but it will stay coded yellow until manually changed to green while then noted accordingly.
We appreciate any suggestions you may have on how we can improve our services. Please use the inquiry form if you have any other questions about the upgraded services we provide. We always say around here that if one person asks a question there were probably 20 other members who had the same question, but they were too busy and didn't take time to ask!
We wish you the utmost success with the fact-based investment system we support.
Best regards,

Kenneth J. Gruneisen
Founder & Contributing Writer for CANSLIM.net
www.canslim.net |
|
|
|
THESE ARE NOT BUY RECOMMENDATIONS!
Comments contained in the body of this report are technical
opinions only. The material herein has been obtained
from sources believed to be reliable and accurate, however,
its accuracy and completeness cannot be guaranteed.
This site is not an investment advisor, hence it does
not endorse or recommend any securities or other investments.
Any recommendation contained in this report may not
be suitable for all investors and it is not to be deemed
an offer or solicitation on our part with respect to
the purchase or sale of any securities. All trademarks,
service marks and trade names appearing in this report
are the property of their respective owners, and are
likewise used for identification purposes only.
This report is a service available
only to active Paid Premium Members.
You may opt-out of receiving report notifications
at any time. Questions or comments may be submitted
by writing to Premium Membership Services 665 S.E. 10 Street, Suite 201 Deerfield Beach, FL 33441-5634 or by calling 1-800-965-8307
or 954-785-1121.
|
|
|

