You are not logged in.
This means you
CAN ONLY VIEW reports that were published prior to Monday, April 14, 2025.
You
MUST UPGRADE YOUR MEMBERSHIP if you want to see any current reports.
AFTER MARKET UPDATE - TUESDAY, MAY 31ST, 2011
Previous After Market Report Next After Market Report >>>
|
|
|
|
DOW |
+128.21 |
12,569.79 |
+1.03% |
|
Volume |
1,515,096,440 |
+119% |
|
Volume |
2,379,994,260 |
+47% |
|
NASDAQ |
+38.44 |
2,835.30 |
+1.37% |
|
Advancers |
2,312 |
73% |
|
Advancers |
1,831 |
67% |
|
S&P 500 |
+14.10 |
1,345.20 |
+1.06% |
|
Decliners |
743 |
24% |
|
Decliners |
818 |
30% |
|
Russell 2000 |
+12.04 |
848.30 |
+1.44% |
|
52 Wk Highs |
224 |
|
|
52 Wk Highs |
135 |
|
|
S&P 600 |
+6.90 |
453.44 |
+1.55% |
|
52 Wk Lows |
11 |
|
|
52 Wk Lows |
46 |
|
|
 |
Major Averages Resume Upward Trend With Better Leadership and Volume
Kenneth J. Gruneisen - Passed the CAN SLIM® Master's Exam
On expectations that European Union leaders will agree on a new bailout plan for Greece the major averages posted solid gains. Heavier volume totals on the Nasdaq exchange and on the NYSE were an encouraging sign as traders returned from the Memorial Day weekend with an appetite for accumulating stocks again. Advancing issues beat decliners 3-1 on the NYSE and 9-4 on the Nasdaq exchange. New 52-week highs outnumbered new 52-week lows on the NYSE and on the Nasdaq exchange. Leadership improved meaningfully again as there were 81 high-ranked companies from the CANSLIM.net Leaders List that made new 52-week highs and appeared on the CANSLIM.net BreakOuts Page, up from the total of 45 on the prior session. There were gains from 13 of the 16 high-ranked leaders currently included on the Featured Stocks Page.
Commodity prices got a lift from a weaker dollar while the market overcame weak economic data. A survey showed home prices in 20 U.S. cities dropped in March to the lowest level since 2003. A measure of Midwest business activity declined more than expected in April. And the May consumer confidence index unexpectedly fell to a six month low as worries about jobs and inflation grew. Wall Street welcomed an improved outlook for Europe with an end-of-month rally.
Bank of America Corp (BAC +0.51%) and Citigroup Inc (C +0.44%) inched higher following gains in European financial companies. Shares of Ashland Inc (ASH +11.95%) rallied after it announced plans to buy closely-held International Specialty Products for $3.2 billion in cash. Apple Inc (AAPL +3.09%) announced that CEO Steve Jobs will make a public appearance next week to promote a new service that lets users store content online. Intel Corp (INTC +1.35%) rose after the company said it will introduce a new type of thinner laptop. Meanwhile, Nokia Corp (NOK -14.39%) dove after cutting its sales forecast for the second quarter and full year.
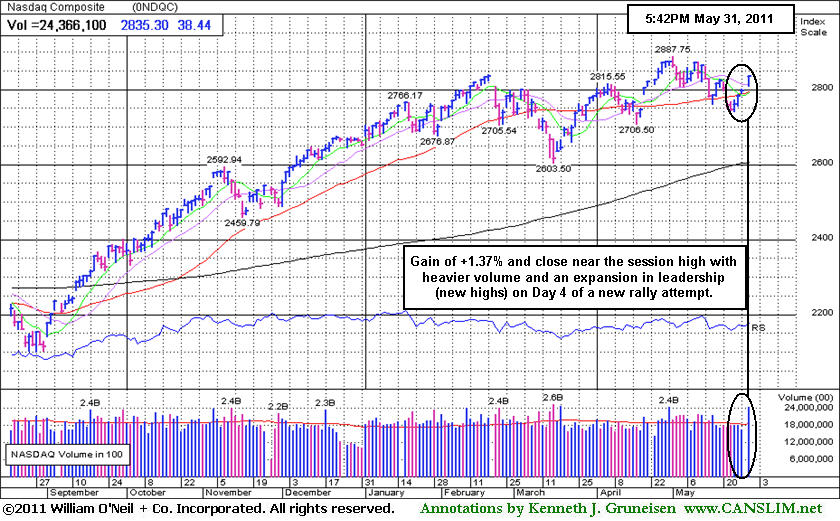
Recovering from losses last week which caused the Nasdaq Composite Index, S&P 500 Index, and Dow Jones Industrial Average to briefly violate their respective 50--day moving average (DMA) lines, all of the above mentioned indexes closed the week back above their 50 DMA lines after Friday's gains and rallied further on Monday. The stock market has seen leadership steadily expanding while the recent technical action in the major indices has improved. The market (M criteria) has essentially confirmed a new rally and upward trend with a follow-through day, although the size of the Nasdaq's gain (percentage-wise) was near that of the last so-so FTD. Investors may consider odds more favorable for acting upon new buy candidates matching all key criteria. Carefully increase exposure to stocks as the market action dictates, yet always limit losses by selling any stocks that fall more than -7% from their purchase price.
PICTURED: The Nasdaq Composite Index posted a gain of +1.37% and outpaced its bigger peers as it closed near the session high with heavier volume coupled with an expansion in leadership (new highs) on Day 4 of a new rally attempt.
|
 Kenneth J. Gruneisen started out as a licensed stockbroker in August 1987, a couple of months prior to the historic stock market crash that took the Dow Jones Industrial Average down -22.6% in a single day. He has published daily fact-based fundamental and technical analysis on high-ranked stocks online for two decades. Through FACTBASEDINVESTING.COM, Kenneth provides educational articles, news, market commentary, and other information regarding proven investment systems that work in good times and bad.
Comments contained in the body of this report are technical opinions only and are not necessarily those of Gruneisen Growth Corp. The material herein has been obtained from sources believed to be reliable and accurate, however, its accuracy and completeness cannot be guaranteed. Our firm, employees, and customers may effect transactions, including transactions contrary to any recommendation herein, or have positions in the securities mentioned herein or options with respect thereto. Any recommendation contained in this report may not be suitable for all investors and it is not to be deemed an offer or solicitation on our part with respect to the purchase or sale of any securities. |
|
 |
Financial Indexes Rally Back Above 200-Day Average Lines
Kenneth J. Gruneisen - Passed the CAN SLIM® Master's Exam
The Broker/Dealer Index ($XBD +1.34%) and Bank Index ($BKX +0.76%) posted gains and the Retail Index ($RLX +0.61%) also had an important positive influence on major averages. The tech sector was led higher by unanimous gains from the Semiconductor Index ($SOX +1.50%), Biotechnology Index ($BTK +1.31%), Internet Index ($IIX +1.24%), and Networking Index ($NWX +0.88%). Energy-related stocks posted gains as the Oil Services Index ($OSX +0.80%) and Integrated Oil Index ($XOI +1.28%) finished higher on Monday while defensive groups also edged higher and the Gold & Silver Index ($XAU +0.15%) and Healthcare Index ($HMO +0.86%) posted gains.
Charts courtesy www.stockcharts.com
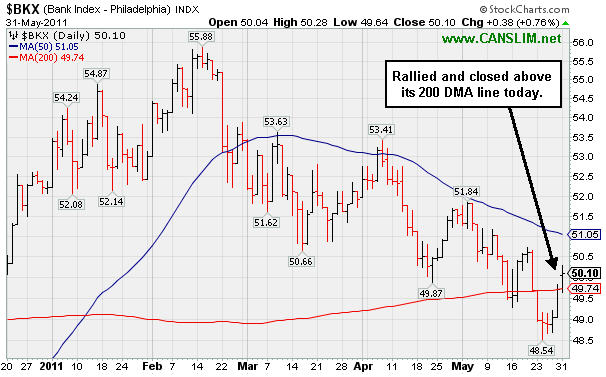
PICTURED 1: The Bank Index ($BKX +0.76%) rallied and closed above its 200-day moving average (DMA) line today.
Charts courtesy www.stockcharts.com
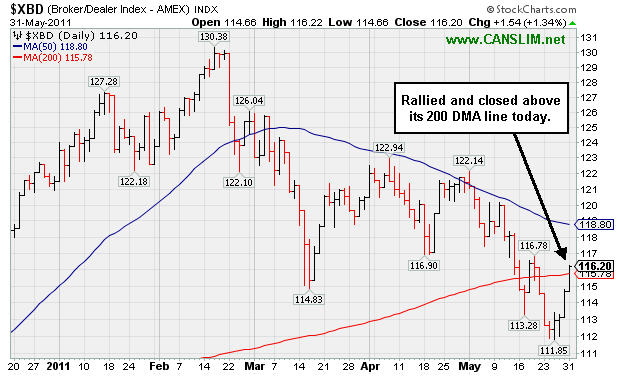
PICTURED 2: The Broker/Dealer Index ($XBD +1.34%) rallied and closed above its 200 DMA line today. The improved action in the financial groups is a reassuring sign of strength from areas considered as important "leading indicators" - groups which have continually been mentioned in this commentary.
| Oil Services |
$OSX |
273.16 |
+2.16 |
+0.80% |
+11.44% |
| Healthcare |
$HMO |
2,397.30 |
+20.49 |
+0.86% |
+41.68% |
| Integrated Oil |
$XOI |
1,332.19 |
+16.79 |
+1.28% |
+9.81% |
| Semiconductor |
$SOX |
439.60 |
+6.51 |
+1.50% |
+6.75% |
| Networking |
$NWX |
320.45 |
+2.80 |
+0.88% |
+14.22% |
| Internet |
$IIX |
321.33 |
+3.94 |
+1.24% |
+4.42% |
| Broker/Dealer |
$XBD |
116.20 |
+1.54 |
+1.34% |
-4.37% |
| Retail |
$RLX |
532.63 |
+3.25 |
+0.61% |
+4.77% |
| Gold & Silver |
$XAU |
208.78 |
+0.31 |
+0.15% |
-7.86% |
| Bank |
$BKX |
50.10 |
+0.38 |
+0.76% |
-4.04% |
| Biotech |
$BTK |
1,481.37 |
+19.23 |
+1.31% |
+14.16% |
|
|
|
 |
Fresh Technical Breakout From Firm in Finance - Consumer Loans Industry
Kenneth J. Gruneisen - Passed the CAN SLIM® Master's Exam
A very important technical tool that savvy investors have learned to incorporate in their technical analysis is the 50-day moving average (DMA) line. The 50 DMA line plays a pivotal role relative to a stock's price. If the price of a stock is above its 50 DMA then odds are that its 50 DMA will act as formidable support. Conversely, if the price is below its 50 DMA then the moving average acts as resistance. Healthy stocks sometimes trade under their 50 DMA lines briefly, but usually a strong candidate will promptly bounce and repair a 50 DMA violation. When a stock has violated its 50 DMA line and then lingers beneath it, the stock's outlook gets worse and worse as it spends a greater period of time trading under that important short-term average line. Once the 50 DMA line starts sloping downward it should also be acknowledged that the stock has been struggling for a while, and it might be time to reduce exposure and look for places to put that money to work in stronger buy candidates.
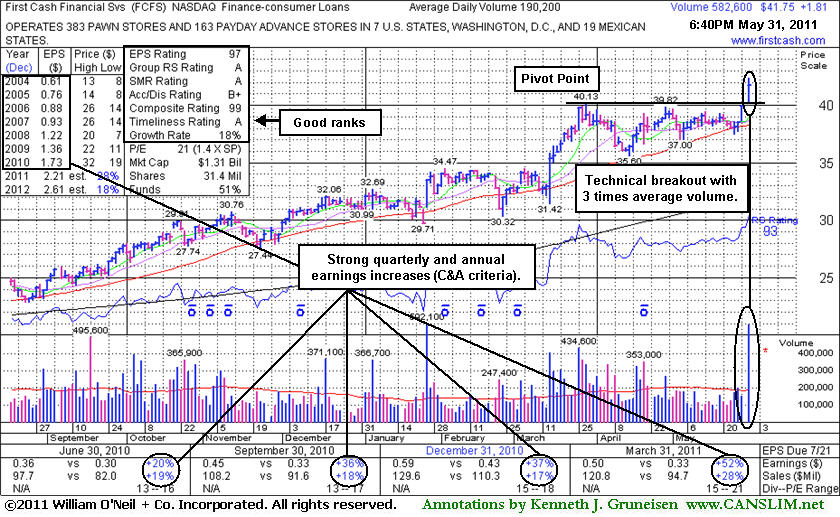
First Cash Financial Services Inc. (FCFS +$1.81 or +4.53% to $41.75) gapped up today and hit a new 52-week high, rising from an orderly flat base pattern with 3 times average volume triggering a technical buy signal. Its color code was changed to yellow with pivot point cited based on its 52-week high plus ten cents when featured in the mid-day report (read here). Its 50 DMA line defines near-term support. It reported earnings +52% on +28% sales revenues for the quarter ended March 31, 2011 versus the year ago period. Its annual earnings (A criteria) history has been steady. It may be considered a "late-stage" and risky buy candidate. The number of top-rated funds owning its shares rose slightly from 336 in Jun '10 to 347 in Mar '11.
The major averages' gains today coupled with higher volume totals on the major exchanges and an expansion in the number of stocks hitting new 52-week highs signaled an improvement in the M criteria (market direction). Long ago, FCFS was included on the Featured Stocks list, and it has returned to the list based upon its strong fundamental and technical characteristics today.
|
|
|
Color Codes Explained :
Y - Better candidates highlighted by our
staff of experts.
G - Previously featured
in past reports as yellow but may no longer be buyable under the
guidelines.
***Last / Change / Volume data in this table is the closing quote data***
Symbol/Exchange
Company Name
Industry Group |
PRICE |
CHANGE
(%Change) |
Day High |
Volume
(% DAV)
(% 50 day avg vol) |
52 Wk Hi
% From Hi |
Featured
Date |
Price
Featured |
Pivot Featured |
|
Max Buy |
CEVA
-
NASDAQ
Ceva Inc
ELECTRONICS - Semiconductor - Specialized
|
$34.33
|
+0.10
0.29% |
$35.60
|
469,684
217.55% of 50 DAV
50 DAV is 215,900
|
$34.34
-0.03%
|
5/25/2011
|
$32.98
|
PP = $32.05
|
|
MB = $33.65
|
 Most Recent Note - 5/31/2011 12:09:25 PM
G - Touched a new 52-week high today then reversed into the red. Rallied beyond its "max buy" level and its color code was changed to green after getting extended more than +5% above prior highs.
>>> The latest Featured Stock Update with an annotated graph appeared on 5/25/2011. Click here.
View all notes |
Alert me of new notes |
CANSLIM.net Company Profile |
SEC |
Zacks Reports |
StockTalk |
News |
Chart |
Request a new note
C
A N
S L
I M


|
CMG
-
NYSE
Chipotle Mexican Grill
LEISURE - Restaurants
|
$289.07
|
-3.87
-1.32% |
$295.99
|
773,627
70.88% of 50 DAV
50 DAV is 1,091,500
|
$293.99
-1.67%
|
4/1/2011
|
$274.00
|
PP = $275.10
|
|
MB = $288.86
|
Most Recent Note - 5/26/2011 3:19:38 PM
G - Inching higher today with very quiet volume while reaching a new all-time high, and no resistance remains due to overhead supply. Formed a 5-week base with volume totals cooling in recent weeks while finding support near its 50 DMA line. Its sub par earnings increase of +23% in the latest quarter ended March 31st, 2011 versus the year ago period raised concern while marking its weakest quarterly earnings increase in more than 2 years.
>>> The latest Featured Stock Update with an annotated graph appeared on 5/17/2011. Click here.
View all notes |
Alert me of new notes |
CANSLIM.net Company Profile |
SEC |
Zacks Reports |
StockTalk |
News |
Chart |
Request a new note
C
A N
S L
I M
|
EZPW
-
NASDAQ
Ezcorp Inc Cl A
SPECIALTY RETAIL - Specialty Retail, Other
|
$32.79
|
+1.58
5.06% |
$32.81
|
595,910
171.24% of 50 DAV
50 DAV is 348,000
|
$33.08
-0.88%
|
2/18/2011
|
$27.94
|
PP = $30.04
|
|
MB = $31.54
|
Most Recent Note - 5/31/2011 11:51:42 AM
G - Gapped up today, nearly challenging its 52-week high after a choppy 8-week consolidation. Recent lows and its 50 DMA line define important nearby chart support to watch where technical violations would raise more serious concerns.
>>> The latest Featured Stock Update with an annotated graph appeared on 5/10/2011. Click here.
View all notes |
Alert me of new notes |
CANSLIM.net Company Profile |
SEC |
Zacks Reports |
StockTalk |
News |
Chart |
Request a new note
C
A N
S L
I M
|
FCFS
-
NASDAQ
First Cash Financial Svs
SPECIALTY RETAIL - Specialty Retail, Other
|
$41.75
|
+1.81
4.53% |
$42.36
|
582,608
306.31% of 50 DAV
50 DAV is 190,200
|
$40.13
4.04%
|
5/31/2011
|
$42.00
|
PP = $40.23
|
|
MB = $42.24
|
Most Recent Note - 5/31/2011
Y - Gapped up today and hit a new 52-week high, rising from an orderly flat base pattern with 3 times average volume while confirming a new technical buy signal. It may be considered a "late-stage" and riskier buy candidate, yet it was among the expansion of leadership as the market (M criteria) resumed its upward trend. In the mid-day report earlier its color code was changed to yellow with pivot point cited based on its 52-week high plus ten cents. Its 50 DMA line defines near-term support.
>>> The latest Featured Stock Update with an annotated graph appeared on 5/31/2011. Click here.
View all notes |
Alert me of new notes |
CANSLIM.net Company Profile |
SEC |
Zacks Reports |
StockTalk |
News |
Chart |
Request a new note
C
A N
S L
I M
|
FOSL
-
NASDAQ
Fossil Inc
CONSUMER DURABLES - Recreational Goods, Other
|
$105.84
|
+0.56
0.53% |
$106.18
|
475,696
59.76% of 50 DAV
50 DAV is 796,000
|
$107.54
-1.58%
|
2/1/2011
|
$73.30
|
PP = $74.44
|
|
MB = $78.16
|
Most Recent Note - 5/26/2011 2:52:20 PM
G - Volume totals have been cooling while consolidating in a tight range since its considerable gap up gain on 5/10/11 for a new all-time high. It is extended from any sound base. Prior highs near $96 define initial support to watch above its 50 DMA line.
>>> The latest Featured Stock Update with an annotated graph appeared on 5/2/2011. Click here.
View all notes |
Alert me of new notes |
CANSLIM.net Company Profile |
SEC |
Zacks Reports |
StockTalk |
News |
Chart |
Request a new note
C
A N
S L
I M
|
Symbol/Exchange
Company Name
Industry Group |
PRICE |
CHANGE
(%Change) |
Day High |
Volume
(% DAV)
(% 50 day avg vol) |
52 Wk Hi
% From Hi |
Featured
Date |
Price
Featured |
Pivot Featured |
|
Max Buy |
HMSY
-
NASDAQ
H M S Holdings Corp
COMPUTER SOFTWARE and SERVICES - Healthcare Information Service
|
$78.06
|
+0.39
0.50% |
$78.23
|
166,190
103.74% of 50 DAV
50 DAV is 160,200
|
$84.82
-7.97%
|
11/19/2010
|
$61.89
|
PP = $63.01
|
|
MB = $66.16
|
Most Recent Note - 5/31/2011 7:19:04 PM
G - Small gain today on near average volume. It has lingered for the past 4 weeks below its 50 DMA line which may now act as resistance. A rally above it would improve its technical stance. Deterioration below its recent chart low ($73.27) would raise more serious concerns and trigger an additional sell signal.
>>> The latest Featured Stock Update with an annotated graph appeared on 5/23/2011. Click here.
View all notes |
Alert me of new notes |
CANSLIM.net Company Profile |
SEC |
Zacks Reports |
StockTalk |
News |
Chart |
Request a new note
C
A N
S L
I M
|
HS
-
NYSE
Healthspring Inc
HEALTH SERVICES - Health Care Plans
|
$43.85
|
+1.18
2.77% |
$43.87
|
703,496
71.69% of 50 DAV
50 DAV is 981,300
|
$45.11
-2.79%
|
3/22/2011
|
$38.29
|
PP = $38.85
|
|
MB = $40.79
|
Most Recent Note - 5/31/2011 7:32:09 PM
G - Up on light volume today for a 4th consecutive small gain, finishing 42 cents off its best ever close. Its 50 DMA line define important chart support to watch where a violation would trigger technical sell signals.
>>> The latest Featured Stock Update with an annotated graph appeared on 5/20/2011. Click here.
View all notes |
Alert me of new notes |
CANSLIM.net Company Profile |
SEC |
Zacks Reports |
StockTalk |
News |
Chart |
Request a new note
C
A N
S L
I M
|
INFA
-
NASDAQ
Informatica Corp
COMPUTER SOFTWARE and SERVICES - Business Software and Services
|
$58.66
|
+0.81
1.40% |
$59.00
|
4,359,101
393.60% of 50 DAV
50 DAV is 1,107,500
|
$58.31
0.60%
|
3/24/2011
|
$50.04
|
PP = $49.86
|
|
MB = $52.35
|
Most Recent Note - 5/31/2011 7:06:50 PM
G - Hit another new 52-week high today with a 4th consecutive gain on ever-increasing volume. This high-ranked Computer Software - Database firm did not form a sound new base pattern. Its 50 DMA line defines near-term support to watch.
>>> The latest Featured Stock Update with an annotated graph appeared on 5/24/2011. Click here.
View all notes |
Alert me of new notes |
CANSLIM.net Company Profile |
SEC |
Zacks Reports |
StockTalk |
News |
Chart |
Request a new note
C
A N
S L
I M
|
LULU
-
NASDAQ
Lululemon Athletica
MANUFACTURING - Textile Manufacturing
|
$90.80
|
+0.72
0.80% |
$91.95
|
4,334,088
216.88% of 50 DAV
50 DAV is 1,998,400
|
$102.83
-11.70%
|
5/18/2011
|
$98.15
|
PP = $102.93
|
|
MB = $108.08
|
Most Recent Note - 5/31/2011 7:24:25 PM
G - Halted its slide with a gain today with above average volume. It remains below its 50 DMA line after triggering technical sell signals with damaging losses on above average volume last week. It failed to confirm a recent buy signal since a new pivot point was recently cited.
>>> The latest Featured Stock Update with an annotated graph appeared on 5/27/2011. Click here.
View all notes |
Alert me of new notes |
CANSLIM.net Company Profile |
SEC |
Zacks Reports |
StockTalk |
News |
Chart |
Request a new note
C
A N
S L
I M
|
MG
-
NYSE
Mistras Group Inc
DIVERSIFIED SERVICES - Bulding and Faci;ity Management Services
|
$17.41
|
+0.62
3.69% |
$17.41
|
197,510
122.37% of 50 DAV
50 DAV is 161,400
|
$18.46
-5.69%
|
3/15/2011
|
$15.48
|
PP = $15.90
|
|
MB = $16.70
|
Most Recent Note - 5/31/2011 3:56:25 PM
G - Today's gain on below average (but higher) volume has it rallying back above its 50 DMA line helping its outlook, technically. The recent low ($15.44 on 5/05/11) defines the next chart support. Completed a new Public Offering on 5/05/11.
>>> The latest Featured Stock Update with an annotated graph appeared on 5/12/2011. Click here.
View all notes |
Alert me of new notes |
CANSLIM.net Company Profile |
SEC |
Zacks Reports |
StockTalk |
News |
Chart |
Request a new note
C
A N
S L
I M
|
Symbol/Exchange
Company Name
Industry Group |
PRICE |
CHANGE
(%Change) |
Day High |
Volume
(% DAV)
(% 50 day avg vol) |
52 Wk Hi
% From Hi |
Featured
Date |
Price
Featured |
Pivot Featured |
|
Max Buy |
MWIV
-
NASDAQ
M W I Veterinary Supply
HEALTH SERVICES - Medical Instruments and; Supplies
|
$84.30
|
+1.63
1.97% |
$84.30
|
115,836
133.45% of 50 DAV
50 DAV is 86,800
|
$86.99
-3.09%
|
11/4/2010
|
$61.79
|
PP = $59.60
|
|
MB = $62.58
|
Most Recent Note - 5/31/2011 7:27:46 PM
G - Gain today with above average volume helped it rally for a best-ever close. Stubbornly held its ground in recent weeks, but it did not form a sound new base pattern. Its 50 DMA line defines important support to watch.
>>> The latest Featured Stock Update with an annotated graph appeared on 5/5/2011. Click here.
View all notes |
Alert me of new notes |
CANSLIM.net Company Profile |
SEC |
Zacks Reports |
StockTalk |
News |
Chart |
Request a new note
C
A N
S L
I M
|
OPNT
-
NASDAQ
Opnet Technologies
INTERNET - Internet Software and Services
|
$39.17
|
-0.39
-0.99% |
$39.96
|
274,300
222.47% of 50 DAV
50 DAV is 123,300
|
$42.51
-7.86%
|
5/11/2011
|
$41.21
|
PP = $40.50
|
|
MB = $42.53
|
Most Recent Note - 5/31/2011 7:09:38 PM
G - Churned heavy volume with a small loss today while consolidating just above its 50 DMA line. It faces very little resistance due to overhead supply.
>>> The latest Featured Stock Update with an annotated graph appeared on 5/11/2011. Click here.
View all notes |
Alert me of new notes |
CANSLIM.net Company Profile |
SEC |
Zacks Reports |
StockTalk |
News |
Chart |
Request a new note
C
A N
S L
I M
|
PCLN
-
NASDAQ
Priceline.Com Inc
INTERNET - Internet Software and Services
|
$515.19
|
+13.75
2.74% |
$515.19
|
863,676
77.74% of 50 DAV
50 DAV is 1,111,000
|
$561.88
-8.31%
|
1/3/2011
|
$399.55
|
PP = $428.20
|
|
MB = $449.61
|
Most Recent Note - 5/31/2011 4:00:07 PM
G - Gain today with below average volume helped it rally just above its 50 DMA line. Losses on higher volume last week were noted as indicative of more distributional pressure. Recent chart low ($493.67 on 5/17/11) defines an important near-term support level where further deterioration would raise even greater concerns.
>>> The latest Featured Stock Update with an annotated graph appeared on 5/19/2011. Click here.
View all notes |
Alert me of new notes |
CANSLIM.net Company Profile |
SEC |
Zacks Reports |
StockTalk |
News |
Chart |
Request a new note
C
A N
S L
I M
|
RAX
-
NYSE
Rackspace Hosting Inc
INTERNET - Internet Software and; Services
|
$44.00
|
+0.30
0.69% |
$44.27
|
4,196,112
237.83% of 50 DAV
50 DAV is 1,764,300
|
$46.50
-5.37%
|
3/16/2011
|
$36.28
|
PP = $40.72
|
|
MB = $42.76
|
Most Recent Note - 5/31/2011 7:11:48 PM
G - Up today with heavy volume for a 4th consecutive small gain. Consolidating above its 50 DMA line, it has not formed a sound new base pattern but may eventually form a new "late-stage" base. Meanwhile, deterioration below its recent chart low ($38.84 on 5/12/11) would trigger more worrisome technical sell signals.
>>> The latest Featured Stock Update with an annotated graph appeared on 5/13/2011. Click here.
View all notes |
Alert me of new notes |
CANSLIM.net Company Profile |
SEC |
Zacks Reports |
StockTalk |
News |
Chart |
Request a new note
C
A N
S L
I M
|
TIBX
-
NASDAQ
Tibco Software Inc
COMPUTER SOFTWARE and SERVICES - Business Software and Services
|
$28.09
|
-0.22
-0.78% |
$28.75
|
7,148,564
270.38% of 50 DAV
50 DAV is 2,643,900
|
$30.75
-8.65%
|
3/18/2011
|
$23.88
|
PP = $26.04
|
|
MB = $27.34
|
Most Recent Note - 5/31/2011 7:16:20 PM
G - Down today for a small loss with very heavy volume, closing just below its 50 DMA line. The recent low ($27.17) defines important chart support where any more damaging losses may trigger technical sell signals.
>>> The latest Featured Stock Update with an annotated graph appeared on 5/18/2011. Click here.
View all notes |
Alert me of new notes |
CANSLIM.net Company Profile |
SEC |
Zacks Reports |
StockTalk |
News |
Chart |
Request a new note
C
A N
S L
I M
|
Symbol/Exchange
Company Name
Industry Group |
PRICE |
CHANGE
(%Change) |
Day High |
Volume
(% DAV)
(% 50 day avg vol) |
52 Wk Hi
% From Hi |
Featured
Date |
Price
Featured |
Pivot Featured |
|
Max Buy |
ULTA
-
NASDAQ
Ulta Salon Cosm & Frag
SPECIALTY RETAIL - Specialty Retail, Other
|
$55.98
|
+0.73
1.32% |
$57.17
|
1,316,217
269.22% of 50 DAV
50 DAV is 488,900
|
$56.87
-1.56%
|
1/6/2011
|
$36.12
|
PP = $37.34
|
|
MB = $39.21
|
Most Recent Note - 5/31/2011 1:29:11 PM
G - Gapped up today and traded above average volume as it hit a new all-time high. Found support above its 50 DMA line last week. It is extended from any sound base pattern.
>>> The latest Featured Stock Update with an annotated graph appeared on 5/26/2011. Click here.
View all notes |
Alert me of new notes |
CANSLIM.net Company Profile |
SEC |
Zacks Reports |
StockTalk |
News |
Chart |
Request a new note
C
A N
S L
I M
|
|
|
|
THESE ARE NOT BUY RECOMMENDATIONS!
Comments contained in the body of this report are technical
opinions only. The material herein has been obtained
from sources believed to be reliable and accurate, however,
its accuracy and completeness cannot be guaranteed.
This site is not an investment advisor, hence it does
not endorse or recommend any securities or other investments.
Any recommendation contained in this report may not
be suitable for all investors and it is not to be deemed
an offer or solicitation on our part with respect to
the purchase or sale of any securities. All trademarks,
service marks and trade names appearing in this report
are the property of their respective owners, and are
likewise used for identification purposes only.
This report is a service available
only to active Paid Premium Members.
You may opt-out of receiving report notifications
at any time. Questions or comments may be submitted
by writing to Premium Membership Services 665 S.E. 10 Street, Suite 201 Deerfield Beach, FL 33441-5634 or by calling 1-800-965-8307
or 954-785-1121.
|
|
|

