You are not logged in.
This means you
CAN ONLY VIEW reports that were published prior to Monday, April 14, 2025.
You
MUST UPGRADE YOUR MEMBERSHIP if you want to see any current reports.
AFTER MARKET UPDATE - THURSDAY, MAY 30TH, 2013
Previous After Market Report Next After Market Report >>>
|
|
|
|
DOW |
+21.73 |
15,324.53 |
+0.14% |
|
Volume |
710,556,810 |
-2% |
|
Volume |
1,721,452,230 |
+0% |
|
NASDAQ |
+23.78 |
3,491.30 |
+0.69% |
|
Advancers |
1,787 |
57% |
|
Advancers |
1,727 |
67% |
|
S&P 500 |
+6.05 |
1,654.41 |
+0.37% |
|
Decliners |
1,212 |
39% |
|
Decliners |
776 |
30% |
|
Russell 2000 |
+7.47 |
994.43 |
+0.76% |
|
52 Wk Highs |
147 |
|
|
52 Wk Highs |
156 |
|
|
S&P 600 |
+3.41 |
557.35 |
+0.62% |
|
52 Wk Lows |
64 |
|
|
52 Wk Lows |
16 |
|
|
 |
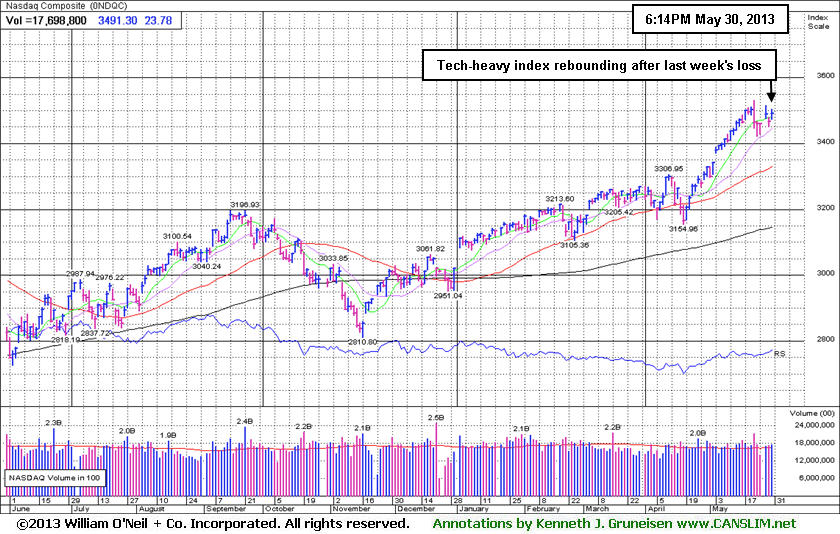
Major Averages Shrugged Off Bad News and Rallied
Kenneth J. Gruneisen - Passed the CAN SLIM® Master's Exam
The major indices posted unanimous gains on Thursday despite some disappointing economic news, displaying a common characteristic of bullish market environments. The volume totals were reported very near the prior session totals on both major US exchanges. Breadth was positive as advancers led decliners by a 3-2 margin on the NYSE and by better than a 2-1 margin on the Nasdaq exchange. There were 44 high-ranked companies from the CANSLIM.net Leaders List making new 52-week highs and appearing on the CANSLIM.net BreakOuts Page, more than doubling the prior session total of 21 stocks. New 52-week highs outnumbered new 52-week lows on the Nasdaq exchange and on the NYSE. There were gains for 10 of the 12 high-ranked companies currently included on the Featured Stocks Page.
The major averages advanced despite weaker-than-expected economic data. Before the open, first quarter GDP was revised to 2.4% from the initial 2.5% reading and weekly jobless claims increased by 10,000 to 354,000. A separate report showed pending home sales edged up +0.3% in April, below projections for a +1.5% increase.
On the earnings front, Costco Corp (COST -0.95%) edged lower following its positive profit results. Big Lots Inc (BIG -8.99%) fell after reducing its full-year forecast. Financials were among the best performing sectors as SLM Corp (SLM +2.39%), known as "Sallie Mae", and Morgan Stanley (MS +3.36%) rose. Utilities and tech also outperformed and NV Energy Inc (NVE +22.51%) surged after Berkshire Hathaway's MidAmerican Energy unit agreed to buy the company for $5.6 billion. EMC Corp (EMC +5.37%) rallied after increasing its share buyback plan and instituting a quarterly dividend. Energy was an underperforming group with Halliburton Co (HAL -2.16%) falling.
The market (M criteria) uptrend recently lifted the Dow Jones Industrial Average and the S&P 500 Index to new record highs. The indices' rally to new highs confirmed the market's uptrend which means odds are favorable for new buying efforts in stocks meeting all of the fact-based investment system's key criteria. Action-worthy leaders best matching the winning models are covered on an ongoing basis on the Featured Stocks Page - including our Certified experts' latest notes and links to additional resources including detailed analysis with annotated graphs.
The Premium Member Homepage - includes "dynamic archives" to all prior pay reports published. Watch for an announcement via email concerning the next WEBCAST.
PICTURED: The tech-heavy Nasdaq Composite Index has been rebounding after last week's loss broke a streak of after 4 consecutive weekly gains.
|
 Kenneth J. Gruneisen started out as a licensed stockbroker in August 1987, a couple of months prior to the historic stock market crash that took the Dow Jones Industrial Average down -22.6% in a single day. He has published daily fact-based fundamental and technical analysis on high-ranked stocks online for two decades. Through FACTBASEDINVESTING.COM, Kenneth provides educational articles, news, market commentary, and other information regarding proven investment systems that work in good times and bad.
Comments contained in the body of this report are technical opinions only and are not necessarily those of Gruneisen Growth Corp. The material herein has been obtained from sources believed to be reliable and accurate, however, its accuracy and completeness cannot be guaranteed. Our firm, employees, and customers may effect transactions, including transactions contrary to any recommendation herein, or have positions in the securities mentioned herein or options with respect thereto. Any recommendation contained in this report may not be suitable for all investors and it is not to be deemed an offer or solicitation on our part with respect to the purchase or sale of any securities. |
|
 |
Laggard Group Rebounds From Lows; Tech and Financials Rose
Kenneth J. Gruneisen - Passed the CAN SLIM® Master's Exam
The Retail Index ($RLX +0.29%) posted a smaller gain while financial stocks underpinned the major averages' advance and the Broker/Dealer Index ($XBD +1.28%) and Bank Index ($BKX +1.36%) both rose. The tech sector was strong as the Networking Index ($NWX +2.31%) led the way, followed by the Semiconductor Index ($SOX +1.53%), Biotechnology Index ($BTK +1.34%), and the Internet Index ($IIX +0.85%). The Gold & Silver Index ($XAU +5.24%) bounced back from its latest lows and the Healthcare Index ($HMO +1.91%) also rose. Energy-related shares lagged as the Oil Services Index ($OSX -0.57%) and Integrated Oil Index ($XOI -0.09%) edged lower.
Charts courtesy www.stockcharts.com
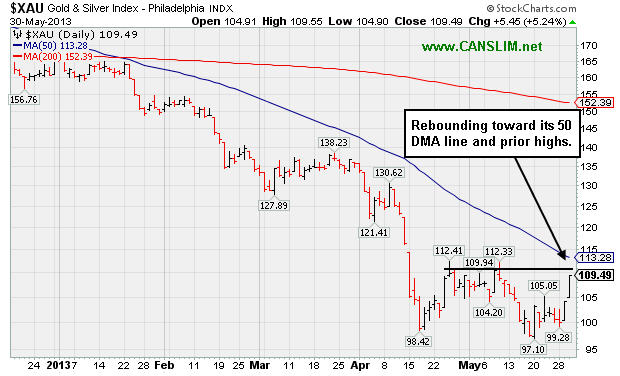
PICTURED: The Gold & Silver Index ($XAU +5.24%) is rebounding toward its 50-day moving average (DMA) line and prior highs. It is not in healthy shape, chart-wise, and regular readers of this commentary should recognize that it has been lagging behind "growth" oriented groups on an ongoing basis.
| Oil Services |
$OSX |
259.02 |
-1.48 |
-0.57% |
+17.65% |
| Healthcare |
$HMO |
3,186.71 |
+59.82 |
+1.91% |
+26.75% |
| Integrated Oil |
$XOI |
1,411.74 |
-1.29 |
-0.09% |
+13.68% |
| Semiconductor |
$SOX |
474.43 |
+7.14 |
+1.53% |
+23.53% |
| Networking |
$NWX |
254.02 |
+5.74 |
+2.31% |
+12.13% |
| Internet |
$IIX |
383.80 |
+3.24 |
+0.85% |
+17.37% |
| Broker/Dealer |
$XBD |
125.38 |
+1.59 |
+1.28% |
+32.92% |
| Retail |
$RLX |
789.94 |
+2.26 |
+0.29% |
+20.96% |
| Gold & Silver |
$XAU |
109.49 |
+5.45 |
+5.24% |
-33.88% |
| Bank |
$BKX |
62.64 |
+0.84 |
+1.36% |
+22.15% |
| Biotech |
$BTK |
2,019.60 |
+26.63 |
+1.34% |
+30.55% |
|
|
|
 |
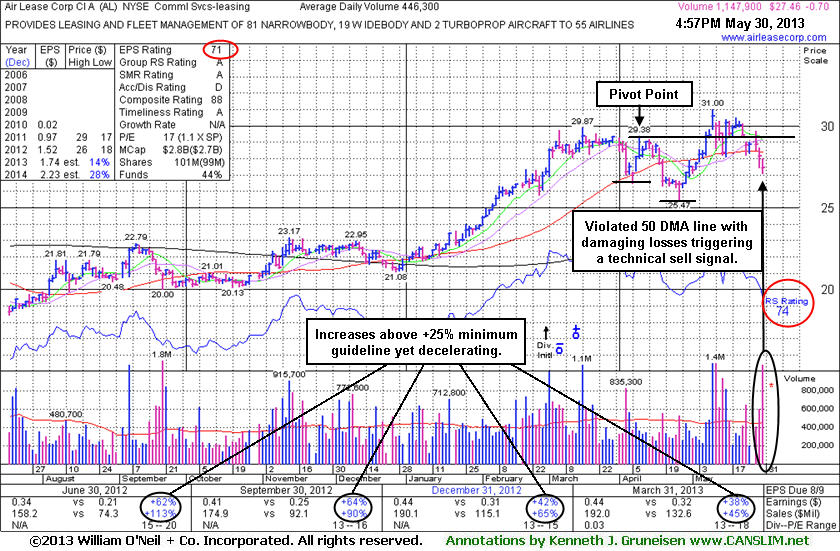
Weak Technical Action Triggered Sell Signal
Kenneth J. Gruneisen - Passed the CAN SLIM® Master's Exam
Air Lease Corp (AL -$0.70 or -2.49% to $27.46) recently violated important support at its 50-day moving average (DMA) line with volume-driven losses which raised concerns and triggered a technical sell signal. Only a prompt rebound above its 50 DMA would help its outlook improve.
It was last shown in this FSU section on 5/09/13 with an annotated graph under the headline, "Trading Lower After Hours Following Earnings Announcement", after highlighted in yellow with a pivot point based on its 4/09/13 high while rallying from a "double bottom" base in the earlier mid-day report (read here). Its strong finish for a 6th consecutive gain had clinched a technical buy signal, however, members were cautioned - "Volume and volatility often increase near earnings news." After the close it reported earnings +38% on +45% sales revenues for the quarter ended March 31, 2013 versus the year ago period. The result was below analysts' estimates yet well above the +25% minimum earnings guideline (C criteria). However, its earnings Per Share Rank has subsequently fallen from 84 to 71, below the 80+ minimum for buy candidates. Its Relative Strength Rating has also slumped below the 80+ minimum guideline to 74 (see red circles).
Decelerating sales revenues and earnings increases in sequential quarterly comparisons through Dec '12 were noted as cause for some concern, and the Mar '13 comparison continued that worrisome trend. It is still a fairly good match with the fact-based investment system's fundamental guidelines (C and A criteria), however it would be more ideal for a company to show sales and earnings acceleration. The number of top-rated funds owning its shares edged higher from 177 in Sep '12 to 184 in Mar '13 which is reassuring concerning the I criteria.
 |
|
|
Color Codes Explained :
Y - Better candidates highlighted by our
staff of experts.
G - Previously featured
in past reports as yellow but may no longer be buyable under the
guidelines.
***Last / Change / Volume data in this table is the closing quote data***
Symbol/Exchange
Company Name
Industry Group |
PRICE |
CHANGE
(%Change) |
Day High |
Volume
(% DAV)
(% 50 day avg vol) |
52 Wk Hi
% From Hi |
Featured
Date |
Price
Featured |
Pivot Featured |
|
Max Buy |
AL
-
NYSE
Air Lease Corp Cl A
DIVERSIFIED SERVICES - Rental and Leasing Services
|
$27.46
|
-0.70
-2.49% |
$28.01
|
1,147,981
257.22% of 50 DAV
50 DAV is 446,300
|
$31.00
-11.42%
|
5/9/2013
|
$30.95
|
PP = $29.38
|
|
MB = $30.85
|
 Most Recent Note - 5/30/2013 4:44:17 PM
G - Violated important support at its 50 DMA line with volume-driven losses raising concerns and triggering technical sell signals. Color code is changed to green, meanwhile, only a prompt rebound above its 50 DMA would help its outlook improve.
>>> The latest Featured Stock Update with an annotated graph appeared on 5/30/2013. Click here.
View all notes |
Alert me of new notes |
CANSLIM.net Company Profile |
SEC |
Zacks Reports |
StockTalk |
News |
Chart |
Request a new note
C
A N
S L
I M


|
AMBA
-
NASDAQ
Ambarella Inc
ELECTRONICS - Semiconductor - Specialized
|
$16.17
|
-0.12
-0.74% |
$16.69
|
809,537
103.67% of 50 DAV
50 DAV is 780,900
|
$17.90
-9.66%
|
5/6/2013
|
$15.31
|
PP = $16.10
|
|
MB = $16.91
|
Most Recent Note - 5/29/2013 7:46:21 PM
Y - Rebounded further above its pivot point with average volume behind its solid gain today. See the latest FSU analysis for more details and a new annotated graph.
>>> The latest Featured Stock Update with an annotated graph appeared on 5/29/2013. Click here.
View all notes |
Alert me of new notes |
CANSLIM.net Company Profile |
SEC |
Zacks Reports |
StockTalk |
News |
Chart |
Request a new note
C
A N
S L
I M
|
CELG
-
NASDAQ
Celgene Corp
DRUGS - Drug Manufacturers - Major
|
$124.55
|
+1.46
1.19% |
$125.42
|
2,545,847
84.46% of 50 DAV
50 DAV is 3,014,300
|
$131.82
-5.51%
|
3/27/2013
|
$113.24
|
PP = $115.54
|
|
MB = $121.32
|
Most Recent Note - 5/28/2013 4:03:58 PM
G - Still consolidating above its 50 DMA line after encountering distributional pressure. A violation of its 50 DMA line (now $119.76) would raise concerns and trigger a technical sell signal. It is extended from any sound base pattern, yet may go on to produce more climactic gains.
>>> The latest Featured Stock Update with an annotated graph appeared on 5/13/2013. Click here.
View all notes |
Alert me of new notes |
CANSLIM.net Company Profile |
SEC |
Zacks Reports |
StockTalk |
News |
Chart |
Request a new note
C
A N
S L
I M
|
EQM
-
NYSE
E Q T Midstream Partners
ENERGY - Oil and Gas Pipelines
|
$49.60
|
+0.10
0.20% |
$50.19
|
216,342
218.97% of 50 DAV
50 DAV is 98,800
|
$51.72
-4.10%
|
4/25/2013
|
$40.16
|
PP = $40.84
|
|
MB = $42.88
|
Most Recent Note - 5/29/2013 12:20:32 PM
G - Churning above average volume today while retreating after a "negative reversal" on the prior session broke a streak of 8 consecutive small gains. It is extended from its latest base and well above its 50 DMA line defining important near-term chart support.
>>> The latest Featured Stock Update with an annotated graph appeared on 5/16/2013. Click here.
View all notes |
Alert me of new notes |
CANSLIM.net Company Profile |
SEC |
Zacks Reports |
StockTalk |
News |
Chart |
Request a new note
C
A N
S L
I M
|
FLT
-
NYSE
Fleetcor Technologies
DIVERSIFIED SERVICES - Business/Management Services
|
$87.39
|
+1.48
1.72% |
$88.83
|
696,315
75.59% of 50 DAV
50 DAV is 921,200
|
$87.45
-0.07%
|
5/29/2013
|
$86.02
|
PP = $85.66
|
|
MB = $89.94
|
Most Recent Note - 5/29/2013 12:32:33 PM
Y- Color code is changed to yellow with new pivot point cited based on its 5/03/13 high while now rising from an advanced "3-weeks tight" base. It may go on to produce more climactic gains, however this is a riskier "late-stage" base. Hit a new 52-week high with today's 4th consecutive gain on ever-increasing volume. Its 50 DMA line defines support where a violation would raise concerns and trigger a technical sell signal.
>>> The latest Featured Stock Update with an annotated graph appeared on 5/8/2013. Click here.
View all notes |
Alert me of new notes |
CANSLIM.net Company Profile |
SEC |
Zacks Reports |
StockTalk |
News |
Chart |
Request a new note
C
A N
S L
I M
|
Symbol/Exchange
Company Name
Industry Group |
PRICE |
CHANGE
(%Change) |
Day High |
Volume
(% DAV)
(% 50 day avg vol) |
52 Wk Hi
% From Hi |
Featured
Date |
Price
Featured |
Pivot Featured |
|
Max Buy |
LOPE
-
NASDAQ
Grand Canyon Education
DIVERSIFIED SERVICES - Education and; Training Services
|
$32.71
|
+0.43
1.33% |
$32.72
|
184,112
45.75% of 50 DAV
50 DAV is 402,400
|
$34.07
-3.99%
|
5/10/2013
|
$29.03
|
PP = $27.28
|
|
MB = $28.64
|
Most Recent Note - 5/28/2013 5:50:07 PM
G - Perched at its 52-week high, very extended from its previous base. Prior highs in the $27 area define support to watch on pullbacks. Gains of greater than +20% in the first 2-3 weeks following its "breakaway gap" suggest holding for a minimum of 8 week under the fact-based investment system's rules.
>>> The latest Featured Stock Update with an annotated graph appeared on 5/10/2013. Click here.
View all notes |
Alert me of new notes |
CANSLIM.net Company Profile |
SEC |
Zacks Reports |
StockTalk |
News |
Chart |
Request a new note
C
A N
S L
I M
|
MRLN
-
NASDAQ
Marlin Business Services
DIVERSIFIED SERVICES - Rental and Leasing Services
|
$23.90
|
+0.11
0.46% |
$24.00
|
5,710
24.19% of 50 DAV
50 DAV is 23,600
|
$25.97
-7.97%
|
3/15/2013
|
$22.29
|
PP = $23.18
|
|
MB = $24.34
|
Most Recent Note - 5/28/2013 12:43:33 PM
Y - Trading further above its 50 DMA line with today's 3rd consecutive gain backed by ever-increasing volume. The rebound above that important short-term average on Friday helped its technical stance and outlook improve.
>>> The latest Featured Stock Update with an annotated graph appeared on 5/23/2013. Click here.
View all notes |
Alert me of new notes |
CANSLIM.net Company Profile |
SEC |
Zacks Reports |
StockTalk |
News |
Chart |
Request a new note
C
A N
S L
I M
|
NSM
-
NYSE
Nationstar Mtg Hldgs Inc
FINANCIAL SERVICES - Credit Services
|
$42.27
|
+1.49
3.65% |
$42.77
|
1,297,382
97.18% of 50 DAV
50 DAV is 1,335,000
|
$46.91
-9.89%
|
5/7/2013
|
$39.71
|
PP = $42.34
|
|
MB = $44.46
|
Most Recent Note - 5/30/2013 4:53:52 PM
Y - Halted its slide with a gain on average volume today. A streak of 6 consecutive losses marked by above average volume negated its prior breakout and raised concerns.
>>> The latest Featured Stock Update with an annotated graph appeared on 5/28/2013. Click here.
View all notes |
Alert me of new notes |
CANSLIM.net Company Profile |
SEC |
Zacks Reports |
StockTalk |
News |
Chart |
Request a new note
C
A N
S L
I M
|
PRAA
-
NASDAQ
Portfolio Recovery Assoc
DIVERSIFIED SERVICES - Business/Management Services
|
$152.01
|
+1.18
0.78% |
$153.25
|
51,709
76.61% of 50 DAV
50 DAV is 67,500
|
$153.85
-1.20%
|
5/1/2013
|
$130.77
|
PP = $127.88
|
|
MB = $134.27
|
Most Recent Note - 5/30/2013 4:55:19 PM
G - Edged higher with below average volume today for a 4th consecutive gain and its best-ever close. Very extended from prior highs in the $127 area and well above its 50 DMA line defining important chart support.
>>> The latest Featured Stock Update with an annotated graph appeared on 5/22/2013. Click here.
View all notes |
Alert me of new notes |
CANSLIM.net Company Profile |
SEC |
Zacks Reports |
StockTalk |
News |
Chart |
Request a new note
C
A N
S L
I M
|
PRLB
-
NYSE
Proto Labs Inc
MANUFACTURING - Small Tools and Accessories
|
$55.41
|
+1.91
3.57% |
$55.43
|
293,142
52.13% of 50 DAV
50 DAV is 562,300
|
$59.84
-7.40%
|
5/3/2013
|
$54.77
|
PP = $54.01
|
|
MB = $56.71
|
Most Recent Note - 5/30/2013 4:57:28 PM
Y - Finished near its session high with a gain today on light volume, rebounding above its pivot point. Stayed well above its 50 DMA line after slumping back into its prior base.
>>> The latest Featured Stock Update with an annotated graph appeared on 5/24/2013. Click here.
View all notes |
Alert me of new notes |
CANSLIM.net Company Profile |
SEC |
Zacks Reports |
StockTalk |
News |
Chart |
Request a new note
C
A N
S L
I M
|
Symbol/Exchange
Company Name
Industry Group |
PRICE |
CHANGE
(%Change) |
Day High |
Volume
(% DAV)
(% 50 day avg vol) |
52 Wk Hi
% From Hi |
Featured
Date |
Price
Featured |
Pivot Featured |
|
Max Buy |
RRTS
-
NYSE
Roadrunner Trans Systems
TRANSPORTATION - Air Delivery and Freight Service
|
$27.77
|
+0.14
0.51% |
$27.87
|
124,958
60.48% of 50 DAV
50 DAV is 206,600
|
$28.00
-0.82%
|
4/3/2013
|
$22.77
|
PP = $23.75
|
|
MB = $24.94
|
Most Recent Note - 5/28/2013 5:45:55 PM
G - Today's 4th consecutive gain while led to a best-ever close, getting more extended from its latest base. Prior highs in the $23 area define initial support to watch above its 50 DMA line. Fundamental concerns were raised by its sub par earnings increase in the Mar '13 quarter, below the +25% minimum guideline (C criteria).
>>> The latest Featured Stock Update with an annotated graph appeared on 5/14/2013. Click here.
View all notes |
Alert me of new notes |
CANSLIM.net Company Profile |
SEC |
Zacks Reports |
StockTalk |
News |
Chart |
Request a new note
C
A N
S L
I M
|
VRX
-
NYSE
Valeant Pharmaceuticals
DRUGS - Drug Manufacturers - Other
|
$91.00
|
+0.19
0.21% |
$91.75
|
1,590,575
85.34% of 50 DAV
50 DAV is 1,863,800
|
$96.25
-5.45%
|
4/30/2013
|
$60.24
|
PP = $76.66
|
|
MB = $80.49
|
Most Recent Note - 5/29/2013 1:03:56 PM
G- Perched at its all-time high following 2 consecutive volume-driven gains, extended from prior highs. Announced plans to buy Bausch & Lomb for $8.7 billion. Prior reports cautioned - "Sub par earnings for the Mar '13 quarter below the +25% minimum guideline (C criteria) raised fundamental concerns."
>>> The latest Featured Stock Update with an annotated graph appeared on 5/17/2013. Click here.
View all notes |
Alert me of new notes |
CANSLIM.net Company Profile |
SEC |
Zacks Reports |
StockTalk |
News |
Chart |
Request a new note
C
A N
S L
I M
|
|
|
|
THESE ARE NOT BUY RECOMMENDATIONS!
Comments contained in the body of this report are technical
opinions only. The material herein has been obtained
from sources believed to be reliable and accurate, however,
its accuracy and completeness cannot be guaranteed.
This site is not an investment advisor, hence it does
not endorse or recommend any securities or other investments.
Any recommendation contained in this report may not
be suitable for all investors and it is not to be deemed
an offer or solicitation on our part with respect to
the purchase or sale of any securities. All trademarks,
service marks and trade names appearing in this report
are the property of their respective owners, and are
likewise used for identification purposes only.
This report is a service available
only to active Paid Premium Members.
You may opt-out of receiving report notifications
at any time. Questions or comments may be submitted
by writing to Premium Membership Services 665 S.E. 10 Street, Suite 201 Deerfield Beach, FL 33441-5634 or by calling 1-800-965-8307
or 954-785-1121.
|
|
|

