You are not logged in.
This means you
CAN ONLY VIEW reports that were published prior to Monday, April 14, 2025.
You
MUST UPGRADE YOUR MEMBERSHIP if you want to see any current reports.
AFTER MARKET UPDATE - WEDNESDAY, MAY 30TH, 2012
Previous After Market Report Next After Market Report >>>
|
|
|
|
DOW |
-160.83 |
12,419.86 |
-1.28% |
|
Volume |
768,568,730 |
+8% |
|
Volume |
1,599,450,570 |
-0% |
|
NASDAQ |
-33.63 |
2,837.36 |
-1.17% |
|
Advancers |
398 |
13% |
|
Advancers |
535 |
20% |
|
S&P 500 |
-19.10 |
1,313.32 |
-1.43% |
|
Decliners |
2,680 |
85% |
|
Decliners |
2,006 |
76% |
|
Russell 2000 |
-15.16 |
762.00 |
-1.95% |
|
52 Wk Highs |
26 |
|
|
52 Wk Highs |
24 |
|
|
S&P 600 |
-8.38 |
428.42 |
-1.92% |
|
52 Wk Lows |
70 |
|
|
52 Wk Lows |
70 |
|
|
 |
Major Averages Slumped Instead of Confirming Rally
Kenneth J. Gruneisen - Passed the CAN SLIM® Master's Exam
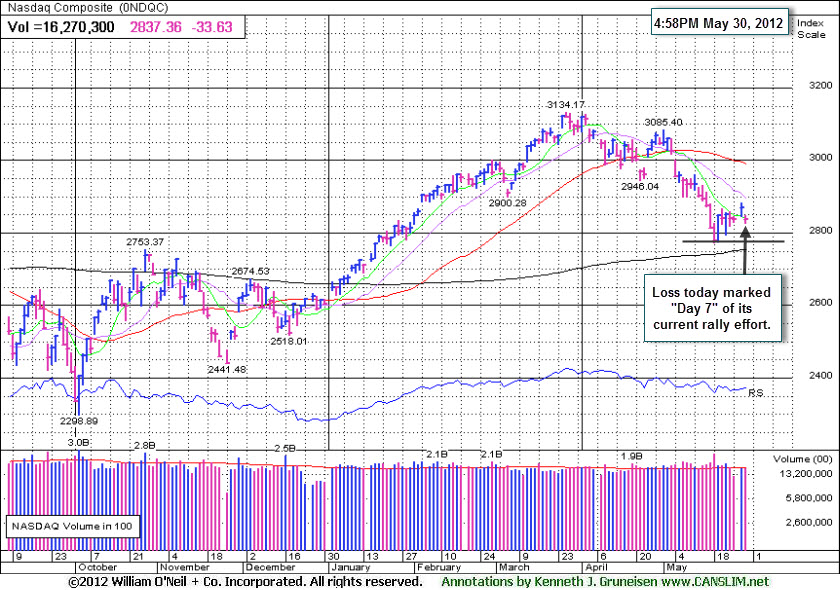
Wednesday's session brought unanimous losses for the Dow Jones Industrial Average, S&P 500 Index, and the Nasdaq Composite Index. The damaging losses on "Day 7" were not large enough to end the current rally attempt, but they were the opposite of the confirming gains disciplined investors are still awaiting. Volume was reported near the prior session total on the Nasdaq exchange and higher on the NYSE versus the prior session's totals. Breadth was solidly negative as decliners led advancers by more than 6-1 on the NYSE and by almost 4-1 on the Nasdaq exchange. New 52-week lows easily outnumbered new 52-week highs on the NYSE and on the Nasdaq exchange. There were 11 high-ranked companies from the CANSLIM.net Leaders List that made new 52-week highs and appeared on the CANSLIM.net BreakOuts Page, down from the prior session total of 25 stocks. Investors watching for a follow-through day in the days and weeks ahead should be aware that an expansion in the number of stocks hitting new 52-week highs is an important component to any new confirmed rally. There were gains for 5 of the 20 high-ranked companies currently included on the Featured Stocks Page.
The major averages are sharply lower amid fears over Europe's debt crisis after a poll showed most Greeks favored revised bailout terms. Concerns over Spanish banks and dampened expectations for additional stimulus by China also weighed on investor sentiment.
Energy stocks are pacing the market lower. Chevron Corp (CVX -2.60%) was down as the price of oil dropped over -3.5% to fall below $88.00 per barrel. Industrials and financials were called lower with Caterpillar Inc (CAT -2.53%) and Citigroup Inc (C -3.77%) losing ground. Homebuilders retreated with Lennar Corp (LEN -6.71%) falling after a report showed pending home sales fell -5.5% in April. Over in tech, Research In Motion Ltd (RIMM -7.83%) slumped after the Blackberry maker unexpectedly announced an operating loss and said it hired bankers to review strategic alternatives. Monsanto Co (MON +2.22%) was a bright spot, up after the seed company increased its third-quarter forecast.
European markets finished lower with the FTSE down -1.7% in London and the DAX -1.8% lower in Germany. The 10-year note rallied over a point, taking its yield down to a record low of 1.62%.
Wednesday marked "Day 7" of a new rally effort that remains intact for the Nasdaq Composite Index provided that its Day 1 low (2,774.76) is not undercut. The S&P 500 Index, the benchmark index, held its ground after dipping at Wednesday's intra-day low to within 1 point of its 5/21/12 low (1,295.73).
Historical studies suggest that the most constructive market rallies produced a solid follow-through day (FTD) between Days 4-7 of a new rally effort. Although that did not happen, the window is still open for a new confirmed rally to present itself, and such technical proof may give fact-based investors the clearance to begin with new buying efforts only in sound candidates. Meanwhile, investors should keep up a watchlist of worthy buy candidates while remaining protective of capital. The major averages (M criteria) are technically still considered to be in a "correction" and stocks remain vulnerable to much greater downside. Ideally, a follow-through day (FTD) of additional confirming gains of +1.4% or greater by either the Nasdaq Composite Index or the S&P 500 Index, backed by higher volume, and coupled with an expansion in the number of stocks hitting new highs, would "confirm" a new rally.
PICTURED: The Nasdaq Composite Index's loss today marked "Day 7" of its current rally effort.
|
 Kenneth J. Gruneisen started out as a licensed stockbroker in August 1987, a couple of months prior to the historic stock market crash that took the Dow Jones Industrial Average down -22.6% in a single day. He has published daily fact-based fundamental and technical analysis on high-ranked stocks online for two decades. Through FACTBASEDINVESTING.COM, Kenneth provides educational articles, news, market commentary, and other information regarding proven investment systems that work in good times and bad.
Comments contained in the body of this report are technical opinions only and are not necessarily those of Gruneisen Growth Corp. The material herein has been obtained from sources believed to be reliable and accurate, however, its accuracy and completeness cannot be guaranteed. Our firm, employees, and customers may effect transactions, including transactions contrary to any recommendation herein, or have positions in the securities mentioned herein or options with respect thereto. Any recommendation contained in this report may not be suitable for all investors and it is not to be deemed an offer or solicitation on our part with respect to the purchase or sale of any securities. |
|
 |
Energy-Related Groups Fell Hardest
Kenneth J. Gruneisen - Passed the CAN SLIM® Master's Exam
Weakness in energy-related shares led to big losses for the Oil Services Index ($OSX -3.93%) and the Integrated Oil Index ($XOI -2.70%). Financial shares also were a negative influence on the major averages as the Bank Index ($BKX -2.46%) and Broker/Dealer Index ($XBD -2.31%) fell for big losses. The tech sector saw unanimous losses from the Networking Index ($NWX -2.30%), Internet Index ($IIX -2.10%), Semiconductor Index ($SOX -1.96%), and the Biotechnology Index ($BTK -0.95%). The Retail Index ($RLX -1.60%) and Healthcare Index ($HMO -1.01%) also slumped on Wednesday's widely negative session, meanwhile the Gold & Silver Index ($XAU -0.19%) was able to hold its ground better than most other groups.
Charts courtesy www.stockcharts.com
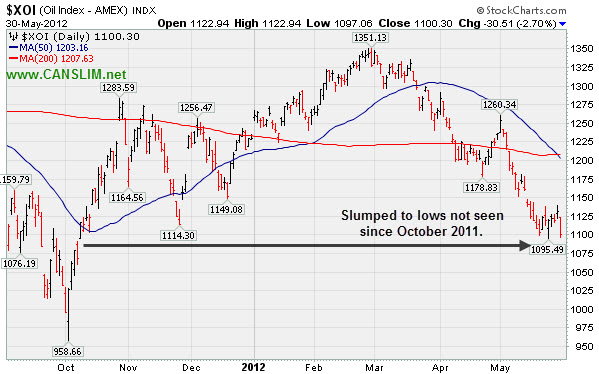
PICTURED: The Integrated Oil Index ($XOI -2.70%) slumped to lows not seen since October 2011.
| Oil Services |
$OSX |
204.12 |
-8.35 |
-3.93% |
-5.62% |
| Healthcare |
$HMO |
2,314.72 |
-23.53 |
-1.01% |
+1.45% |
| Integrated Oil |
$XOI |
1,100.30 |
-30.51 |
-2.70% |
-10.48% |
| Semiconductor |
$SOX |
372.20 |
-7.46 |
-1.96% |
+2.13% |
| Networking |
$NWX |
206.35 |
-4.86 |
-2.30% |
-4.09% |
| Internet |
$IIX |
293.71 |
-6.29 |
-2.10% |
+4.25% |
| Broker/Dealer |
$XBD |
85.76 |
-2.02 |
-2.31% |
+2.99% |
| Retail |
$RLX |
603.66 |
-9.79 |
-1.60% |
+15.38% |
| Gold & Silver |
$XAU |
155.36 |
-0.30 |
-0.19% |
-13.99% |
| Bank |
$BKX |
43.62 |
-1.10 |
-2.46% |
+10.77% |
| Biotech |
$BTK |
1,447.04 |
-13.90 |
-0.95% |
+32.58% |
|
|
|
 |
Overhead Supply Created While Consolidating in Recent Months
Kenneth J. Gruneisen - Passed the CAN SLIM® Master's Exam
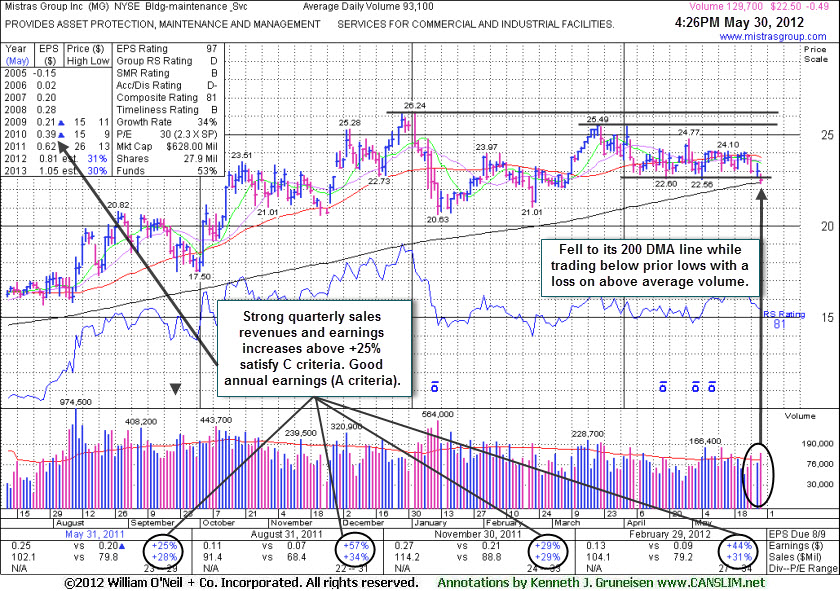
Mistras Group Inc (MG -$0.49 or -2.13% to $22.50) suffered another loss today with volume picking up to an above average pace. It slumped and traded under prior lows and tested its 200-day moving average (DMA) line defining important near-term support in the $22.50 area. While it may make a stand there and eventually show strength, its persistent lack of constructive gains is cause for concern. It now faces overhead supply up through the $25-26 area after spending several months trading at higher levels. Disciplined investors will note that a volume-driven gain above its pivot did not confirm a technical buy signal as necessary before taking any action. Based on its weak action it will be dropped from the Featured Stocks list tonight.
Its last appearance in this FSU section was on 4/02/12 with an annotated weekly graph under the headline, "Lack of Leadership in Group During Recent Set-Up". Since then it spent many week trading in a tight range while it was repeatedly noted - "A volume-driven gain above its recent chart high ($25.49 on 3/21/12) may help trigger a proper technical buy signal after a new base formation, however no new (lower) pivot point is currently being cited, and it may continue encountering stubborn resistance."
Fundamentals remain strong, with quarterly earnings increases above the +25% minimum guideline satisfying the C criteria. The number of top-rated funds owning its shares rose from 148 in Jun '11 to 185 in Mar '12, a reassuring sign concerning the I criteria.
The Building - Maintenance Services group has seen its Group Relative Strength Rating slump even further to 22. That is not a reassuring sign concerning the L criteria which calls investors to choose buy candidates with strong leadership in the industry group. The company management's still large 47% ownership interest keeps them very motivated to look after and build shareholder value. The small supply (S criteria) of only 27.9 million shares outstanding and 14.8 million in the public float can contribute to greater price volatility in the event of institutional buying or selling.
|
|
|
Color Codes Explained :
Y - Better candidates highlighted by our
staff of experts.
G - Previously featured
in past reports as yellow but may no longer be buyable under the
guidelines.
***Last / Change / Volume data in this table is the closing quote data***
Symbol/Exchange
Company Name
Industry Group |
PRICE |
CHANGE
(%Change) |
Day High |
Volume
(% DAV)
(% 50 day avg vol) |
52 Wk Hi
% From Hi |
Featured
Date |
Price
Featured |
Pivot Featured |
|
Max Buy |
ACN
-
NYSE
Accenture Plc
DIVERSIFIED SERVICES - Business/Management Services
|
$57.72
|
-0.69
-1.18% |
$58.27
|
3,101,295
83.52% of 50 DAV
50 DAV is 3,713,100
|
$65.89
-12.40%
|
3/23/2012
|
$64.13
|
PP = $63.76
|
|
MB = $66.95
|
Most Recent Note - 5/29/2012 4:00:32 PM
G - Consolidating just above support at its longer-term 200 DMA line. Triggered technical sell signals with its recent losses undercutting prior highs in the $62-63 area and violating its 50 DMA line.
>>> The latest Featured Stock Update with an annotated graph appeared on 5/22/2012. Click here.
View all notes |
Alert me of new notes |
CANSLIM.net Company Profile |
SEC |
Zacks Reports |
StockTalk |
News |
Chart |
Request a new note
C
A N
S L
I M


|
ALXN
-
NASDAQ
Alexion Pharmaceuticals
DRUGS - Drug Manufacturers - Other
|
$91.69
|
-0.38
-0.41% |
$92.06
|
1,935,816
99.41% of 50 DAV
50 DAV is 1,947,400
|
$95.01
-3.49%
|
5/1/2012
|
$91.73
|
PP = $95.11
|
|
MB = $99.87
|
Most Recent Note - 5/29/2012 4:31:49 PM
Y - Completed a new Public Offering on 5/25/12 and it is consolidating above its 50 DMA line. Volume-driven gains to new highs may trigger a technical buy signal. Faces little resistance in the $94-95 area.
>>> The latest Featured Stock Update with an annotated graph appeared on 4/16/2012. Click here.
View all notes |
Alert me of new notes |
CANSLIM.net Company Profile |
SEC |
Zacks Reports |
StockTalk |
News |
Chart |
Request a new note
C
A N
S L
I M
|
ARBA
-
NASDAQ
Accenture Plc
INTERNET - Internet Software and Services
|
$44.96
|
-0.02
-0.04% |
$45.14
|
3,681,364
99.15% of 50 DAV
50 DAV is 3,713,100
|
$45.48
-1.14%
|
4/27/2012
|
$38.53
|
PP = $37.24
|
|
MB = $39.10
|
Most Recent Note - 5/29/2012 4:33:06 PM
G - Still holding its ground since tallying a considerable gain on 5/22/12 with heavy volume on news it will be bought by SAP in a $4.3 billion deal. The stock quickly got extended from its prior base after a quiet consolidation above chart support at its 50 DMA line and prior highs.
>>> The latest Featured Stock Update with an annotated graph appeared on 4/30/2012. Click here.
View all notes |
Alert me of new notes |
CANSLIM.net Company Profile |
SEC |
Zacks Reports |
StockTalk |
News |
Chart |
Request a new note
C
A N
S L
I M
|
CERN
-
NASDAQ
Cerner Corp
COMPUTER SOFTWARE and SERVICES - Healthcare Information Service
|
$79.70
|
+0.02
0.03% |
$80.00
|
1,169,054
98.37% of 50 DAV
50 DAV is 1,188,400
|
$84.10
-5.23%
|
4/27/2012
|
$77.23
|
PP = $78.63
|
|
MB = $82.56
|
Most Recent Note - 5/29/2012 4:35:13 PM
Y - Found prompt support near its 50 DMA line after a prior loss negated its recent technical breakout. Volume totals have been cooling while hovering within close striking distance of its 52-week high.
>>> The latest Featured Stock Update with an annotated graph appeared on 5/1/2012. Click here.
View all notes |
Alert me of new notes |
CANSLIM.net Company Profile |
SEC |
Zacks Reports |
StockTalk |
News |
Chart |
Request a new note
C
A N
S L
I M
|
CMCSA
-
NASDAQ
Comcast Corp Cl A
MEDIA - CATV Systems
|
$28.95
|
-0.27
-0.92% |
$29.17
|
10,299,776
82.59% of 50 DAV
50 DAV is 12,470,600
|
$30.88
-6.23%
|
5/2/2012
|
$30.04
|
PP = $30.51
|
|
MB = $32.04
|
Most Recent Note - 5/29/2012 4:38:39 PM
G - Gains have lacked volume conviction since slumping under its 50 DMA line and undercutting the prior low ($28.54 on 4/10/12). A rebound above its short-term average would help its technical stance and near-term outlook improve.
>>> The latest Featured Stock Update with an annotated graph appeared on 5/7/2012. Click here.
View all notes |
Alert me of new notes |
CANSLIM.net Company Profile |
SEC |
Zacks Reports |
StockTalk |
News |
Chart |
Request a new note
C
A N
S L
I M
|
Symbol/Exchange
Company Name
Industry Group |
PRICE |
CHANGE
(%Change) |
Day High |
Volume
(% DAV)
(% 50 day avg vol) |
52 Wk Hi
% From Hi |
Featured
Date |
Price
Featured |
Pivot Featured |
|
Max Buy |
COO
-
NYSE
Cooper Companies Inc
HEALTH SERVICES - Medical Instruments and Supplies
|
$85.33
|
-0.39
-0.45% |
$85.87
|
440,514
106.64% of 50 DAV
50 DAV is 413,100
|
$89.31
-4.46%
|
3/9/2012
|
$83.05
|
PP = $81.02
|
|
MB = $85.07
|
Most Recent Note - 5/29/2012 4:39:31 PM
G - Still consolidating above prior highs in the $83-84 area and above its 50 DMA line, important near-term support. A subsequent violation may trigger a worrisome sell signal.
>>> The latest Featured Stock Update with an annotated graph appeared on 5/18/2012. Click here.
View all notes |
Alert me of new notes |
CANSLIM.net Company Profile |
SEC |
Zacks Reports |
StockTalk |
News |
Chart |
Request a new note
C
A N
S L
I M
|
DG
-
NYSE
Dollar General Corp
RETAIL - Discount, Variety Stores
|
$48.56
|
+0.50
1.04% |
$48.59
|
3,013,841
110.24% of 50 DAV
50 DAV is 2,734,000
|
$48.76
-0.41%
|
5/7/2012
|
$48.51
|
PP = $47.69
|
|
MB = $50.07
|
Most Recent Note - 5/29/2012 4:42:18 PM
Y - Rebounded further above its 50 DMA line today and finished near its best-ever close. Its color code is changed to yellow based on recent resilience.
>>> The latest Featured Stock Update with an annotated graph appeared on 5/9/2012. Click here.
View all notes |
Alert me of new notes |
CANSLIM.net Company Profile |
SEC |
Zacks Reports |
StockTalk |
News |
Chart |
Request a new note
C
A N
S L
I M
|
EXPE
-
NASDAQ
Expedia Inc
INTERNET - Internet Information Providers
|
$45.46
|
+0.16
0.35% |
$46.34
|
4,456,044
99.20% of 50 DAV
50 DAV is 4,492,100
|
$46.07
-1.32%
|
4/27/2012
|
$41.80
|
PP = $35.57
|
|
MB = $37.35
|
Most Recent Note - 5/29/2012 4:46:07 PM
G - Held its ground near its 52-week high today. As previously noted, heavy volume behind a considerable gain on 5/23/12 technically helped it break out from an advanced "3-weeks tight" base with no resistance remaining due to overhead supply, however no new pivot point was cited. Until the market confirms a new rally with a solid follow through day from at least one of the major averages (M criteria) the fact-based investment system argues against new buying efforts in any stocks.
>>> The latest Featured Stock Update with an annotated graph appeared on 5/3/2012. Click here.
View all notes |
Alert me of new notes |
CANSLIM.net Company Profile |
SEC |
Zacks Reports |
StockTalk |
News |
Chart |
Request a new note
C
A N
S L
I M
|
GNC
-
NYSE
G N C Holdings Inc
RETAIL - Drug Stores
|
$38.91
|
-0.63
-1.59% |
$39.20
|
1,105,973
58.45% of 50 DAV
50 DAV is 1,892,200
|
$41.95
-7.25%
|
1/19/2012
|
$28.99
|
PP = $29.60
|
|
MB = $31.08
|
Most Recent Note - 5/29/2012 4:47:20 PM
G - Hovering within close striking distance of its 52-week high today. Found support near prior highs and its 50 DMA line while recently consolidating. Reported earnings +82% on +23% sales revenues for the quarter ended March 31, 2012 versus the year ago period.
>>> The latest Featured Stock Update with an annotated graph appeared on 4/26/2012. Click here.
View all notes |
Alert me of new notes |
CANSLIM.net Company Profile |
SEC |
Zacks Reports |
StockTalk |
News |
Chart |
Request a new note
C
A N
S L
I M
|
MG
-
NYSE
Mistras Group Inc
DIVERSIFIED SERVICES - Bulding and Faci;ity Management Services
|
$22.50
|
-0.49
-2.13% |
$22.85
|
131,992
141.77% of 50 DAV
50 DAV is 93,100
|
$26.24
-14.25%
|
3/22/2012
|
$24.96
|
PP = $26.34
|
|
MB = $27.66
|
 Most Recent Note - 5/30/2012 4:57:31 PM
Suffered another loss today with volume picking up to an above average pace. Disciplined investors will note that a volume-driven gain above its pivot did not confirm a technical buy signal as necessary before taking any action. Based on its weak action it will be dropped from the Featured Stocks list tonight. See the latest FSU analysis for more details and a new annotated graph.
>>> The latest Featured Stock Update with an annotated graph appeared on 5/30/2012. Click here.
View all notes |
Alert me of new notes |
CANSLIM.net Company Profile |
SEC |
Zacks Reports |
StockTalk |
News |
Chart |
Request a new note
C
A N
S L
I M
|
Symbol/Exchange
Company Name
Industry Group |
PRICE |
CHANGE
(%Change) |
Day High |
Volume
(% DAV)
(% 50 day avg vol) |
52 Wk Hi
% From Hi |
Featured
Date |
Price
Featured |
Pivot Featured |
|
Max Buy |
NTES
-
NASDAQ
Netease Inc Adr
INTERNET - Internet Information Providers
|
$61.42
|
+0.73
1.20% |
$61.80
|
662,108
89.02% of 50 DAV
50 DAV is 743,800
|
$63.07
-2.62%
|
3/19/2012
|
$56.18
|
PP = $55.10
|
|
MB = $57.86
|
Most Recent Note - 5/29/2012 4:49:45 PM
G - Rebounded back above its 50 DMA line and finished at a new high close with above average volume behind its solid gain today. Recent lows near the $55 area define important chart support to watch where a violation may trigger a worrisome technical sell signal.
>>> The latest Featured Stock Update with an annotated graph appeared on 5/24/2012. Click here.
View all notes |
Alert me of new notes |
CANSLIM.net Company Profile |
SEC |
Zacks Reports |
StockTalk |
News |
Chart |
Request a new note
C
A N
S L
I M
|
SWI
-
NYSE
Solarwinds Inc
COMPUTER SOFTWARE and SERVICES - Application Software
|
$46.28
|
-1.84
-3.82% |
$47.58
|
834,504
73.30% of 50 DAV
50 DAV is 1,138,500
|
$48.64
-4.85%
|
4/26/2012
|
$45.15
|
PP = $42.32
|
|
MB = $44.44
|
Most Recent Note - 5/30/2012 2:03:41 PM
G - Small gap down today from a best-ever close and new all-time high hit on the prior session. It did not form a sound new base of sufficient length.
>>> The latest Featured Stock Update with an annotated graph appeared on 5/21/2012. Click here.
View all notes |
Alert me of new notes |
CANSLIM.net Company Profile |
SEC |
Zacks Reports |
StockTalk |
News |
Chart |
Request a new note
C
A N
S L
I M
|
SXCI
-
NASDAQ
S X C Health Solutions
COMPUTER SOFTWARE and SERVICES - Healthcare Information Service
|
$88.74
|
-2.60
-2.85% |
$90.94
|
1,228,434
110.32% of 50 DAV
50 DAV is 1,113,500
|
$100.50
-11.70%
|
2/23/2012
|
$68.24
|
PP = $66.05
|
|
MB = $69.35
|
Most Recent Note - 5/30/2012 2:06:42 PM
G - Down today with higher volume (but still below average), consolidating above its recent lows and above its 50 DMA line ($84.71) defining important support to watch. Volume totals have been cooling while still holding its ground in a tight range. Completed a new Public Offering on 5/10/12. Consolidating in a tight range since it posted huge volume-driven gains on 4/18 and 4/19 while rallying on M&A news.
>>> The latest Featured Stock Update with an annotated graph appeared on 5/17/2012. Click here.
View all notes |
Alert me of new notes |
CANSLIM.net Company Profile |
SEC |
Zacks Reports |
StockTalk |
News |
Chart |
Request a new note
C
A N
S L
I M
|
TDG
-
NYSE
Transdigm Group Inc
AEROSPACE/DEFENSE - Aerospace/Defense Products and; Services
|
$123.33
|
-3.01
-2.38% |
$125.89
|
506,660
103.63% of 50 DAV
50 DAV is 488,900
|
$132.69
-7.05%
|
2/29/2012
|
$120.10
|
PP = $118.93
|
|
MB = $124.88
|
Most Recent Note - 5/30/2012 2:07:49 PM
G - Pulling back on lighter volume today following a gain on the prior session backed by above average volume. Recently found prompt support at its 50 DMA line and near prior highs.
>>> The latest Featured Stock Update with an annotated graph appeared on 5/23/2012. Click here.
View all notes |
Alert me of new notes |
CANSLIM.net Company Profile |
SEC |
Zacks Reports |
StockTalk |
News |
Chart |
Request a new note
C
A N
S L
I M
|
TNGO
-
NASDAQ
Tangoe Inc
COMPUTER SOFTWARE and SERVICES - Technical and System Software
|
$20.04
|
-0.60
-2.91% |
$20.58
|
556,108
84.40% of 50 DAV
50 DAV is 658,900
|
$23.05
-13.06%
|
3/27/2012
|
$19.35
|
PP = $20.00
|
|
MB = $21.00
|
Most Recent Note - 5/30/2012 2:10:35 PM
G - Volume is light today thus far but concerns are being raised while quietly slumping below prior highs in the $20 area and below important support at its 50 DMA line. The M criteria argues against new buying efforts in any stocks until a new rally is confirmed with a solid follow-through day by at least one of the major averages.
>>> The latest Featured Stock Update with an annotated graph appeared on 5/25/2012. Click here.
View all notes |
Alert me of new notes |
CANSLIM.net Company Profile |
SEC |
Zacks Reports |
StockTalk |
News |
Chart |
Request a new note
C
A N
S L
I M
|
Symbol/Exchange
Company Name
Industry Group |
PRICE |
CHANGE
(%Change) |
Day High |
Volume
(% DAV)
(% 50 day avg vol) |
52 Wk Hi
% From Hi |
Featured
Date |
Price
Featured |
Pivot Featured |
|
Max Buy |
TSCO
-
NASDAQ
Tractor Supply Co
SPECIALTY RETAIL - Specialty Retail, Other
|
$89.52
|
-2.95
-3.19% |
$92.00
|
2,280,399
230.48% of 50 DAV
50 DAV is 989,400
|
$101.20
-11.54%
|
5/1/2012
|
$98.38
|
PP = $101.30
|
|
MB = $106.37
|
Most Recent Note - 5/30/2012 2:11:33 PM
G - Down again today with above average volume. On the prior session it violated its 50 DMA line, triggering a technical sell signal with a damaging loss with more than 4 times average volume. It did not trigger a new (or add-on) technical buy signal in recent weeks.
>>> The latest Featured Stock Update with an annotated graph appeared on 4/17/2012. Click here.
View all notes |
Alert me of new notes |
CANSLIM.net Company Profile |
SEC |
Zacks Reports |
StockTalk |
News |
Chart |
Request a new note
C
A N
S L
I M
|
UA
-
NYSE
Under Armour Inc Cl A
CONSUMER NON-DURABLES - Textile - Apparel Clothing
|
$100.70
|
-0.06
-0.06% |
$101.07
|
591,740
64.40% of 50 DAV
50 DAV is 918,800
|
$102.86
-2.10%
|
2/15/2012
|
$85.77
|
PP = $84.86
|
|
MB = $89.10
|
Most Recent Note - 5/29/2012 4:56:55 PM
G - Today's 6th consecutive gain was backed by above average volume as it finished near its best-ever close. Concerns were recently raised by weaker fundamentals, its first quarterly earnings increase below the +25% minimum guideline in more than 2 years.
>>> The latest Featured Stock Update with an annotated graph appeared on 5/29/2012. Click here.
View all notes |
Alert me of new notes |
CANSLIM.net Company Profile |
SEC |
Zacks Reports |
StockTalk |
News |
Chart |
Request a new note
C
A N
S L
I M
|
V
-
NYSE
Visa Inc Cl A
DIVERSIFIED SERVICES - Business/Management Services
|
$117.49
|
-2.79
-2.32% |
$119.74
|
4,585,841
126.84% of 50 DAV
50 DAV is 3,615,500
|
$125.35
-6.27%
|
3/12/2012
|
$116.53
|
PP = $119.46
|
|
MB = $125.43
|
Most Recent Note - 5/30/2012 12:36:00 PM
G - Hovering near its 50 DMA line after volume-driven gains helped it rebound from recent lows. The prior low ($112.50 on 5/18/12) defines important near-term support below its 50 DMA where any subsequent violation may raise more serious concerns and trigger a more worrisome technical sell signal.
>>> The latest Featured Stock Update with an annotated graph appeared on 5/16/2012. Click here.
View all notes |
Alert me of new notes |
CANSLIM.net Company Profile |
SEC |
Zacks Reports |
StockTalk |
News |
Chart |
Request a new note
C
A N
S L
I M
|
VSI
-
NYSE
Vitamin Shoppe Inc
SPECIALTY RETAIL - Specialty Retail, Other
|
$49.66
|
-0.98
-1.94% |
$50.24
|
217,954
46.62% of 50 DAV
50 DAV is 467,500
|
$55.29
-10.18%
|
4/25/2012
|
$47.77
|
PP = $48.46
|
|
MB = $50.88
|
Most Recent Note - 5/29/2012 4:59:08 PM
G - Recent gains have been backed by lighter than average volume as it found some support near its old highs and halted a streak of 5 consecutive losses since a negative reversal at its 52-week high.
>>> The latest Featured Stock Update with an annotated graph appeared on 4/25/2012. Click here.
View all notes |
Alert me of new notes |
CANSLIM.net Company Profile |
SEC |
Zacks Reports |
StockTalk |
News |
Chart |
Request a new note
C
A N
S L
I M
|
WFM
-
NASDAQ
Whole Foods Market Inc
RETAIL - Grocery Stores
|
$89.51
|
+0.16
0.18% |
$89.68
|
2,065,215
127.51% of 50 DAV
50 DAV is 1,619,600
|
$91.50
-2.17%
|
5/3/2012
|
$90.28
|
PP = $86.45
|
|
MB = $90.77
|
Most Recent Note - 5/29/2012 5:00:16 PM
G - Up today with average volume. Found prompt support last week as it rebounded above its 50 DMA line following a streak of 5 consecutive losses which completely negated the latest breakout. It stalled following its considerable "breakaway gap" on 5/03/12.
>>> The latest Featured Stock Update with an annotated graph appeared on 5/11/2012. Click here.
View all notes |
Alert me of new notes |
CANSLIM.net Company Profile |
SEC |
Zacks Reports |
StockTalk |
News |
Chart |
Request a new note
C
A N
S L
I M
|
Symbol/Exchange
Company Name
Industry Group |
PRICE |
CHANGE
(%Change) |
Day High |
Volume
(% DAV)
(% 50 day avg vol) |
52 Wk Hi
% From Hi |
Featured
Date |
Price
Featured |
Pivot Featured |
|
Max Buy |
|
|
|
THESE ARE NOT BUY RECOMMENDATIONS!
Comments contained in the body of this report are technical
opinions only. The material herein has been obtained
from sources believed to be reliable and accurate, however,
its accuracy and completeness cannot be guaranteed.
This site is not an investment advisor, hence it does
not endorse or recommend any securities or other investments.
Any recommendation contained in this report may not
be suitable for all investors and it is not to be deemed
an offer or solicitation on our part with respect to
the purchase or sale of any securities. All trademarks,
service marks and trade names appearing in this report
are the property of their respective owners, and are
likewise used for identification purposes only.
This report is a service available
only to active Paid Premium Members.
You may opt-out of receiving report notifications
at any time. Questions or comments may be submitted
by writing to Premium Membership Services 665 S.E. 10 Street, Suite 201 Deerfield Beach, FL 33441-5634 or by calling 1-800-965-8307
or 954-785-1121.
|
|
|

