You are not logged in.
This means you
CAN ONLY VIEW reports that were published prior to Monday, April 14, 2025.
You
MUST UPGRADE YOUR MEMBERSHIP if you want to see any current reports.
AFTER MARKET UPDATE - WEDNESDAY, MAY 29TH, 2013
Previous After Market Report Next After Market Report >>>
|
|
|
|
DOW |
-106.59 |
15,302.80 |
-0.69% |
|
Volume |
722,905,320 |
-2% |
|
Volume |
1,720,256,630 |
+2% |
|
NASDAQ |
-21.37 |
3,467.52 |
-0.61% |
|
Advancers |
617 |
20% |
|
Advancers |
758 |
29% |
|
S&P 500 |
-11.70 |
1,648.36 |
-0.70% |
|
Decliners |
2,452 |
78% |
|
Decliners |
1,726 |
67% |
|
Russell 2000 |
-10.39 |
986.96 |
-1.04% |
|
52 Wk Highs |
73 |
|
|
52 Wk Highs |
94 |
|
|
S&P 600 |
-6.60 |
553.94 |
-1.18% |
|
52 Wk Lows |
129 |
|
|
52 Wk Lows |
21 |
|
|
 |
Breadth Negtaive as Indices Retreat
Kenneth J. Gruneisen - Passed the CAN SLIM® Master's Exam
The major indices pared losses but ended Wednesday's session in negative territory. The volume totals were reported mixed, higher than prior session total on the Nasdaq exchange and yet slightly lower on the NYSE. Breadth was clearly negative as decliners led advancers by a 4-1 margin on the NYSE and by better than a 2-1 margin on the Nasdaq exchange. There were only 21 high-ranked companies from the CANSLIM.net Leaders List making new 52-week highs and appearing on the CANSLIM.net BreakOuts Page, down from the prior session total of 72 stocks. New 52-week highs outnumbered new 52-week lows on the Nasdaq exchange, however new lows outnumbered new highs on the NYSE. There were gains for 3 of the 13 high-ranked companies currently included on the Featured Stocks Page.
The major averages retreated amid uncertainty over whether the Fed will begin tapering its stimulus efforts. Market weakness was also attributed to concerns over the economic outlook after the OECD reduced its global growth forecast to 3.1% from 3.4%. Stocks moved off the session lows after Boston Fed President Eric Rosengren said in a speech that the central bank should maintain its accommodative monetary policy.
Most S&P 500 sectors were lower on the session led by health care and consumer staples as drug maker Pfizer Inc (PFE -2.52%) and Kimberly-Clark Corp (KMB -4.82%) fell. Tech was the best performing group as Hewlett-Packard Co (HPQ +2.4%) hit a new 52-week high. Smithfield Foods Inc (SFD +28.4%) was up considerably after the pork producer agreed to be acquired by a China-based firm for $4.7 billion.
Treasuries were higher with the 10-year note gaining 14/32 to yield 2.11%.
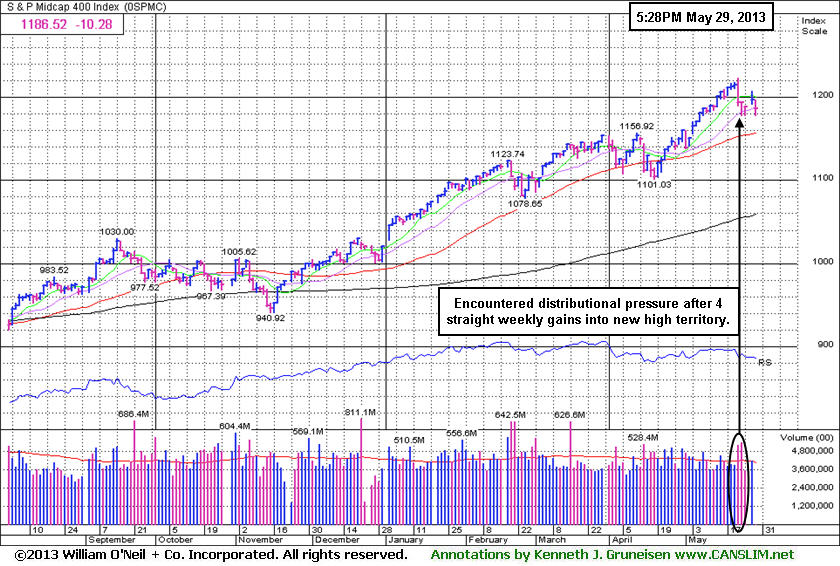
The market (M criteria) uptrend recently lifted the Dow Jones Industrial Average and the S&P 500 Index to new record highs. The indices' rally to new highs confirmed the market's uptrend which means odds are favorable for new buying efforts in stocks meeting all of the fact-based investment system's key criteria. Action-worthy leaders best matching the winning models are covered on an ongoing basis on the Featured Stocks Page - including our Certified experts' latest notes and links to additional resources including detailed analysis with annotated graphs.
The Premium Member Homepage - includes "dynamic archives" to all prior pay reports published. Watch for an announcement via email concerning the next WEBCAST.
PICTURED: The S&P 400 Mid Cap Index encountered distributional pressure along with the rest of the major averages after 4 consecutive weekly gains into new high territory.
|
 Kenneth J. Gruneisen started out as a licensed stockbroker in August 1987, a couple of months prior to the historic stock market crash that took the Dow Jones Industrial Average down -22.6% in a single day. He has published daily fact-based fundamental and technical analysis on high-ranked stocks online for two decades. Through FACTBASEDINVESTING.COM, Kenneth provides educational articles, news, market commentary, and other information regarding proven investment systems that work in good times and bad.
Comments contained in the body of this report are technical opinions only and are not necessarily those of Gruneisen Growth Corp. The material herein has been obtained from sources believed to be reliable and accurate, however, its accuracy and completeness cannot be guaranteed. Our firm, employees, and customers may effect transactions, including transactions contrary to any recommendation herein, or have positions in the securities mentioned herein or options with respect thereto. Any recommendation contained in this report may not be suitable for all investors and it is not to be deemed an offer or solicitation on our part with respect to the purchase or sale of any securities. |
|
 |
Retail and Medical Indexes Fell; Gold & Silver Index Bounced
Kenneth J. Gruneisen - Passed the CAN SLIM® Master's Exam
The Retail Index ($RLX -0.73%) had a negative influence on the major averages, meanwhile financial shares were mixed as the Broker/Dealer Index ($XBD -0.39%) edged lower and the Bank Index ($BKX +0.19%) posted a small gain. The Oil Services Index ($OSX -0.37%) and Integrated Oil Index ($XOI -0.04%) edged lower. Medical-related shares had a negative bias as the Biotechnology Index ($BTK -1.07%) and the Healthcare Index ($HMO -0.55%) fell. The Gold & Silver Index ($XAU +3.99%) bounced, making it a standout gainer. The Networking Index ($NWX +1.41%) led the tech sector while the Semiconductor Index ($SOX +0.29%) posted a smaller gain and the Internet Index ($IIX -0.47%) edged lower.
Charts courtesy www.stockcharts.com
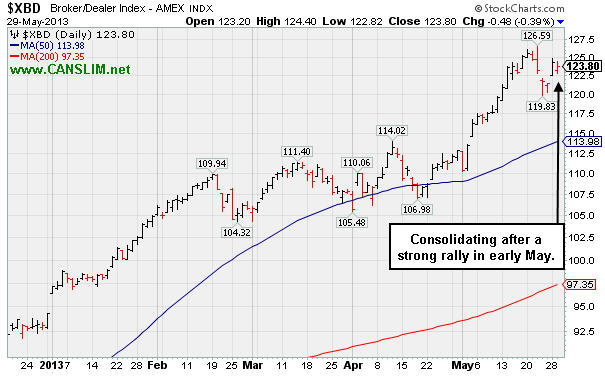
PICTURED: The Broker/Dealer Index ($XBD -0.39%) is consolidating after a strong rally in early May.
| Oil Services |
$OSX |
260.50 |
-0.96 |
-0.37% |
+18.32% |
| Healthcare |
$HMO |
3,126.89 |
-17.40 |
-0.55% |
+24.37% |
| Integrated Oil |
$XOI |
1,413.03 |
-0.59 |
-0.04% |
+13.79% |
| Semiconductor |
$SOX |
467.29 |
+1.35 |
+0.29% |
+21.67% |
| Networking |
$NWX |
248.28 |
+3.44 |
+1.41% |
+9.59% |
| Internet |
$IIX |
380.56 |
-1.78 |
-0.47% |
+16.38% |
| Broker/Dealer |
$XBD |
123.80 |
-0.48 |
-0.39% |
+31.24% |
| Retail |
$RLX |
787.68 |
-5.78 |
-0.73% |
+20.61% |
| Gold & Silver |
$XAU |
104.04 |
+3.99 |
+3.99% |
-37.17% |
| Bank |
$BKX |
61.80 |
+0.12 |
+0.19% |
+20.51% |
| Biotech |
$BTK |
1,992.97 |
-21.62 |
-1.07% |
+28.83% |
|
|
|
 |
Found Support Above 50-Day Moving Average After Whipsaw Action Negated Recent Breakout
Kenneth J. Gruneisen - Passed the CAN SLIM® Master's Exam
Any stock sold based on triggering the fact-based investment system's strict sell rules can be bought back at a later time if impressive strength returns. In fact, in the Certification it is taught that experts should buy a slightly larger dollar amount (+10% more) in the same stock if it later flashes especially bullish action. This tactic reinforces their commitment and confidence in the fact-based investment system. As always, there is a chance the stock might turn negative again, in which case the -7% sell rule may apply yet again. However, it is crucial to investors' long-term success to do a good job of limiting losses while they are small. The best approach is to never hang on for a weak stock to possibly become a -20%, -30%, -40%, or more devastating loss. In a bullish market environment, patient and disciplined investors investors can find their fair share of great winners by following the rules.
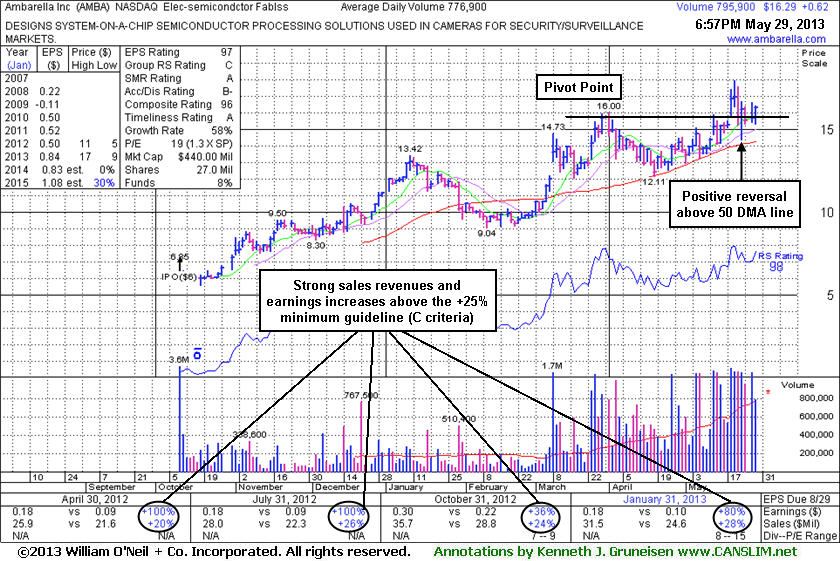
Ambarella Corporation (AMBA +$0.62 or +3.96% to $16.29) rebounded back above its pivot point as it advanced further today with average volume behind its solid gain. It stayed well above its 50-day moving average (DMA) line ($14.25 now) and managed a "positive reversal" on Thursday, however the choppy action and Friday's weak finish below its old high close ($15.66 on 3/28/13) had raised concerns by completely negating its recent breakout. The whipsaw-like price volatility from its 5/21/13 high likely prompted disciplined investors into selling their shares after falling -7% from their purchase price. AMBA's last appearance in this FSU section was on 5/06/13 with an annotated graph under the headline, "Found Support at 50-Day Average While Forming New Base", after highlighted in the mid-day report (read here). The new pivot point cited was based on its 4/01/13 high plus 10 cents. Subsequent volume-driven gains above the pivot point triggered a new technical buy signal.
The high-ranked Electronics - Semiconductor firm reported earnings +80% on +28% sales revenues for the Jan '13 quarter. Its strong quarterly earnings comparisons versus the year ago periods satisfy the C criteria with increases above the +25% minimum guideline. It also has a good annual earnings (A criteria), however it has a limited history since its IPO at $6 on 10/10/12. The number of top-rated funds owning its shares rose from 51 in Dec '12 to 67 in Mar '13, a reassuring indication concerning the I criteria. Its current Up/Down Volume Ratio of 1.6 is also an unbiased indication that its shares have been under accumulation over the past 50 days. Its small supply (S criteria) of only 13.3 million shares in the public float can contribute to great price volatility in the event of institutional buying or selling.
 |
|
|
Color Codes Explained :
Y - Better candidates highlighted by our
staff of experts.
G - Previously featured
in past reports as yellow but may no longer be buyable under the
guidelines.
***Last / Change / Volume data in this table is the closing quote data***
Symbol/Exchange
Company Name
Industry Group |
PRICE |
CHANGE
(%Change) |
Day High |
Volume
(% DAV)
(% 50 day avg vol) |
52 Wk Hi
% From Hi |
Featured
Date |
Price
Featured |
Pivot Featured |
|
Max Buy |
AL
-
NYSE
Air Lease Corp Cl A
DIVERSIFIED SERVICES - Rental and Leasing Services
|
$28.16
|
-0.72
-2.49% |
$28.64
|
608,407
136.29% of 50 DAV
50 DAV is 446,400
|
$31.00
-9.16%
|
5/9/2013
|
$30.95
|
PP = $29.38
|
|
MB = $30.85
|
Most Recent Note - 5/28/2013 5:52:23 PM
Y - Still consolidating above important support at its 50 DMA line after slumping back below its pivot point last week. More damaging losses would raise concerns and trigger technical sell signals.
>>> The latest Featured Stock Update with an annotated graph appeared on 5/9/2013. Click here.
View all notes |
Alert me of new notes |
CANSLIM.net Company Profile |
SEC |
Zacks Reports |
StockTalk |
News |
Chart |
Request a new note
C
A N
S L
I M


|
AMBA
-
NASDAQ
Ambarella Inc
ELECTRONICS - Semiconductor - Specialized
|
$16.29
|
+0.62
3.96% |
$16.38
|
795,922
102.45% of 50 DAV
50 DAV is 776,900
|
$17.90
-8.99%
|
5/6/2013
|
$15.31
|
PP = $16.10
|
|
MB = $16.91
|
 Most Recent Note - 5/29/2013 7:46:21 PM
Y - Rebounded further above its pivot point with average volume behind its solid gain today. See the latest FSU analysis for more details and a new annotated graph.
>>> The latest Featured Stock Update with an annotated graph appeared on 5/29/2013. Click here.
View all notes |
Alert me of new notes |
CANSLIM.net Company Profile |
SEC |
Zacks Reports |
StockTalk |
News |
Chart |
Request a new note
C
A N
S L
I M
|
CELG
-
NASDAQ
Celgene Corp
DRUGS - Drug Manufacturers - Major
|
$123.09
|
-1.50
-1.20% |
$124.28
|
2,145,416
70.67% of 50 DAV
50 DAV is 3,035,900
|
$131.82
-6.62%
|
3/27/2013
|
$113.24
|
PP = $115.54
|
|
MB = $121.32
|
Most Recent Note - 5/28/2013 4:03:58 PM
G - Still consolidating above its 50 DMA line after encountering distributional pressure. A violation of its 50 DMA line (now $119.76) would raise concerns and trigger a technical sell signal. It is extended from any sound base pattern, yet may go on to produce more climactic gains.
>>> The latest Featured Stock Update with an annotated graph appeared on 5/13/2013. Click here.
View all notes |
Alert me of new notes |
CANSLIM.net Company Profile |
SEC |
Zacks Reports |
StockTalk |
News |
Chart |
Request a new note
C
A N
S L
I M
|
EQM
-
NYSE
E Q T Midstream Partners
ENERGY - Oil and Gas Pipelines
|
$49.50
|
-0.85
-1.69% |
$50.96
|
286,053
304.96% of 50 DAV
50 DAV is 93,800
|
$51.72
-4.29%
|
4/25/2013
|
$40.16
|
PP = $40.84
|
|
MB = $42.88
|
Most Recent Note - 5/29/2013 12:20:32 PM
G - Churning above average volume today while retreating after a "negative reversal" on the prior session broke a streak of 8 consecutive small gains. It is extended from its latest base and well above its 50 DMA line defining important near-term chart support.
>>> The latest Featured Stock Update with an annotated graph appeared on 5/16/2013. Click here.
View all notes |
Alert me of new notes |
CANSLIM.net Company Profile |
SEC |
Zacks Reports |
StockTalk |
News |
Chart |
Request a new note
C
A N
S L
I M
|
FLT
-
NYSE
Fleetcor Technologies
DIVERSIFIED SERVICES - Business/Management Services
|
$85.91
|
+1.56
1.85% |
$87.45
|
1,409,224
156.15% of 50 DAV
50 DAV is 902,500
|
$85.56
0.41%
|
5/29/2013
|
$86.02
|
PP = $85.66
|
|
MB = $89.94
|
Most Recent Note - 5/29/2013 12:32:33 PM
Y- Color code is changed to yellow with new pivot point cited based on its 5/03/13 high while now rising from an advanced "3-weeks tight" base. It may go on to produce more climactic gains, however this is a riskier "late-stage" base. Hit a new 52-week high with today's 4th consecutive gain on ever-increasing volume. Its 50 DMA line defines support where a violation would raise concerns and trigger a technical sell signal.
>>> The latest Featured Stock Update with an annotated graph appeared on 5/8/2013. Click here.
View all notes |
Alert me of new notes |
CANSLIM.net Company Profile |
SEC |
Zacks Reports |
StockTalk |
News |
Chart |
Request a new note
C
A N
S L
I M
|
Symbol/Exchange
Company Name
Industry Group |
PRICE |
CHANGE
(%Change) |
Day High |
Volume
(% DAV)
(% 50 day avg vol) |
52 Wk Hi
% From Hi |
Featured
Date |
Price
Featured |
Pivot Featured |
|
Max Buy |
LOPE
-
NASDAQ
Grand Canyon Education
DIVERSIFIED SERVICES - Education and; Training Services
|
$32.28
|
-0.59
-1.79% |
$32.79
|
249,021
61.88% of 50 DAV
50 DAV is 402,400
|
$34.07
-5.25%
|
5/10/2013
|
$29.03
|
PP = $27.28
|
|
MB = $28.64
|
Most Recent Note - 5/28/2013 5:50:07 PM
G - Perched at its 52-week high, very extended from its previous base. Prior highs in the $27 area define support to watch on pullbacks. Gains of greater than +20% in the first 2-3 weeks following its "breakaway gap" suggest holding for a minimum of 8 week under the fact-based investment system's rules.
>>> The latest Featured Stock Update with an annotated graph appeared on 5/10/2013. Click here.
View all notes |
Alert me of new notes |
CANSLIM.net Company Profile |
SEC |
Zacks Reports |
StockTalk |
News |
Chart |
Request a new note
C
A N
S L
I M
|
MRLN
-
NASDAQ
Marlin Business Services
DIVERSIFIED SERVICES - Rental and Leasing Services
|
$23.79
|
-0.01
-0.04% |
$23.95
|
31,046
133.82% of 50 DAV
50 DAV is 23,200
|
$25.97
-8.39%
|
3/15/2013
|
$22.29
|
PP = $23.18
|
|
MB = $24.34
|
Most Recent Note - 5/28/2013 12:43:33 PM
Y - Trading further above its 50 DMA line with today's 3rd consecutive gain backed by ever-increasing volume. The rebound above that important short-term average on Friday helped its technical stance and outlook improve.
>>> The latest Featured Stock Update with an annotated graph appeared on 5/23/2013. Click here.
View all notes |
Alert me of new notes |
CANSLIM.net Company Profile |
SEC |
Zacks Reports |
StockTalk |
News |
Chart |
Request a new note
C
A N
S L
I M
|
N
-
NYSE
Netsuite Inc
DIVERSIFIED SERVICES - Business/Management Services
|
$86.00
|
-3.52
-3.93% |
$88.86
|
923,676
252.99% of 50 DAV
50 DAV is 365,100
|
$95.76
-10.19%
|
12/12/2012
|
$64.75
|
PP = $67.12
|
|
MB = $70.48
|
Most Recent Note - 5/29/2013 7:50:30 PM
Down today for another damaging loss with above average volume, testing support at its 50 DMA line. Announced a Private Offering of $270 Million in Convertible Senior Notes. It will be dropped from the Featured Stocks list tonight due to fundamental and technical deterioration.
>>> The latest Featured Stock Update with an annotated graph appeared on 5/15/2013. Click here.
View all notes |
Alert me of new notes |
CANSLIM.net Company Profile |
SEC |
Zacks Reports |
StockTalk |
News |
Chart |
Request a new note
C
A N
S L
I M
|
NSM
-
NYSE
Nationstar Mtg Hldgs Inc
FINANCIAL SERVICES - Credit Services
|
$40.78
|
-0.55
-1.33% |
$41.57
|
1,523,026
115.66% of 50 DAV
50 DAV is 1,316,800
|
$46.91
-13.07%
|
5/7/2013
|
$39.71
|
PP = $42.34
|
|
MB = $44.46
|
Most Recent Note - 5/28/2013 5:12:41 PM
Y - Edged below its pivot point with above average volume behind today's 5th consecutive loss, raising some concerns. Disciplined investors alway limit losses by selling any stock that falls more than -7% from their purchase price. See the latest FSU analysis for more details and a new annotated graph.
>>> The latest Featured Stock Update with an annotated graph appeared on 5/28/2013. Click here.
View all notes |
Alert me of new notes |
CANSLIM.net Company Profile |
SEC |
Zacks Reports |
StockTalk |
News |
Chart |
Request a new note
C
A N
S L
I M
|
PRAA
-
NASDAQ
Portfolio Recovery Assoc
DIVERSIFIED SERVICES - Business/Management Services
|
$150.83
|
+0.19
0.13% |
$153.85
|
29,064
42.74% of 50 DAV
50 DAV is 68,000
|
$151.51
-0.45%
|
5/1/2013
|
$130.77
|
PP = $127.88
|
|
MB = $134.27
|
Most Recent Note - 5/28/2013 5:44:31 PM
G - Volume was higher behind today's gain for a best-ever close. Very extended from prior highs in the $127 area and well above its 50 DMA line defining important chart support.
>>> The latest Featured Stock Update with an annotated graph appeared on 5/22/2013. Click here.
View all notes |
Alert me of new notes |
CANSLIM.net Company Profile |
SEC |
Zacks Reports |
StockTalk |
News |
Chart |
Request a new note
C
A N
S L
I M
|
Symbol/Exchange
Company Name
Industry Group |
PRICE |
CHANGE
(%Change) |
Day High |
Volume
(% DAV)
(% 50 day avg vol) |
52 Wk Hi
% From Hi |
Featured
Date |
Price
Featured |
Pivot Featured |
|
Max Buy |
PRLB
-
NYSE
Proto Labs Inc
MANUFACTURING - Small Tools and Accessories
|
$53.50
|
-0.59
-1.09% |
$53.79
|
131,551
23.29% of 50 DAV
50 DAV is 564,800
|
$59.84
-10.59%
|
5/3/2013
|
$54.77
|
PP = $54.01
|
|
MB = $56.71
|
Most Recent Note - 5/24/2013 6:43:18 PM
Y - Consolidating above its 50 DMA line after slumping into its prior base. See the latest FSU analysis for more details and a new annotated graph.
>>> The latest Featured Stock Update with an annotated graph appeared on 5/24/2013. Click here.
View all notes |
Alert me of new notes |
CANSLIM.net Company Profile |
SEC |
Zacks Reports |
StockTalk |
News |
Chart |
Request a new note
C
A N
S L
I M
|
RRTS
-
NYSE
Roadrunner Trans Systems
TRANSPORTATION - Air Delivery and Freight Service
|
$27.63
|
-0.08
-0.29% |
$27.89
|
100,273
48.25% of 50 DAV
50 DAV is 207,800
|
$28.00
-1.32%
|
4/3/2013
|
$22.77
|
PP = $23.75
|
|
MB = $24.94
|
Most Recent Note - 5/28/2013 5:45:55 PM
G - Today's 4th consecutive gain while led to a best-ever close, getting more extended from its latest base. Prior highs in the $23 area define initial support to watch above its 50 DMA line. Fundamental concerns were raised by its sub par earnings increase in the Mar '13 quarter, below the +25% minimum guideline (C criteria).
>>> The latest Featured Stock Update with an annotated graph appeared on 5/14/2013. Click here.
View all notes |
Alert me of new notes |
CANSLIM.net Company Profile |
SEC |
Zacks Reports |
StockTalk |
News |
Chart |
Request a new note
C
A N
S L
I M
|
VRX
-
NYSE
Valeant Pharmaceuticals
DRUGS - Drug Manufacturers - Other
|
$90.81
|
-0.99
-1.08% |
$93.40
|
3,684,899
203.30% of 50 DAV
50 DAV is 1,812,500
|
$96.25
-5.65%
|
4/30/2013
|
$60.24
|
PP = $76.66
|
|
MB = $80.49
|
Most Recent Note - 5/29/2013 1:03:56 PM
G- Perched at its all-time high following 2 consecutive volume-driven gains, extended from prior highs. Announced plans to buy Bausch & Lomb for $8.7 billion. Prior reports cautioned - "Sub par earnings for the Mar '13 quarter below the +25% minimum guideline (C criteria) raised fundamental concerns."
>>> The latest Featured Stock Update with an annotated graph appeared on 5/17/2013. Click here.
View all notes |
Alert me of new notes |
CANSLIM.net Company Profile |
SEC |
Zacks Reports |
StockTalk |
News |
Chart |
Request a new note
C
A N
S L
I M
|
|
|
|
THESE ARE NOT BUY RECOMMENDATIONS!
Comments contained in the body of this report are technical
opinions only. The material herein has been obtained
from sources believed to be reliable and accurate, however,
its accuracy and completeness cannot be guaranteed.
This site is not an investment advisor, hence it does
not endorse or recommend any securities or other investments.
Any recommendation contained in this report may not
be suitable for all investors and it is not to be deemed
an offer or solicitation on our part with respect to
the purchase or sale of any securities. All trademarks,
service marks and trade names appearing in this report
are the property of their respective owners, and are
likewise used for identification purposes only.
This report is a service available
only to active Paid Premium Members.
You may opt-out of receiving report notifications
at any time. Questions or comments may be submitted
by writing to Premium Membership Services 665 S.E. 10 Street, Suite 201 Deerfield Beach, FL 33441-5634 or by calling 1-800-965-8307
or 954-785-1121.
|
|
|

