You are not logged in.
This means you
CAN ONLY VIEW reports that were published prior to Monday, April 14, 2025.
You
MUST UPGRADE YOUR MEMBERSHIP if you want to see any current reports.
AFTER MARKET UPDATE - TUESDAY, MAY 29TH, 2012
Previous After Market Report Next After Market Report >>>
|
|
|
|
DOW |
+125.86 |
12,580.69 |
+1.01% |
|
Volume |
714,340,990 |
+20% |
|
Volume |
1,599,585,570 |
+28% |
|
NASDAQ |
+33.46 |
2,870.99 |
+1.18% |
|
Advancers |
2,421 |
77% |
|
Advancers |
1,753 |
66% |
|
S&P 500 |
+14.60 |
1,332.42 |
+1.11% |
|
Decliners |
635 |
20% |
|
Decliners |
758 |
29% |
|
Russell 2000 |
+10.75 |
777.16 |
+1.40% |
|
52 Wk Highs |
62 |
|
|
52 Wk Highs |
26 |
|
|
S&P 600 |
+5.85 |
436.80 |
+1.36% |
|
52 Wk Lows |
30 |
|
|
52 Wk Lows |
45 |
|
|
 |
Major Indices Tallied Gains With Better Volume
Kenneth J. Gruneisen - Passed the CAN SLIM® Master's Exam
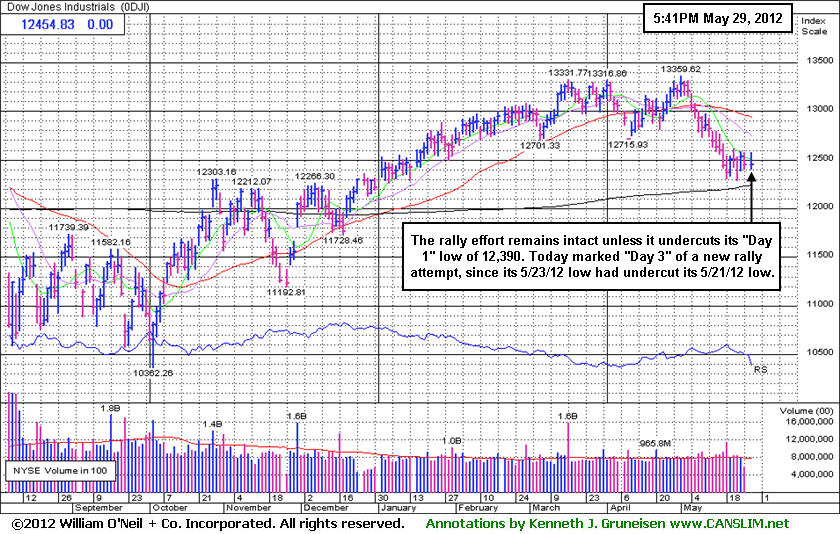
Tuesday's session brought unanimous gains for the Dow Jones Industrial Average, S&P 500 Index, and the Nasdaq Composite Index, however the gains on "Day 6" were not large enough to qualify as the convincing confirming gains disciplined fact-based investors might consider a proper follow-through day. Volume totals were reported higher on the Nasdaq exchange and on the NYSE versus the prior session's totals as traders returned from the long Memorial Day weekend. Breadth was positive as advancers led decliners by more than 3-1 on the NYSE and by more than 2-1 on the Nasdaq exchange. New 52-week highs outnumbered new 52-week lows on the NYSE, but new lows still easily held the lead on the Nasdaq exchange. There were 25 high-ranked companies from the CANSLIM.net Leaders List that made new 52-week highs and appeared on the CANSLIM.net BreakOuts Page, more than doubling the prior session total of 11 stocks. Investors watching for a follow-through day in the days and weeks ahead should be aware that an expansion in the number of stocks hitting new 52-week highs is an important component to any new confirmed rally. There were gains for 13 of the 20 high-ranked companies currently included on the Featured Stocks Page.
Stocks gained after recent polls showed Greek voters increased support for the parties in favor of austerity measures ahead of the June 17 election. Investors were also encouraged by Europe's central bank saying its primary goal is to keep Greece in the euro. Meanwhile in the U.S., new housing data offset an unexpected decline in consumer confidence. The Case/Shiller report showed home prices fell by the slowest pace in over a year. Consumer confidence fell to 64.9 in May from a revised 68.7 last month.
Material stocks helped lead stocks higher as Peabody Energy (BTU +5.61%) rose after receiving an analyst upgrade. Chesapeake Energy Corp (CHK +3.42%) added more to its recent spurt of gains after activist investor Carl Icahn disclosed a 7.6% stake in the company. Tech was seeing green with Apple Inc (AAPL +1.77%) up on reports of a trial production run of the company's TV sets. Cyclical stocks also led the market higher with Caterpillar Inc (CAT +2.87%) and Alcoa Inc (AA +3.01%) rising. Facebook Inc (FB -9.36%) sat out the rally, extending its loss to over -20% since going public on May 17. Vertex Pharmaceuticals (VRTX -10.87%) tumbled after results of a recent study were revised to show less of a benefit.
European markets rallied into the close. The FTSE finished up +0.7% in London and the DAX rose +1.2% in Germany. The 10-year note closed down 5/32 to yield 1.75%.
Tuesday marked "Day 6" of a new rally effort that remains intact for the Nasdaq Composite Index provided that its Day 1 low (2,774.76) is not undercut. The S&P 500 Index, the benchmark index, held its ground after dipping at Wednesday's intra-day low to within 1 point of its 5/21/12 low (1,295.73).
Historical studies suggest that the most constructive market rallies produced a solid follow-through day (FTD) between Days 4-7 of a new rally effort. The window is open for a new confirmed rally to present itself, and such technical proof may give fact-based investors the clearance to begin with new buying efforts only in sound candidates. Meanwhile, investors should keep up a watchlist of worthy buy candidates while remaining protective of capital. The major averages (M criteria) are technically still considered to be in a "correction" and stocks remain vulnerable to much greater downside. Ideally, a follow-through day (FTD) between Day 4-7 of additional confirming gains of +1.4% or greater by either the Nasdaq Composite Index or the S&P 500 Index, backed by higher volume, and coupled with an expansion in the number of stocks hitting new highs, would "confirm" a new rally.
PICTURED: The Dow Jones Industrial Average's rally effort remains intact unless it undercuts its "Day 1" low of 12,390. Tuesday marked "Day 3" of the Dow's new rally attempt, since its 5/23/12 low had undercut its 5/21/12 low.
|
 Kenneth J. Gruneisen started out as a licensed stockbroker in August 1987, a couple of months prior to the historic stock market crash that took the Dow Jones Industrial Average down -22.6% in a single day. He has published daily fact-based fundamental and technical analysis on high-ranked stocks online for two decades. Through FACTBASEDINVESTING.COM, Kenneth provides educational articles, news, market commentary, and other information regarding proven investment systems that work in good times and bad.
Comments contained in the body of this report are technical opinions only and are not necessarily those of Gruneisen Growth Corp. The material herein has been obtained from sources believed to be reliable and accurate, however, its accuracy and completeness cannot be guaranteed. Our firm, employees, and customers may effect transactions, including transactions contrary to any recommendation herein, or have positions in the securities mentioned herein or options with respect thereto. Any recommendation contained in this report may not be suitable for all investors and it is not to be deemed an offer or solicitation on our part with respect to the purchase or sale of any securities. |
|
 |
Financial, Tech, Energy, and Retail Indexes Posted Gains
Kenneth J. Gruneisen - Passed the CAN SLIM® Master's Exam
The Bank Index ($BKX +1.45%) and the Broker/Dealer Index ($XBD +2.08%) tallied gains and had a positive influence on the major averages on Tuesday. The Networking Index ($NWX +2.59%) and Semiconductor Index ($SOX +2.03%) led he tech sector higher, followed by the Internet Index ($IIX +1.17%), but the Biotechnology Index ($BTK -0.48%) lagged. The Retail Index ($RLX +1.04%) also posted a modest gain, and strength in energy-related issues gave the Oil Services Index ($OSX +2.04%) and Integrated Oil Index ($XOI +1.00%) a boost. The Healthcare Index ($HMO +0.57%) edged higher, but the Gold & Silver Index ($XAU -1.37%) lost ground, making it a standout laggard.
Charts courtesy www.stockcharts.com
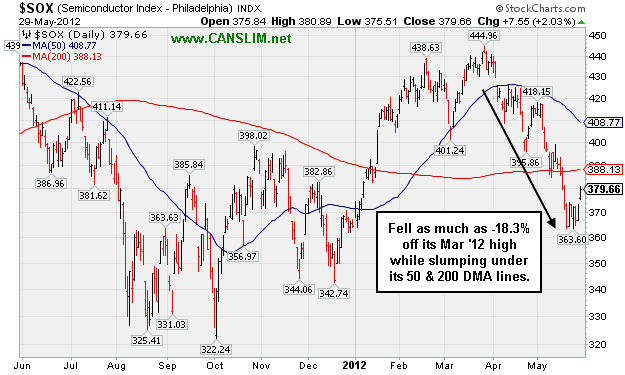
PICTURED: The Semiconductor Index ($SOX +2.03%) fell as much as -18.3% from its March '12 high while undercutting its 50-day and 200-day moving average (DMA) lines.
| Oil Services |
$OSX |
212.47 |
+4.24 |
+2.04% |
-1.76% |
| Healthcare |
$HMO |
2,338.25 |
+13.17 |
+0.57% |
+2.48% |
| Integrated Oil |
$XOI |
1,130.81 |
+11.22 |
+1.00% |
-8.00% |
| Semiconductor |
$SOX |
379.66 |
+7.55 |
+2.03% |
+4.18% |
| Networking |
$NWX |
211.21 |
+5.32 |
+2.59% |
-1.83% |
| Internet |
$IIX |
300.00 |
+3.48 |
+1.17% |
+6.48% |
| Broker/Dealer |
$XBD |
87.78 |
+1.78 |
+2.08% |
+5.42% |
| Retail |
$RLX |
613.45 |
+6.32 |
+1.04% |
+17.25% |
| Gold & Silver |
$XAU |
155.66 |
-2.17 |
-1.37% |
-13.83% |
| Bank |
$BKX |
44.72 |
+0.64 |
+1.45% |
+13.56% |
| Biotech |
$BTK |
1,460.94 |
-7.03 |
-0.48% |
+33.86% |
|
|
|
 |
Apparel Firm Raised Fundamental Concerns With Sub Par Quarter
Kenneth J. Gruneisen - Passed the CAN SLIM® Master's Exam
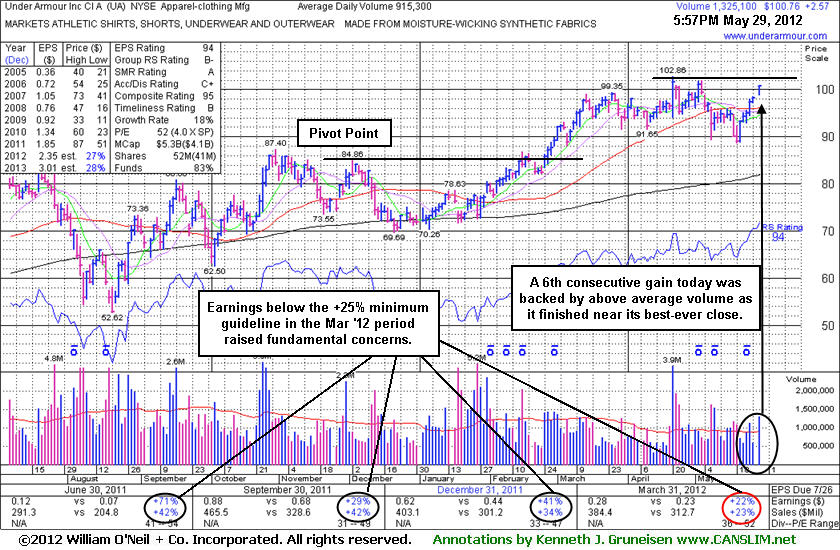
Under Armour Inc (UA +$2.57 or +2.62% to $100.76) posted a 6th consecutive gain today, and its gain was backed by above average volume as it finished near its best-ever close. Concerns were recently raised by weaker fundamentals in the Mar '12 period, its first quarterly earnings increase below the +25% minimum guideline in more than 2 years. Otherwise, a new pivot point might be cited based on its recent resilience and while now approaching its 52-week high.
It was last shown in this FSU section on 4/04/12 with an annotated graph under the headline, "Encountering Distributional Pressure While Building New Base". Subsequent volume-driven gains into new high territory would be a very reassuring sign of fresh institutional buying demand that could lead to another meaningful and sustained advance. However, its latest earnings comparison being sub par fundamentally makes it a less ideal candidate for disciplined investors to have on their watchlist, even though it is now perched only -2% off its all-time high. The high-ranked Apparel - Clothing Manufacturing firm has seen the number of top-rated funds owning its shares rise from 379 in Jun '11 to 454 in Mar '12, a reassuring trend concerning the I criteria.
|
|
|
Color Codes Explained :
Y - Better candidates highlighted by our
staff of experts.
G - Previously featured
in past reports as yellow but may no longer be buyable under the
guidelines.
***Last / Change / Volume data in this table is the closing quote data***
Symbol/Exchange
Company Name
Industry Group |
PRICE |
CHANGE
(%Change) |
Day High |
Volume
(% DAV)
(% 50 day avg vol) |
52 Wk Hi
% From Hi |
Featured
Date |
Price
Featured |
Pivot Featured |
|
Max Buy |
ACN
-
NYSE
Accenture Plc
DIVERSIFIED SERVICES - Business/Management Services
|
$58.41
|
+0.97
1.69% |
$58.76
|
4,218,216
112.19% of 50 DAV
50 DAV is 3,760,000
|
$65.89
-11.35%
|
3/23/2012
|
$64.13
|
PP = $63.76
|
|
MB = $66.95
|
 Most Recent Note - 5/29/2012 4:00:32 PM
G - Consolidating just above support at its longer-term 200 DMA line. Triggered technical sell signals with its recent losses undercutting prior highs in the $62-63 area and violating its 50 DMA line.
>>> The latest Featured Stock Update with an annotated graph appeared on 5/22/2012. Click here.
View all notes |
Alert me of new notes |
CANSLIM.net Company Profile |
SEC |
Zacks Reports |
StockTalk |
News |
Chart |
Request a new note
C
A N
S L
I M


|
ALXN
-
NASDAQ
Alexion Pharmaceuticals
DRUGS - Drug Manufacturers - Other
|
$92.07
|
-0.35
-0.38% |
$92.98
|
2,642,383
137.15% of 50 DAV
50 DAV is 1,926,700
|
$95.01
-3.09%
|
5/1/2012
|
$91.73
|
PP = $95.11
|
|
MB = $99.87
|
Most Recent Note - 5/29/2012 4:31:49 PM
Y - Completed a new Public Offering on 5/25/12 and it is consolidating above its 50 DMA line. Volume-driven gains to new highs may trigger a technical buy signal. Faces little resistance in the $94-95 area.
>>> The latest Featured Stock Update with an annotated graph appeared on 4/16/2012. Click here.
View all notes |
Alert me of new notes |
CANSLIM.net Company Profile |
SEC |
Zacks Reports |
StockTalk |
News |
Chart |
Request a new note
C
A N
S L
I M
|
ARBA
-
NASDAQ
Accenture Plc
INTERNET - Internet Software and Services
|
$44.98
|
-0.24
-0.53% |
$45.15
|
5,535,738
147.23% of 50 DAV
50 DAV is 3,760,000
|
$45.48
-1.10%
|
4/27/2012
|
$38.53
|
PP = $37.24
|
|
MB = $39.10
|
Most Recent Note - 5/29/2012 4:33:06 PM
G - Still holding its ground since tallying a considerable gain on 5/22/12 with heavy volume on news it will be bought by SAP in a $4.3 billion deal. The stock quickly got extended from its prior base after a quiet consolidation above chart support at its 50 DMA line and prior highs.
>>> The latest Featured Stock Update with an annotated graph appeared on 4/30/2012. Click here.
View all notes |
Alert me of new notes |
CANSLIM.net Company Profile |
SEC |
Zacks Reports |
StockTalk |
News |
Chart |
Request a new note
C
A N
S L
I M
|
CERN
-
NASDAQ
Cerner Corp
COMPUTER SOFTWARE and SERVICES - Healthcare Information Service
|
$79.68
|
+0.67
0.85% |
$81.14
|
969,851
80.96% of 50 DAV
50 DAV is 1,198,000
|
$84.10
-5.26%
|
4/27/2012
|
$77.23
|
PP = $78.63
|
|
MB = $82.56
|
Most Recent Note - 5/29/2012 4:35:13 PM
Y - Found prompt support near its 50 DMA line after a prior loss negated its recent technical breakout. Volume totals have been cooling while hovering within close striking distance of its 52-week high.
>>> The latest Featured Stock Update with an annotated graph appeared on 5/1/2012. Click here.
View all notes |
Alert me of new notes |
CANSLIM.net Company Profile |
SEC |
Zacks Reports |
StockTalk |
News |
Chart |
Request a new note
C
A N
S L
I M
|
CMCSA
-
NASDAQ
Comcast Corp Cl A
MEDIA - CATV Systems
|
$29.22
|
+0.37
1.28% |
$29.28
|
9,905,581
78.06% of 50 DAV
50 DAV is 12,690,400
|
$30.88
-5.36%
|
5/2/2012
|
$30.04
|
PP = $30.51
|
|
MB = $32.04
|
Most Recent Note - 5/29/2012 4:38:39 PM
G - Gains have lacked volume conviction since slumping under its 50 DMA line and undercutting the prior low ($28.54 on 4/10/12). A rebound above its short-term average would help its technical stance and near-term outlook improve.
>>> The latest Featured Stock Update with an annotated graph appeared on 5/7/2012. Click here.
View all notes |
Alert me of new notes |
CANSLIM.net Company Profile |
SEC |
Zacks Reports |
StockTalk |
News |
Chart |
Request a new note
C
A N
S L
I M
|
Symbol/Exchange
Company Name
Industry Group |
PRICE |
CHANGE
(%Change) |
Day High |
Volume
(% DAV)
(% 50 day avg vol) |
52 Wk Hi
% From Hi |
Featured
Date |
Price
Featured |
Pivot Featured |
|
Max Buy |
COO
-
NYSE
Cooper Companies Inc
HEALTH SERVICES - Medical Instruments and Supplies
|
$85.72
|
+0.19
0.22% |
$86.26
|
420,465
102.28% of 50 DAV
50 DAV is 411,100
|
$89.31
-4.02%
|
3/9/2012
|
$83.05
|
PP = $81.02
|
|
MB = $85.07
|
Most Recent Note - 5/29/2012 4:39:31 PM
G - Still consolidating above prior highs in the $83-84 area and above its 50 DMA line, important near-term support. A subsequent violation may trigger a worrisome sell signal.
>>> The latest Featured Stock Update with an annotated graph appeared on 5/18/2012. Click here.
View all notes |
Alert me of new notes |
CANSLIM.net Company Profile |
SEC |
Zacks Reports |
StockTalk |
News |
Chart |
Request a new note
C
A N
S L
I M
|
DG
-
NYSE
Dollar General Corp
RETAIL - Discount, Variety Stores
|
$48.06
|
+0.48
1.01% |
$48.28
|
2,433,537
89.82% of 50 DAV
50 DAV is 2,709,300
|
$48.76
-1.44%
|
5/7/2012
|
$48.51
|
PP = $47.69
|
|
MB = $50.07
|
Most Recent Note - 5/29/2012 4:42:18 PM
Y - Rebounded further above its 50 DMA line today and finished near its best-ever close. Its color code is changed to yellow based on recent resilience.
>>> The latest Featured Stock Update with an annotated graph appeared on 5/9/2012. Click here.
View all notes |
Alert me of new notes |
CANSLIM.net Company Profile |
SEC |
Zacks Reports |
StockTalk |
News |
Chart |
Request a new note
C
A N
S L
I M
|
EXPE
-
NASDAQ
Expedia Inc
INTERNET - Internet Information Providers
|
$45.30
|
+0.41
0.91% |
$45.78
|
2,274,559
50.36% of 50 DAV
50 DAV is 4,516,400
|
$46.07
-1.67%
|
4/27/2012
|
$41.80
|
PP = $35.57
|
|
MB = $37.35
|
Most Recent Note - 5/29/2012 4:46:07 PM
G - Held its ground near its 52-week high today. As previously noted, heavy volume behind a considerable gain on 5/23/12 technically helped it break out from an advanced "3-weeks tight" base with no resistance remaining due to overhead supply, however no new pivot point was cited. Until the market confirms a new rally with a solid follow through day from at least one of the major averages (M criteria) the fact-based investment system argues against new buying efforts in any stocks.
>>> The latest Featured Stock Update with an annotated graph appeared on 5/3/2012. Click here.
View all notes |
Alert me of new notes |
CANSLIM.net Company Profile |
SEC |
Zacks Reports |
StockTalk |
News |
Chart |
Request a new note
C
A N
S L
I M
|
GNC
-
NYSE
G N C Holdings Inc
RETAIL - Drug Stores
|
$39.54
|
-0.01
-0.03% |
$40.00
|
1,140,933
59.94% of 50 DAV
50 DAV is 1,903,400
|
$41.95
-5.74%
|
1/19/2012
|
$28.99
|
PP = $29.60
|
|
MB = $31.08
|
Most Recent Note - 5/29/2012 4:47:20 PM
G - Hovering within close striking distance of its 52-week high today. Found support near prior highs and its 50 DMA line while recently consolidating. Reported earnings +82% on +23% sales revenues for the quarter ended March 31, 2012 versus the year ago period.
>>> The latest Featured Stock Update with an annotated graph appeared on 4/26/2012. Click here.
View all notes |
Alert me of new notes |
CANSLIM.net Company Profile |
SEC |
Zacks Reports |
StockTalk |
News |
Chart |
Request a new note
C
A N
S L
I M
|
MG
-
NYSE
Mistras Group Inc
DIVERSIFIED SERVICES - Bulding and Faci;ity Management Services
|
$22.99
|
+0.00
0.00% |
$23.43
|
81,297
84.60% of 50 DAV
50 DAV is 96,100
|
$26.24
-12.39%
|
3/22/2012
|
$24.96
|
PP = $26.34
|
|
MB = $27.66
|
Most Recent Note - 5/29/2012 4:48:35 PM
G - Suffered another loss today with lighter volume. Recently slumping toward prior lows and its 200 DMA line defining important near-term support in the $22.50 area.
>>> The latest Featured Stock Update with an annotated graph appeared on 4/2/2012. Click here.
View all notes |
Alert me of new notes |
CANSLIM.net Company Profile |
SEC |
Zacks Reports |
StockTalk |
News |
Chart |
Request a new note
C
A N
S L
I M
|
Symbol/Exchange
Company Name
Industry Group |
PRICE |
CHANGE
(%Change) |
Day High |
Volume
(% DAV)
(% 50 day avg vol) |
52 Wk Hi
% From Hi |
Featured
Date |
Price
Featured |
Pivot Featured |
|
Max Buy |
NTES
-
NASDAQ
Netease Inc Adr
INTERNET - Internet Information Providers
|
$60.69
|
+3.43
5.99% |
$60.94
|
863,659
117.27% of 50 DAV
50 DAV is 736,500
|
$63.07
-3.77%
|
3/19/2012
|
$56.18
|
PP = $55.10
|
|
MB = $57.86
|
Most Recent Note - 5/29/2012 4:49:45 PM
G - Rebounded back above its 50 DMA line and finished at a new high close with above average volume behind its solid gain today. Recent lows near the $55 area define important chart support to watch where a violation may trigger a worrisome technical sell signal.
>>> The latest Featured Stock Update with an annotated graph appeared on 5/24/2012. Click here.
View all notes |
Alert me of new notes |
CANSLIM.net Company Profile |
SEC |
Zacks Reports |
StockTalk |
News |
Chart |
Request a new note
C
A N
S L
I M
|
SWI
-
NYSE
Solarwinds Inc
COMPUTER SOFTWARE and SERVICES - Application Software
|
$48.12
|
+0.44
0.92% |
$48.64
|
892,594
78.61% of 50 DAV
50 DAV is 1,135,500
|
$48.42
-0.62%
|
4/26/2012
|
$45.15
|
PP = $42.32
|
|
MB = $44.44
|
Most Recent Note - 5/29/2012 4:50:35 PM
G - Inched higher with light volume for another new all-time high today. It did not form a sound new base of sufficient length.
>>> The latest Featured Stock Update with an annotated graph appeared on 5/21/2012. Click here.
View all notes |
Alert me of new notes |
CANSLIM.net Company Profile |
SEC |
Zacks Reports |
StockTalk |
News |
Chart |
Request a new note
C
A N
S L
I M
|
SXCI
-
NASDAQ
S X C Health Solutions
COMPUTER SOFTWARE and SERVICES - Healthcare Information Service
|
$91.34
|
+0.00
0.00% |
$93.00
|
583,302
52.56% of 50 DAV
50 DAV is 1,109,700
|
$100.50
-9.11%
|
2/23/2012
|
$68.24
|
PP = $66.05
|
|
MB = $69.35
|
Most Recent Note - 5/29/2012 4:52:00 PM
G - Volume totals have been cooling while still holding its ground in a tight range. Completed a new Public Offering on 5/10/12. Consolidating in a tight range since it posted huge volume-driven gains on 4/18 and 4/19 while rallying on M&A news.
>>> The latest Featured Stock Update with an annotated graph appeared on 5/17/2012. Click here.
View all notes |
Alert me of new notes |
CANSLIM.net Company Profile |
SEC |
Zacks Reports |
StockTalk |
News |
Chart |
Request a new note
C
A N
S L
I M
|
TDG
-
NYSE
Transdigm Group Inc
AEROSPACE/DEFENSE - Aerospace/Defense Products and; Services
|
$126.34
|
+2.11
1.70% |
$126.34
|
731,236
151.55% of 50 DAV
50 DAV is 482,500
|
$132.69
-4.79%
|
2/29/2012
|
$120.10
|
PP = $118.93
|
|
MB = $124.88
|
Most Recent Note - 5/29/2012 4:53:09 PM
G - Gain today was backed by above average volume. Recently found prompt support at its 50 DMA line and near prior highs.
>>> The latest Featured Stock Update with an annotated graph appeared on 5/23/2012. Click here.
View all notes |
Alert me of new notes |
CANSLIM.net Company Profile |
SEC |
Zacks Reports |
StockTalk |
News |
Chart |
Request a new note
C
A N
S L
I M
|
TNGO
-
NASDAQ
Tangoe Inc
COMPUTER SOFTWARE and SERVICES - Technical and System Software
|
$20.64
|
-0.19
-0.91% |
$21.28
|
479,228
72.84% of 50 DAV
50 DAV is 657,900
|
$23.05
-10.46%
|
3/27/2012
|
$19.35
|
PP = $20.00
|
|
MB = $21.00
|
Most Recent Note - 5/29/2012 4:53:55 PM
G - Volume totals have been drying up while consolidating above prior highs in the $20 area and above important support at its 50 DMA line. It has consolidated below its "max buy" level, however investors' odds are more favorable when buying on strength rather than on pullbacks.
>>> The latest Featured Stock Update with an annotated graph appeared on 5/25/2012. Click here.
View all notes |
Alert me of new notes |
CANSLIM.net Company Profile |
SEC |
Zacks Reports |
StockTalk |
News |
Chart |
Request a new note
C
A N
S L
I M
|
Symbol/Exchange
Company Name
Industry Group |
PRICE |
CHANGE
(%Change) |
Day High |
Volume
(% DAV)
(% 50 day avg vol) |
52 Wk Hi
% From Hi |
Featured
Date |
Price
Featured |
Pivot Featured |
|
Max Buy |
TSCO
-
NASDAQ
Tractor Supply Co
SPECIALTY RETAIL - Specialty Retail, Other
|
$92.47
|
-7.15
-7.18% |
$98.89
|
4,500,303
492.97% of 50 DAV
50 DAV is 912,900
|
$101.20
-8.63%
|
5/1/2012
|
$98.38
|
PP = $101.30
|
|
MB = $106.37
|
Most Recent Note - 5/29/2012 4:55:20 PM
G - Violated its 50 DMA line today, triggering a technical sell signal with a damaging loss with more than 4 times average volume. It did not trigger a new (or add-on) technical buy signal in recent weeks.
>>> The latest Featured Stock Update with an annotated graph appeared on 4/17/2012. Click here.
View all notes |
Alert me of new notes |
CANSLIM.net Company Profile |
SEC |
Zacks Reports |
StockTalk |
News |
Chart |
Request a new note
C
A N
S L
I M
|
UA
-
NYSE
Under Armour Inc Cl A
CONSUMER NON-DURABLES - Textile - Apparel Clothing
|
$100.76
|
+2.57
2.62% |
$100.90
|
1,329,924
145.30% of 50 DAV
50 DAV is 915,300
|
$102.86
-2.04%
|
2/15/2012
|
$85.77
|
PP = $84.86
|
|
MB = $89.10
|
Most Recent Note - 5/29/2012 4:56:55 PM
G - Today's 6th consecutive gain was backed by above average volume as it finished near its best-ever close. Concerns were recently raised by weaker fundamentals, its first quarterly earnings increase below the +25% minimum guideline in more than 2 years.
>>> The latest Featured Stock Update with an annotated graph appeared on 5/29/2012. Click here.
View all notes |
Alert me of new notes |
CANSLIM.net Company Profile |
SEC |
Zacks Reports |
StockTalk |
News |
Chart |
Request a new note
C
A N
S L
I M
|
V
-
NYSE
Visa Inc Cl A
DIVERSIFIED SERVICES - Business/Management Services
|
$120.28
|
+0.91
0.76% |
$120.95
|
4,501,482
124.85% of 50 DAV
50 DAV is 3,605,500
|
$125.35
-4.04%
|
3/12/2012
|
$116.53
|
PP = $119.46
|
|
MB = $125.43
|
Most Recent Note - 5/29/2012 4:58:15 PM
G - Up today with slightly above average volume, rebounding back above its 50 DMA line which helped its outlook improve.
>>> The latest Featured Stock Update with an annotated graph appeared on 5/16/2012. Click here.
View all notes |
Alert me of new notes |
CANSLIM.net Company Profile |
SEC |
Zacks Reports |
StockTalk |
News |
Chart |
Request a new note
C
A N
S L
I M
|
VSI
-
NYSE
Vitamin Shoppe Inc
SPECIALTY RETAIL - Specialty Retail, Other
|
$50.64
|
+0.24
0.48% |
$50.93
|
273,086
57.82% of 50 DAV
50 DAV is 472,300
|
$55.29
-8.41%
|
4/25/2012
|
$47.77
|
PP = $48.46
|
|
MB = $50.88
|
Most Recent Note - 5/29/2012 4:59:08 PM
G - Recent gains have been backed by lighter than average volume as it found some support near its old highs and halted a streak of 5 consecutive losses since a negative reversal at its 52-week high.
>>> The latest Featured Stock Update with an annotated graph appeared on 4/25/2012. Click here.
View all notes |
Alert me of new notes |
CANSLIM.net Company Profile |
SEC |
Zacks Reports |
StockTalk |
News |
Chart |
Request a new note
C
A N
S L
I M
|
WFM
-
NASDAQ
Whole Foods Market Inc
RETAIL - Grocery Stores
|
$89.35
|
+2.08
2.38% |
$89.37
|
1,708,999
104.67% of 50 DAV
50 DAV is 1,632,700
|
$91.50
-2.35%
|
5/3/2012
|
$90.28
|
PP = $86.45
|
|
MB = $90.77
|
Most Recent Note - 5/29/2012 5:00:16 PM
G - Up today with average volume. Found prompt support last week as it rebounded above its 50 DMA line following a streak of 5 consecutive losses which completely negated the latest breakout. It stalled following its considerable "breakaway gap" on 5/03/12.
>>> The latest Featured Stock Update with an annotated graph appeared on 5/11/2012. Click here.
View all notes |
Alert me of new notes |
CANSLIM.net Company Profile |
SEC |
Zacks Reports |
StockTalk |
News |
Chart |
Request a new note
C
A N
S L
I M
|
Symbol/Exchange
Company Name
Industry Group |
PRICE |
CHANGE
(%Change) |
Day High |
Volume
(% DAV)
(% 50 day avg vol) |
52 Wk Hi
% From Hi |
Featured
Date |
Price
Featured |
Pivot Featured |
|
Max Buy |
|
|
|
THESE ARE NOT BUY RECOMMENDATIONS!
Comments contained in the body of this report are technical
opinions only. The material herein has been obtained
from sources believed to be reliable and accurate, however,
its accuracy and completeness cannot be guaranteed.
This site is not an investment advisor, hence it does
not endorse or recommend any securities or other investments.
Any recommendation contained in this report may not
be suitable for all investors and it is not to be deemed
an offer or solicitation on our part with respect to
the purchase or sale of any securities. All trademarks,
service marks and trade names appearing in this report
are the property of their respective owners, and are
likewise used for identification purposes only.
This report is a service available
only to active Paid Premium Members.
You may opt-out of receiving report notifications
at any time. Questions or comments may be submitted
by writing to Premium Membership Services 665 S.E. 10 Street, Suite 201 Deerfield Beach, FL 33441-5634 or by calling 1-800-965-8307
or 954-785-1121.
|
|
|

