You are not logged in.
This means you
CAN ONLY VIEW reports that were published prior to Monday, April 14, 2025.
You
MUST UPGRADE YOUR MEMBERSHIP if you want to see any current reports.
AFTER MARKET UPDATE - TUESDAY, MAY 28TH, 2013
Previous After Market Report Next After Market Report >>>
|
|
|
|
DOW |
+106.29 |
15,409.39 |
+0.69% |
|
Volume |
733,959,340 |
+24% |
|
Volume |
1,678,766,240 |
+19% |
|
NASDAQ |
+29.75 |
3,488.89 |
+0.86% |
|
Advancers |
1,776 |
57% |
|
Advancers |
1,771 |
68% |
|
S&P 500 |
+10.46 |
1,660.06 |
+0.63% |
|
Decliners |
1,278 |
41% |
|
Decliners |
746 |
29% |
|
Russell 2000 |
+13.08 |
997.35 |
+1.33% |
|
52 Wk Highs |
259 |
|
|
52 Wk Highs |
245 |
|
|
S&P 600 |
+7.36 |
560.54 |
+1.33% |
|
52 Wk Lows |
41 |
|
|
52 Wk Lows |
21 |
|
|
 |
Major Averages Returned to Rally Mode Following Memorial Day
Kenneth J. Gruneisen - Passed the CAN SLIM® Master's Exam
The Dow Jones Industrial Average, S&P 500 Index, and the Nasdaq Composite Index started the week with solid gains yet ended well off of Tuesday's session highs. The volume totals were reported much higher than Friday's light totals on the Nasdaq exchange and on the NYSE as traders returned from the long Memorial Day weekend. Advancers led decliners by a 3-2 margin on the NYSE and advancers led decliners by better than a 2-1 margin on the Nasdaq exchange. There were 72 high-ranked companies from the CANSLIM.net Leaders List making new 52-week highs and appearing on the CANSLIM.net BreakOuts Page, up considerably from the prior session total of 17 stocks. New 52-week highs solidly outnumbered new 52-week lows on both the NYSE and the Nasdaq exchange. There were gains for 9 of the 14 high-ranked companies currently included on the Featured Stocks Page.
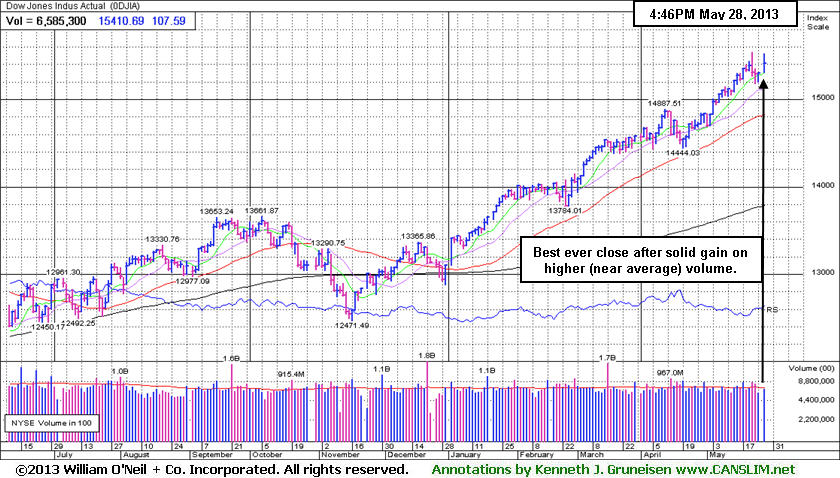
The major average closed off session highs but still finished firmly in positive territory on Tuesday. The Dow was up as many as 218 points before ending with a 106 point gain at 15,409. The S&P 500 added 10 points to 1,660. The Nasdaq Composite advanced 30 points to 3,488. The major averages rebounded from last week's retreat after investors received encouraging updates on the U.S. economy. Stocks rose after reports showed home prices increased the most in seven years in March and consumer confidence unexpectedly strengthened in May to its best level since February 2008.
On the earnings front, Tiffany & Co (TIF +3.95%) rallied following its better-than-expected quarterly results. Health care was the best performing sector on the session. Shares of Valeant Pharmaceuticals (VRX +8.7%) spiked higher after the Canadian drug maker agreed to purchase privately-held eye care company Bausch & Lomb for $8.7 billion. Bank stocks paced financials higher after Moody's Inc (MCO +0.57%) upgraded its outlook for the industry. Citigroup Inc (C +2.50%) and JP Morgan Chase & Co (JPM +1.75%) were higher. Utilities underperformed with Exelon Corp (EXC -7.53%) down considerably. Energy also outperformed with Exxon (XOM +0.93%) edging higher.
Treasuries fell sharply with the 10-year note declining a point and 15/32 to yield 2.17%.
The market (M criteria) uptrend has lifted the Dow Jones Industrial Average and the S&P 500 Index to new record highs. The indices' rally to new highs confirmed the market's uptrend which means odds are favorable for new buying efforts in stocks meeting all of the fact-based investment system's key criteria. Action-worthy leaders best matching the winning models are covered on an ongoing basis on the Featured Stocks Page - including our Certified experts' latest notes and links to additional resources including detailed analysis with annotated graphs.
The Premium Member Homepage - includes "dynamic archives" to all prior pay reports published. Watch for an announcement via email concerning the next WEBCAST.
PICTURED: The Dow Jones Industrial Average finished at a best-ever close on Tuesday with a gain on higher (near average) volume.
|
 Kenneth J. Gruneisen started out as a licensed stockbroker in August 1987, a couple of months prior to the historic stock market crash that took the Dow Jones Industrial Average down -22.6% in a single day. He has published daily fact-based fundamental and technical analysis on high-ranked stocks online for two decades. Through FACTBASEDINVESTING.COM, Kenneth provides educational articles, news, market commentary, and other information regarding proven investment systems that work in good times and bad.
Comments contained in the body of this report are technical opinions only and are not necessarily those of Gruneisen Growth Corp. The material herein has been obtained from sources believed to be reliable and accurate, however, its accuracy and completeness cannot be guaranteed. Our firm, employees, and customers may effect transactions, including transactions contrary to any recommendation herein, or have positions in the securities mentioned herein or options with respect thereto. Any recommendation contained in this report may not be suitable for all investors and it is not to be deemed an offer or solicitation on our part with respect to the purchase or sale of any securities. |
|
 |
| Oil Services |
$OSX |
261.46 |
+2.09 |
+0.81% |
+18.76% |
| Healthcare |
$HMO |
3,144.29 |
+73.78 |
+2.40% |
+25.06% |
| Integrated Oil |
$XOI |
1,413.62 |
+15.81 |
+1.13% |
+13.83% |
| Semiconductor |
$SOX |
465.94 |
+4.44 |
+0.96% |
+21.32% |
| Networking |
$NWX |
244.83 |
+6.11 |
+2.56% |
+8.07% |
| Internet |
$IIX |
382.34 |
+2.66 |
+0.70% |
+16.92% |
| Broker/Dealer |
$XBD |
124.28 |
+2.86 |
+2.35% |
+31.75% |
| Retail |
$RLX |
793.46 |
+4.70 |
+0.60% |
+21.50% |
| Gold & Silver |
$XAU |
100.05 |
-0.53 |
-0.53% |
-39.58% |
| Bank |
$BKX |
61.68 |
+0.80 |
+1.31% |
+20.28% |
| Biotech |
$BTK |
2,014.59 |
+31.96 |
+1.61% |
+30.22% |
|
|
|
 |
Slumping Just Under Prior Highs
Kenneth J. Gruneisen - Passed the CAN SLIM® Master's Exam
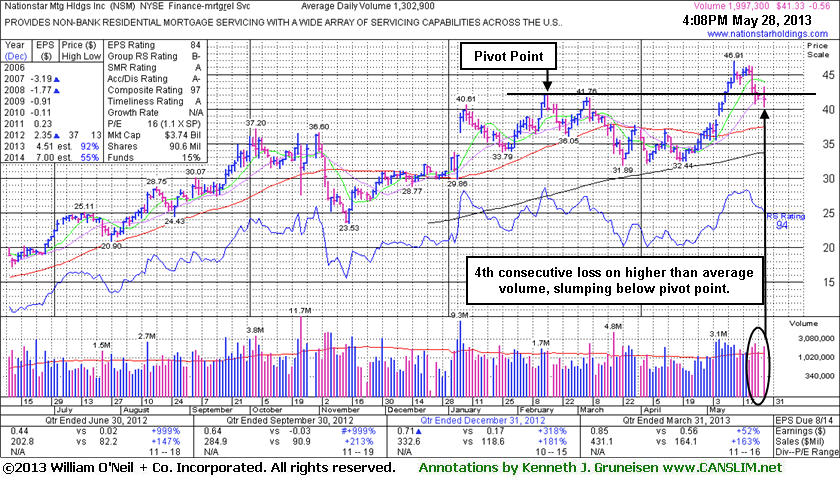
Nationstar Mtg Hldgs Inc (NSM -$0.39 or -0.93% to $41.50) has shown resilience near prior highs, but today it tallied its 5th consecutive loss with above average volume. It was previously noted that prior chart highs define initial chart support above its 50-day moving average (DMA) line (now $37.46). Disciplined investors alway limit losses by selling any stock that falls more than -7% from their purchase price. Any more damaging losses could raise more serious concerns and trigger more worrisome sell signals.
Nationstar clinched a technical buy signal while tallying a streak of volume-driven gains after its last appearance in this FSU section with an annotated graph on 5/07/13 under the headline, "Forming New Base and Fundamentals Remain Strong". It had been highlighted in yellow with pivot point cited based on its 2/15/13 high plus 10 cents in the 5/07/13 mid-day report (read here) while noted - "Its fundamentals remain favorable with respect to the C and A criteria. Today it gapped up nearly challenging its 52-week high and previously stubborn resistance in the $41-42 area with a considerable volume-driven gain. It still faces some resistance due to overhead supply. Disciplined investors will watch for convincing proof of fresh institutional buying demand to trigger a new technical buy signal before taking action."
It reported strong earnings and sales increases for the Mar '13 quarter well above the +25% minimum guideline (C criteria), continuing its strong earnings growth history. The Finance - Mortgage Related Services group has a Group Relative Strength Rating of B-, and leadership from at least one other high-ranked company in the group is a reassuring sign concerning the L criteria. NSM has attracted increasing ownership interest from top-rated funds, rising from 119 funds in Jun '12 to 207 in Mar '13, a reassuring sign concerning the I criteria.
 |
|
|
Color Codes Explained :
Y - Better candidates highlighted by our
staff of experts.
G - Previously featured
in past reports as yellow but may no longer be buyable under the
guidelines.
***Last / Change / Volume data in this table is the closing quote data***
Nationstar Mtg Hldgs Inc (NSM -$0.39 or -0.93% to $41.50) has shown resilience near prior highs, but today it tallied its 5th consecutive loss with above average volume. It was previously noted that prior chart highs define initial chart support above its 50-day moving average (DMA) line (now $37.46). Disciplined investors alway limit losses by selling any stock that falls more than -7% from their purchase price. Any more damaging losses could raise more serious concerns and trigger more worrisome sell signals.
Nationstar clinched a technical buy signal while tallying a streak of volume-driven gains after its last appearance in this FSU section with an annotated graph on 5/07/13 under the headline, "Forming New Base and Fundamentals Remain Strong". It had been highlighted in yellow with pivot point cited based on its 2/15/13 high plus 10 cents in the 5/07/13 mid-day report (read here) while noted - "Its fundamentals remain favorable with respect to the C and A criteria. Today it gapped up nearly challenging its 52-week high and previously stubborn resistance in the $41-42 area with a considerable volume-driven gain. It still faces some resistance due to overhead supply. Disciplined investors will watch for convincing proof of fresh institutional buying demand to trigger a new technical buy signal before taking action."
It reported strong earnings and sales increases for the Mar '13 quarter well above the +25% minimum guideline (C criteria), continuing its strong earnings growth history. The Finance - Mortgage Related Services group has a Group Relative Strength Rating of B-, and leadership from at least one other high-ranked company in the group is a reassuring sign concerning the L criteria. NSM has attracted increasing ownership interest from top-rated funds, rising from 119 funds in Jun '12 to 207 in Mar '13, a reassuring sign concerning the I criteria.
|
|
|
THESE ARE NOT BUY RECOMMENDATIONS!
Comments contained in the body of this report are technical
opinions only. The material herein has been obtained
from sources believed to be reliable and accurate, however,
its accuracy and completeness cannot be guaranteed.
This site is not an investment advisor, hence it does
not endorse or recommend any securities or other investments.
Any recommendation contained in this report may not
be suitable for all investors and it is not to be deemed
an offer or solicitation on our part with respect to
the purchase or sale of any securities. All trademarks,
service marks and trade names appearing in this report
are the property of their respective owners, and are
likewise used for identification purposes only.
This report is a service available
only to active Paid Premium Members.
You may opt-out of receiving report notifications
at any time. Questions or comments may be submitted
by writing to Premium Membership Services 665 S.E. 10 Street, Suite 201 Deerfield Beach, FL 33441-5634 or by calling 1-800-965-8307
or 954-785-1121.
|
|
|

