You are not logged in.
This means you
CAN ONLY VIEW reports that were published prior to Monday, April 14, 2025.
You
MUST UPGRADE YOUR MEMBERSHIP if you want to see any current reports.
AFTER MARKET UPDATE - FRIDAY, MAY 27TH, 2011
Previous After Market Report Next After Market Report >>>
|
|
|
|
DOW |
+38.82 |
12,441.58 |
+0.31% |
|
Volume |
691,940,500 |
-20% |
|
Volume |
1,618,130,950 |
-13% |
|
NASDAQ |
+13.94 |
2,796.86 |
+0.50% |
|
Advancers |
2,165 |
69% |
|
Advancers |
1,634 |
60% |
|
S&P 500 |
+5.41 |
1,331.10 |
+0.41% |
|
Decliners |
841 |
27% |
|
Decliners |
956 |
35% |
|
Russell 2000 |
+5.39 |
836.26 |
+0.65% |
|
52 Wk Highs |
112 |
|
|
52 Wk Highs |
87 |
|
|
S&P 600 |
+2.75 |
446.54 |
+0.62% |
|
52 Wk Lows |
8 |
|
|
52 Wk Lows |
33 |
|
|
 |
Major Indices Quietly Recovered Above Their 50-Day Averages
Kenneth J. Gruneisen - Passed the CAN SLIM® Master's Exam
All three major averages lost ground for the week as the Dow Jones Industrial Average was down -0.6%, the S&P 500 Index fell fell -0.2%, and the Nasdaq Composite Index lost -0.2%. Friday marked a third consecutive day of small gains for the major averages, with volume totals lighter than the prior session on the Nasdaq exchange and on the NYSE as traders exited early for the Memorial Day weekend. Advancing issues beat decliners by 11-4 on the NYSE and by 16-9 on the Nasdaq. New 52-week highs outnumbered new 52-week lows on the NYSE and on the Nasdaq exchange. Leadership also improved again as there were 45 high-ranked companies from the CANSLIM.net Leaders List that made new 52-week highs and appeared on the CANSLIM.net BreakOuts Page, up from the total of 32 on the prior session. There were gains from 11 of the 15 high-ranked leaders currently included on the Featured Stocks Page.
The market embraced a positive view on global growth after a statement from leaders of G-8 nations suggesting that the global economy is gaining strength. A better-than-forecast reading of U.S. consumer sentiment was also a positive factor. However, gloomy news on the housing industry hurt sentiment as pending home sales in April plunged 11.6% from March. Bad weather in many parts of the country may have affected sales.
CVS Caremark Corp (CVS +1.7%) rallied after the company won a big government contract. Meanwhile, there was a big loss for Medco-Health Solutions Inc (MHS -8.97%), which previously held the contract. Marvell Technology Group Ltd (MRVL +11.1%) rallied after its optimistic forecast eased concerns that the personal computer market is in a slump.
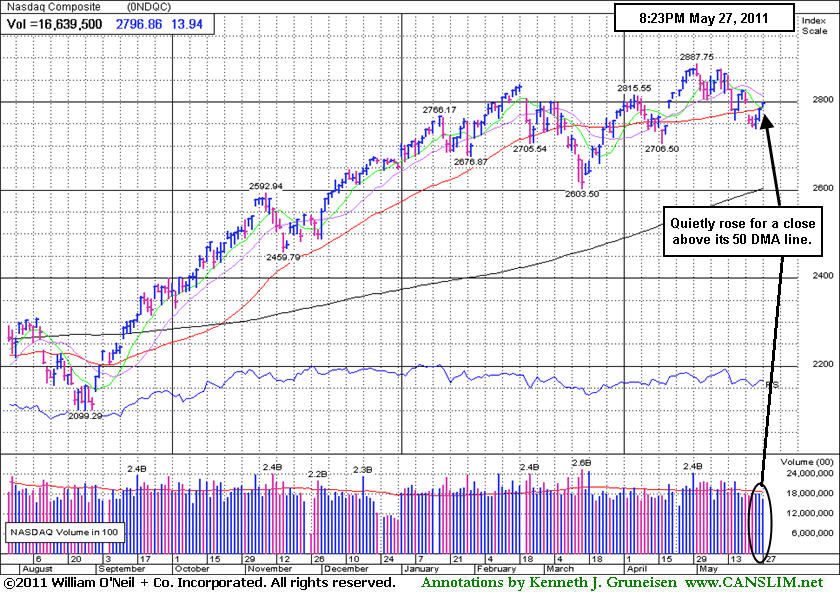
The stock market has been recovering from losses early this week which caused the Nasdaq Composite Index, S&P 500 Index, and Dow Jones Industrial Average to violate their respective 50--day moving average (DMA) lines. All of the above mentioned indexes managed to close the week back above their 50 DMA lines after Friday's gains. The indices' respective April lows define the next important chart levels to watch in the event of additional weakness. The weak technical action in the major indices has raised greater concerns. The recent slump suggested that market (M criteria) conditions have deteriorated from an "uptrend under pressure" to what may be a longer and more substantial correction. Until the nascent rally attempt produces a solid follow-through day as confirmation, disciplined investors know it is probably best to avoid new buying efforts and stay with a defensive stance.
PICTURED: The Nasdaq Composite Index posted a third consecutive gain to quietly close the week above its 50-day moving average (DMA) line.
|
 Kenneth J. Gruneisen started out as a licensed stockbroker in August 1987, a couple of months prior to the historic stock market crash that took the Dow Jones Industrial Average down -22.6% in a single day. He has published daily fact-based fundamental and technical analysis on high-ranked stocks online for two decades. Through FACTBASEDINVESTING.COM, Kenneth provides educational articles, news, market commentary, and other information regarding proven investment systems that work in good times and bad.
Comments contained in the body of this report are technical opinions only and are not necessarily those of Gruneisen Growth Corp. The material herein has been obtained from sources believed to be reliable and accurate, however, its accuracy and completeness cannot be guaranteed. Our firm, employees, and customers may effect transactions, including transactions contrary to any recommendation herein, or have positions in the securities mentioned herein or options with respect thereto. Any recommendation contained in this report may not be suitable for all investors and it is not to be deemed an offer or solicitation on our part with respect to the purchase or sale of any securities. |
|
 |
Financial, Tech, and Defensive Groups Post Quiet Gains
Kenneth J. Gruneisen - Passed the CAN SLIM® Master's Exam
The Broker/Dealer Index ($XBD +1.35%) and Bank Index ($BKX +1.37%) posted gains on Friday. The bank index closed at its 200-day moving average (DMA) line while the broker/dealer index remains below its long-term average. The Retail Index ($RLX -0.09%) ended with a small loss, meanwhile the tech sector had a positive bias as the Networking Index ($NWX +0.95%), Semiconductor Index ($SOX +1.13%), and Internet Index ($IIX +0.64%) posted gains outpacing the Biotechnology Index ($BTK +0.10%). Defensive groups had a positive bias as the Gold & Silver Index ($XAU +1.47%) and Healthcare Index ($HMO +0.72%) rose. Energy-related issues were mixed as the Oil Services Index ($OSX -0.37%) edged lower and the Integrated Oil Index ($XOI +0.55%) posted a modest gain.
Charts courtesy www.stockcharts.com
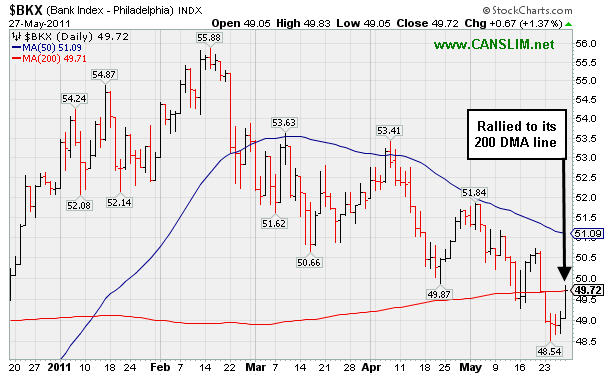
PICTURED: The Bank Index ($BKX +1.37%) posted rallied to its 200-day moving average (DMA) line. Its worrisome series of lower highs and lower lows remains a concern until more meaningful progress is made.
| Oil Services |
$OSX |
271.00 |
-1.02 |
-0.37% |
+10.56% |
| Healthcare |
$HMO |
2,376.81 |
+17.10 |
+0.72% |
+40.47% |
| Integrated Oil |
$XOI |
1,315.40 |
+7.16 |
+0.55% |
+8.43% |
| Semiconductor |
$SOX |
433.09 |
+4.85 |
+1.13% |
+5.16% |
| Networking |
$NWX |
317.65 |
+3.00 |
+0.95% |
+13.22% |
| Internet |
$IIX |
317.38 |
+2.03 |
+0.64% |
+3.14% |
| Broker/Dealer |
$XBD |
114.66 |
+1.53 |
+1.35% |
-5.64% |
| Retail |
$RLX |
529.38 |
-0.48 |
-0.09% |
+4.13% |
| Gold & Silver |
$XAU |
208.47 |
+3.01 |
+1.47% |
-7.99% |
| Bank |
$BKX |
49.72 |
+0.67 |
+1.37% |
-4.77% |
| Biotech |
$BTK |
1,462.14 |
+1.50 |
+0.10% |
+12.68% |
|
|
|
 |
Damaging Losses Triggered Sell Signal
Kenneth J. Gruneisen - Passed the CAN SLIM® Master's Exam
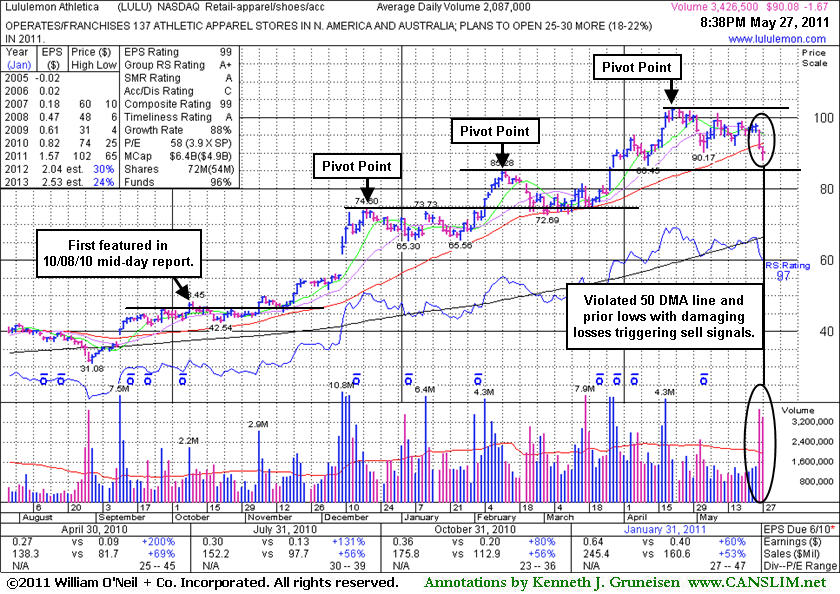
Lululemon Athletica (LULU -$1.67 or -1.82% to $90.08) was down again today with above average volume, slumping below its 50-day moving averages (DMA) line triggering technical sell signals with 2 consecutive damaging losses on above average volume to end this week. This high-ranked Retail-Apparel firm failed to confirm a recent buy signal since a new pivot point was cited. A prompt rebound of the 50 DMA line would help its outlook, technically, and it could go on to produce more climactic gains. However, recent weakness suggests that it may be due for a longer and deeper consolidation.
Following its last appearance in this FSU section on 5/03/11 with an annotated graph under the headline, "Distributional Pressure After +115% Rally In Under 7 Months", it had been consolidating above its 50-day moving average (DMA) line while volume totals cooled. LULU was first featured in yellow at $47.66 in the October 8, 2010 mid-day report report (read here) and it traded up as much as +115.7% in less than 7 months.
The number of top-rated funds owning its shares fell to 297 in Mar '11 from 303 in Dec '10, which is a slightly disconcerting indication concerning the I criteria. Its board of directors recently approved a 2-for-1 stock split (pending). The 5 latest quarterly comparisons showed strong sales revenues and impressive earnings increases (C criteria), and it maintained a good annual earnings history (A criteria) despite a patch of negative comparisons in early '09.
|
|
|
Color Codes Explained :
Y - Better candidates highlighted by our
staff of experts.
G - Previously featured
in past reports as yellow but may no longer be buyable under the
guidelines.
***Last / Change / Volume data in this table is the closing quote data***
Symbol/Exchange
Company Name
Industry Group |
PRICE |
CHANGE
(%Change) |
Day High |
Volume
(% DAV)
(% 50 day avg vol) |
52 Wk Hi
% From Hi |
Featured
Date |
Price
Featured |
Pivot Featured |
|
Max Buy |
CEVA
-
NASDAQ
Ceva Inc
ELECTRONICS - Semiconductor - Specialized
|
$34.23
|
+0.88
2.64% |
$34.34
|
284,577
133.67% of 50 DAV
50 DAV is 212,900
|
$33.85
1.12%
|
5/25/2011
|
$32.98
|
PP = $32.05
|
|
MB = $33.65
|
 Most Recent Note - 5/27/2011 3:51:46 PM
G - Hit another new 52-week high today with above average volume while rising beyond its "max buy" level. Color code is changed to green after getting extended more than +5% above prior highs. The M criteria is an overriding concern arguing against new buying efforts until a follow-through day from at least one of the major averages confirms a new rally.
>>> The latest Featured Stock Update with an annotated graph appeared on 5/25/2011. Click here.
View all notes |
Alert me of new notes |
CANSLIM.net Company Profile |
SEC |
Zacks Reports |
StockTalk |
News |
Chart |
Request a new note
C
A N
S L
I M


|
CMG
-
NYSE
Chipotle Mexican Grill
LEISURE - Restaurants
|
$292.94
|
+2.06
0.71% |
$293.99
|
765,121
69.79% of 50 DAV
50 DAV is 1,096,300
|
$291.21
0.59%
|
4/1/2011
|
$274.00
|
PP = $275.10
|
|
MB = $288.86
|
Most Recent Note - 5/26/2011 3:19:38 PM
G - Inching higher today with very quiet volume while reaching a new all-time high, and no resistance remains due to overhead supply. Formed a 5-week base with volume totals cooling in recent weeks while finding support near its 50 DMA line. Its sub par earnings increase of +23% in the latest quarter ended March 31st, 2011 versus the year ago period raised concern while marking its weakest quarterly earnings increase in more than 2 years.
>>> The latest Featured Stock Update with an annotated graph appeared on 5/17/2011. Click here.
View all notes |
Alert me of new notes |
CANSLIM.net Company Profile |
SEC |
Zacks Reports |
StockTalk |
News |
Chart |
Request a new note
C
A N
S L
I M
|
EZPW
-
NASDAQ
Ezcorp Inc Cl A
SPECIALTY RETAIL - Specialty Retail, Other
|
$31.21
|
+0.15
0.48% |
$31.31
|
251,123
72.54% of 50 DAV
50 DAV is 346,200
|
$33.08
-5.65%
|
2/18/2011
|
$27.94
|
PP = $30.04
|
|
MB = $31.54
|
Most Recent Note - 5/23/2011 4:16:24 PM
G - Small loss on light volume after gapping down today. Continuing its healthy consolidation above its 50 DMA line. It has not formed a sound new base pattern. Recent lows define important nearby chart support to watch where technical violations would raise more serious concerns.
>>> The latest Featured Stock Update with an annotated graph appeared on 5/10/2011. Click here.
View all notes |
Alert me of new notes |
CANSLIM.net Company Profile |
SEC |
Zacks Reports |
StockTalk |
News |
Chart |
Request a new note
C
A N
S L
I M
|
FOSL
-
NASDAQ
Fossil Inc
CONSUMER DURABLES - Recreational Goods, Other
|
$105.28
|
+0.13
0.12% |
$106.00
|
299,710
37.12% of 50 DAV
50 DAV is 807,500
|
$107.54
-2.10%
|
2/1/2011
|
$73.30
|
PP = $74.44
|
|
MB = $78.16
|
Most Recent Note - 5/26/2011 2:52:20 PM
G - Volume totals have been cooling while consolidating in a tight range since its considerable gap up gain on 5/10/11 for a new all-time high. It is extended from any sound base. Prior highs near $96 define initial support to watch above its 50 DMA line.
>>> The latest Featured Stock Update with an annotated graph appeared on 5/2/2011. Click here.
View all notes |
Alert me of new notes |
CANSLIM.net Company Profile |
SEC |
Zacks Reports |
StockTalk |
News |
Chart |
Request a new note
C
A N
S L
I M
|
HMSY
-
NASDAQ
H M S Holdings Corp
COMPUTER SOFTWARE and SERVICES - Healthcare Information Service
|
$77.67
|
+0.34
0.44% |
$77.96
|
61,096
37.81% of 50 DAV
50 DAV is 161,600
|
$84.82
-8.43%
|
11/19/2010
|
$61.89
|
PP = $63.01
|
|
MB = $66.16
|
Most Recent Note - 5/23/2011 4:20:53 PM
G - Small gap down today on near average volume. Its has lingered for the past 3 weeks below its 50 DMA line which may now act as resistance. A rally above it would improve its technical stance. Deterioration below its recent chart low ($73.27) would raise more serious concerns and trigger an additional sell signal.
>>> The latest Featured Stock Update with an annotated graph appeared on 5/23/2011. Click here.
View all notes |
Alert me of new notes |
CANSLIM.net Company Profile |
SEC |
Zacks Reports |
StockTalk |
News |
Chart |
Request a new note
C
A N
S L
I M
|
Symbol/Exchange
Company Name
Industry Group |
PRICE |
CHANGE
(%Change) |
Day High |
Volume
(% DAV)
(% 50 day avg vol) |
52 Wk Hi
% From Hi |
Featured
Date |
Price
Featured |
Pivot Featured |
|
Max Buy |
HS
-
NYSE
Healthspring Inc
HEALTH SERVICES - Health Care Plans
|
$42.67
|
+0.20
0.47% |
$42.95
|
485,691
49.58% of 50 DAV
50 DAV is 979,700
|
$45.11
-5.41%
|
3/22/2011
|
$38.29
|
PP = $38.85
|
|
MB = $40.79
|
Most Recent Note - 5/24/2011 4:47:03 PM
G - Down on light volume today for a third consecutive loss, slumping toward prior highs closely coinciding with its 50 DMA line which define important chart support to watch. Violations would trigger technical sell signals.
>>> The latest Featured Stock Update with an annotated graph appeared on 5/20/2011. Click here.
View all notes |
Alert me of new notes |
CANSLIM.net Company Profile |
SEC |
Zacks Reports |
StockTalk |
News |
Chart |
Request a new note
C
A N
S L
I M
|
INFA
-
NASDAQ
Informatica Corp
COMPUTER SOFTWARE and SERVICES - Business Software and Services
|
$57.85
|
+1.58
2.81% |
$58.31
|
1,702,452
156.92% of 50 DAV
50 DAV is 1,084,900
|
$56.49
2.41%
|
3/24/2011
|
$50.04
|
PP = $49.86
|
|
MB = $52.35
|
Most Recent Note - 5/27/2011 2:16:02 PM
G - Hitting a new 52-week high today with a 3rd consecutive gain. This high-ranked Computer Software - Database firm did not form a sound new base pattern. Its 50 DMA line defines near-term support to watch.
>>> The latest Featured Stock Update with an annotated graph appeared on 5/24/2011. Click here.
View all notes |
Alert me of new notes |
CANSLIM.net Company Profile |
SEC |
Zacks Reports |
StockTalk |
News |
Chart |
Request a new note
C
A N
S L
I M
|
LULU
-
NASDAQ
Lululemon Athletica
MANUFACTURING - Textile Manufacturing
|
$90.08
|
-1.67
-1.82% |
$91.65
|
3,454,871
165.54% of 50 DAV
50 DAV is 2,087,000
|
$102.83
-12.40%
|
5/18/2011
|
$98.15
|
PP = $102.93
|
|
MB = $108.08
|
Most Recent Note - 5/27/2011 2:05:41 PM
G - Down again today with above average volume, slumping further below its 50 DMA line triggering technical sell signals with damaging losses on above average volume. This high-ranked Retail-Apparel firm's color code was changed to green. It failed to confirm a recent buy signal since a new pivot point was recently cited.
>>> The latest Featured Stock Update with an annotated graph appeared on 5/27/2011. Click here.
View all notes |
Alert me of new notes |
CANSLIM.net Company Profile |
SEC |
Zacks Reports |
StockTalk |
News |
Chart |
Request a new note
C
A N
S L
I M
|
MG
-
NYSE
Mistras Group Inc
DIVERSIFIED SERVICES - Bulding and Faci;ity Management Services
|
$16.79
|
-0.15
-0.89% |
$17.03
|
42,115
26.00% of 50 DAV
50 DAV is 162,000
|
$18.46
-9.05%
|
3/15/2011
|
$15.48
|
PP = $15.90
|
|
MB = $16.70
|
Most Recent Note - 5/26/2011 2:55:07 PM
G - Today's gain on light volume has it approaching its 50 DMA line. Gains above that short-term average would help its outlook, technically, meanwhile the recent low ($15.44 on 5/05/11) defines the next chart support. Completed a new Public Offering on 5/05/11.
>>> The latest Featured Stock Update with an annotated graph appeared on 5/12/2011. Click here.
View all notes |
Alert me of new notes |
CANSLIM.net Company Profile |
SEC |
Zacks Reports |
StockTalk |
News |
Chart |
Request a new note
C
A N
S L
I M
|
MWIV
-
NASDAQ
M W I Veterinary Supply
HEALTH SERVICES - Medical Instruments and; Supplies
|
$82.67
|
+0.31
0.38% |
$83.04
|
59,599
69.22% of 50 DAV
50 DAV is 86,100
|
$86.99
-4.97%
|
11/4/2010
|
$61.79
|
PP = $59.60
|
|
MB = $62.58
|
Most Recent Note - 5/26/2011 2:57:20 PM
G - Hovering in a tight trading range just above its 50 DMA and near its all-time high with volume totals still cooling since 5/05/11. Stubbornly holding its ground, but it has not formed a sound base pattern. Its 50 DMA line defines important support to watch.
>>> The latest Featured Stock Update with an annotated graph appeared on 5/5/2011. Click here.
View all notes |
Alert me of new notes |
CANSLIM.net Company Profile |
SEC |
Zacks Reports |
StockTalk |
News |
Chart |
Request a new note
C
A N
S L
I M
|
Symbol/Exchange
Company Name
Industry Group |
PRICE |
CHANGE
(%Change) |
Day High |
Volume
(% DAV)
(% 50 day avg vol) |
52 Wk Hi
% From Hi |
Featured
Date |
Price
Featured |
Pivot Featured |
|
Max Buy |
OPNT
-
NASDAQ
Opnet Technologies
INTERNET - Internet Software and Services
|
$39.56
|
+0.28
0.71% |
$39.96
|
113,288
91.58% of 50 DAV
50 DAV is 123,700
|
$42.51
-6.94%
|
5/11/2011
|
$41.21
|
PP = $40.50
|
|
MB = $42.53
|
Most Recent Note - 5/26/2011 3:09:44 PM
G - Up today with higher volume (but still below average) while repairing its brief 50 DMA line breach helps its outlook, technically. Its color code was changed to green after it completely negated its latest breakout, yet it now faces very little resistance due to overhead supply.
>>> The latest Featured Stock Update with an annotated graph appeared on 5/11/2011. Click here.
View all notes |
Alert me of new notes |
CANSLIM.net Company Profile |
SEC |
Zacks Reports |
StockTalk |
News |
Chart |
Request a new note
C
A N
S L
I M
|
PCLN
-
NASDAQ
Priceline.Com Inc
INTERNET - Internet Software and Services
|
$501.44
|
-3.67
-0.73% |
$509.65
|
627,003
56.14% of 50 DAV
50 DAV is 1,116,800
|
$561.88
-10.76%
|
1/3/2011
|
$399.55
|
PP = $428.20
|
|
MB = $449.61
|
Most Recent Note - 5/23/2011 3:55:20 PM
G - Gapped down today, violating its 50 DMA line again with a loss on higher volume indicative of more distributional pressure. Recent chart low ($493.67 on 5/17/11) defines an important near-term support level where further deterioration would raise even greater concerns.
>>> The latest Featured Stock Update with an annotated graph appeared on 5/19/2011. Click here.
View all notes |
Alert me of new notes |
CANSLIM.net Company Profile |
SEC |
Zacks Reports |
StockTalk |
News |
Chart |
Request a new note
C
A N
S L
I M
|
RAX
-
NYSE
Rackspace Hosting Inc
INTERNET - Internet Software and; Services
|
$43.70
|
+1.04
2.44% |
$43.72
|
1,571,181
89.20% of 50 DAV
50 DAV is 1,761,500
|
$46.50
-6.01%
|
3/16/2011
|
$36.28
|
PP = $40.72
|
|
MB = $42.76
|
Most Recent Note - 5/27/2011 2:43:44 PM
G - Up today for a 3rd consecutive gain with very light volume, consolidating above its 50 DMA line. It has not formed a sound new base pattern but may eventually form a new "late-stage" base. Meanwhile, deterioration below its recent chart low ($38.84 on 5/12/11) would trigger more worrisome technical sell signals.
>>> The latest Featured Stock Update with an annotated graph appeared on 5/13/2011. Click here.
View all notes |
Alert me of new notes |
CANSLIM.net Company Profile |
SEC |
Zacks Reports |
StockTalk |
News |
Chart |
Request a new note
C
A N
S L
I M
|
TIBX
-
NASDAQ
Tibco Software Inc
COMPUTER SOFTWARE and SERVICES - Business Software and Services
|
$28.31
|
-0.39
-1.36% |
$28.88
|
1,839,420
69.81% of 50 DAV
50 DAV is 2,634,800
|
$30.75
-7.93%
|
3/18/2011
|
$23.88
|
PP = $26.04
|
|
MB = $27.34
|
Most Recent Note - 5/26/2011 3:05:24 PM
G - Up today with light volume, positively reversing after starting the session with a small gap down just below its 50 DMA line and dipping near the recent low ($27.17). More damaging violations may trigger technical sell signals.
>>> The latest Featured Stock Update with an annotated graph appeared on 5/18/2011. Click here.
View all notes |
Alert me of new notes |
CANSLIM.net Company Profile |
SEC |
Zacks Reports |
StockTalk |
News |
Chart |
Request a new note
C
A N
S L
I M
|
ULTA
-
NASDAQ
Ulta Salon Cosm & Frag
SPECIALTY RETAIL - Specialty Retail, Other
|
$55.25
|
+0.70
1.28% |
$55.29
|
306,283
62.04% of 50 DAV
50 DAV is 493,700
|
$56.87
-2.85%
|
1/6/2011
|
$36.12
|
PP = $37.34
|
|
MB = $39.21
|
Most Recent Note - 5/26/2011 2:49:14 PM
G - Rallying within close striking distance of its all-time high today after finding support above its 50 DMA line this week. It is extended from any sound base pattern.
>>> The latest Featured Stock Update with an annotated graph appeared on 5/26/2011. Click here.
View all notes |
Alert me of new notes |
CANSLIM.net Company Profile |
SEC |
Zacks Reports |
StockTalk |
News |
Chart |
Request a new note
C
A N
S L
I M
|
Symbol/Exchange
Company Name
Industry Group |
PRICE |
CHANGE
(%Change) |
Day High |
Volume
(% DAV)
(% 50 day avg vol) |
52 Wk Hi
% From Hi |
Featured
Date |
Price
Featured |
Pivot Featured |
|
Max Buy |
|
|
|
THESE ARE NOT BUY RECOMMENDATIONS!
Comments contained in the body of this report are technical
opinions only. The material herein has been obtained
from sources believed to be reliable and accurate, however,
its accuracy and completeness cannot be guaranteed.
This site is not an investment advisor, hence it does
not endorse or recommend any securities or other investments.
Any recommendation contained in this report may not
be suitable for all investors and it is not to be deemed
an offer or solicitation on our part with respect to
the purchase or sale of any securities. All trademarks,
service marks and trade names appearing in this report
are the property of their respective owners, and are
likewise used for identification purposes only.
This report is a service available
only to active Paid Premium Members.
You may opt-out of receiving report notifications
at any time. Questions or comments may be submitted
by writing to Premium Membership Services 665 S.E. 10 Street, Suite 201 Deerfield Beach, FL 33441-5634 or by calling 1-800-965-8307
or 954-785-1121.
|
|
|

