You are not logged in.
This means you
CAN ONLY VIEW reports that were published prior to Monday, April 14, 2025.
You
MUST UPGRADE YOUR MEMBERSHIP if you want to see any current reports.
AFTER MARKET UPDATE - FRIDAY, MAY 25TH, 2012
Previous After Market Report Next After Market Report >>>
|
|
|
|
DOW |
-74.92 |
12,454.83 |
-0.60% |
|
Volume |
595,636,020 |
-25% |
|
Volume |
1,250,352,150 |
-26% |
|
NASDAQ |
-1.85 |
2,837.53 |
-0.07% |
|
Advancers |
1,555 |
50% |
|
Advancers |
1,240 |
48% |
|
S&P 500 |
-2.86 |
1,317.82 |
-0.22% |
|
Decliners |
1,441 |
46% |
|
Decliners |
1,232 |
47% |
|
Russell 2000 |
-0.16 |
766.41 |
-0.02% |
|
52 Wk Highs |
30 |
|
|
52 Wk Highs |
23 |
|
|
S&P 600 |
+0.40 |
430.95 |
+0.09% |
|
52 Wk Lows |
28 |
|
|
52 Wk Lows |
41 |
|
|
 |
Major Indices Snap 3-Week Losing Streak
Kenneth J. Gruneisen - Passed the CAN SLIM® Master's Exam
Despite Friday's decline, the major averages snapped a three week losing streak. For the week, the Dow Jones Industrial Average gained +0.7%, and the S&P 500 Index rose +1.7%, and the Nasdaq Composite Index advanced +2.1%. On Friday's session the indices finished with small losses after "Day 5", not yet delivering the robust confirming gains disciplined fact-based investors anxiously await. Volume totals were reported much lighter on the Nasdaq exchange and on the NYSE versus the prior session's totals as traders headed out early for Memorial Day weekend. Breadth was slightly positive as advancers narrowly led decliners on the NYSE and on the Nasdaq exchange. New 52-week highs barely outnumbered new 52-week lows on the NYSE, but new lows still held the lead on the Nasdaq exchange. There were 11 high-ranked companies from the CANSLIM.net Leaders List that made new 52-week highs and appeared on the CANSLIM.net BreakOuts Page, down from the prior session total of 14 stocks. Investors watching for a follow-through day in the days and weeks ahead should be aware that an expansion in the number of stocks hitting new 52-week highs is an important component to any new confirmed rally. There were gains for 5 of the 20 high-ranked companies currently included on the Featured Stocks Page.
The major averages were little changed as concerns over Europe's debt crisis were offset by improvement in U.S. consumer sentiment. Stocks dipped lower at the open after a report that regions in Spain were having trouble with finances. The market recovered after the final reading of the April University of Michigan index of consumer sentiment unexpectedly rose to 79.3, its highest level since 2007. Treasuries rallied with the 10-year note up 11/32 to yield 1.74%.
Economically sensitive stocks declined with Chevron Corp (CVX -1.2%) falling, and industrials and financials were among the worst performing groups with The Boeing Co (BA -1.95%) and JP Morgan Chase & Co (JPM -1.38%) ending lower. Over in tech, Facebook Inc (FB -3.39%) resumed its decline. Shares of the social networking website extended its loss to over -16% since its shares were priced at $38 on May 17.
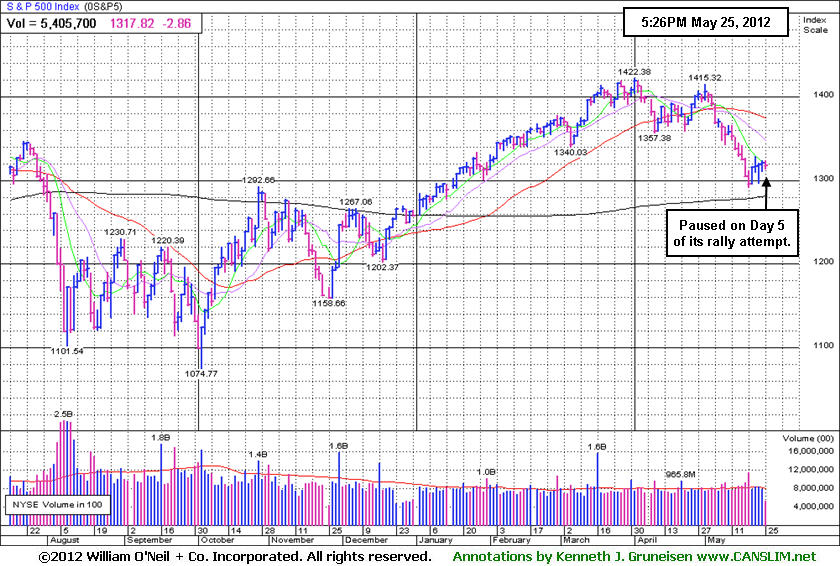
Friday marked "Day 5" of a new rally effort that remains intact for the Nasdaq Composite Index provided that its Day 1 low (2,774.76) is not undercut. Meanwhile, the Dow Industrials marked "Day 2" of a new rally attempt for the blue chip index. The major averages (M criteria) are technically still considered to be in a "correction" and stocks remain vulnerable to much greater downside. Ideally, a follow-through day (FTD) between Day 4-7 of additional confirming gains of +1.4% or greater by either the Nasdaq Composite Index or the S&P 500 Index, backed by higher volume, and coupled with an expansion in the number of stocks hitting new highs, would "confirm" a new rally.
PICTURED: The S&P 500 Index paused on Day 5 of its rally attempt. The benchmark index held its ground after dipping at Wednesday's intra-day low to within 1 point of its 5/21/12 low (1,295.73). Historical studies suggest that the most constructive market rallies produced a solid follow-through day (FTD) between Days 4-7 of a new rally effort. The window is open for a new confirmed rally to present itself, and such technical proof may give fact-based investors the clearance to begin with new buying efforts only in sound candidates. Meanwhile, investors should keep up a watchlist of worthy buy candidates while remaining protective of capital.
|
 Kenneth J. Gruneisen started out as a licensed stockbroker in August 1987, a couple of months prior to the historic stock market crash that took the Dow Jones Industrial Average down -22.6% in a single day. He has published daily fact-based fundamental and technical analysis on high-ranked stocks online for two decades. Through FACTBASEDINVESTING.COM, Kenneth provides educational articles, news, market commentary, and other information regarding proven investment systems that work in good times and bad.
Comments contained in the body of this report are technical opinions only and are not necessarily those of Gruneisen Growth Corp. The material herein has been obtained from sources believed to be reliable and accurate, however, its accuracy and completeness cannot be guaranteed. Our firm, employees, and customers may effect transactions, including transactions contrary to any recommendation herein, or have positions in the securities mentioned herein or options with respect thereto. Any recommendation contained in this report may not be suitable for all investors and it is not to be deemed an offer or solicitation on our part with respect to the purchase or sale of any securities. |
|
 |
Healthcare and Tech Groups Posted Gains
Kenneth J. Gruneisen - Passed the CAN SLIM® Master's Exam
Financial shares failed to show strength on Friday as the Bank Index ($BKX -0.25%) and Broker/Dealer Index ($XBD -0.10%) sputtered to finish with small losses. The Retail Index ($RLX -0.19%) also was a negative influence on the major averages and the Internet Index ($IIX -0.12%) edged lower, however the tech sector saw modest gains from the Networking Index ($NWX +0.69%), Biotechnology Index ($BTK +0.84%), and the Semiconductor Index ($SOX +1.37%). Healthcare Index ($HMO +1.31%) had a positive session and commodity-linked groups edged higher as the Oil Services Index ($OSX +0.19%) and Gold & Silver Index ($XAU +0.49%) posted small gains.
Charts courtesy www.stockcharts.com
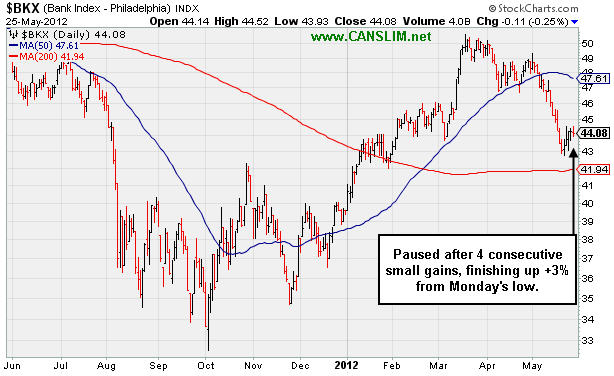
PICTURED: The Bank Index ($BKX -0.25%) paused after 4 consecutive small gains, finishing up +3% from Monday's low.
| Oil Services |
$OSX |
208.23 |
+0.40 |
+0.19% |
-3.72% |
| Healthcare |
$HMO |
2,325.08 |
+29.96 |
+1.31% |
+1.91% |
| Integrated Oil |
$XOI |
1,119.58 |
-2.82 |
-0.25% |
-8.91% |
| Semiconductor |
$SOX |
372.11 |
+5.04 |
+1.37% |
+2.10% |
| Networking |
$NWX |
205.89 |
+1.40 |
+0.69% |
-4.31% |
| Internet |
$IIX |
296.52 |
-0.36 |
-0.12% |
+5.25% |
| Broker/Dealer |
$XBD |
86.00 |
-0.08 |
-0.10% |
+3.28% |
| Retail |
$RLX |
607.13 |
-1.15 |
-0.19% |
+16.04% |
| Gold & Silver |
$XAU |
157.83 |
+0.77 |
+0.49% |
-12.63% |
| Bank |
$BKX |
44.08 |
-0.11 |
-0.25% |
+11.93% |
| Biotech |
$BTK |
1,467.97 |
+12.16 |
+0.84% |
+34.50% |
|
|
|
 |
Volume Drying Up While Consolidating Above Chart Support
Kenneth J. Gruneisen - Passed the CAN SLIM® Master's Exam
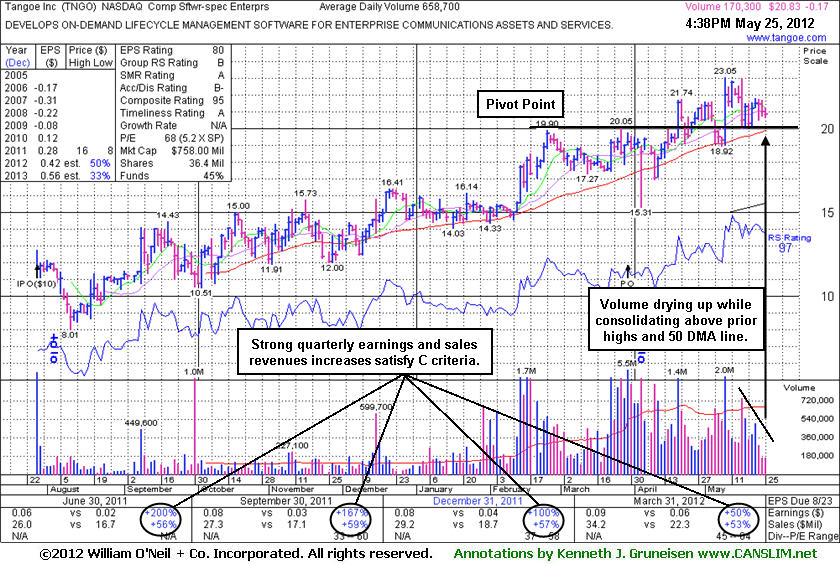
Tangoe Inc's (TNGO -$0.17 or -0.81% to $20.83) volume totals have been drying up while consolidating above prior highs in the $20 area and above important support at its 50-day moving average (DMA) line. Any damaging violations may trigger technical sell signals. It has consolidated below its "max buy" level, however investors' odds are more favorable when buying on strength rather than on pullbacks. Broader market conditions (M criteria) also argue against new buying efforts until a new confirmed rally with follow-through day.
TNGO was last shown in this FSU section on 4/03/12 with an annotated graph under the headline, "Perched Near High Following New Public Offering", as it was perched near its 52-week high. It completed a new Public Offering on 3/29/12, and such offerings can have a near-term effect of hindering price progress. Meanwhile, underwriters often help the company attract more institutional interest through the process. The number of top-rated funds owning its shares rose from 98 in Sep '11 to 164 in Mar '12, a reassuring sign concerning the I criteria. The company's management reportedly own 37% of its shares, keeping the directors motivated to look after and build shareholder value. There still are only 23 million shares (S criteria) in the publicly traded float following the latest offering, which can lead to more drastic price volatility in the event of institutional buying or selling. The bullish characteristics are an encouraging match with winning models of the fact-based system which went on to produce great gains. Typically the best winners advanced over a period of 6-18 months and offered multiple entry points within the investment system's guidelines.
|
|
|
Color Codes Explained :
Y - Better candidates highlighted by our
staff of experts.
G - Previously featured
in past reports as yellow but may no longer be buyable under the
guidelines.
***Last / Change / Volume data in this table is the closing quote data***
Symbol/Exchange
Company Name
Industry Group |
PRICE |
CHANGE
(%Change) |
Day High |
Volume
(% DAV)
(% 50 day avg vol) |
52 Wk Hi
% From Hi |
Featured
Date |
Price
Featured |
Pivot Featured |
|
Max Buy |
ACN
-
NYSE
Accenture Plc
DIVERSIFIED SERVICES - Business/Management Services
|
$57.44
|
-0.55
-0.95% |
$58.27
|
4,471,388
119.68% of 50 DAV
50 DAV is 3,736,200
|
$65.89
-12.82%
|
3/23/2012
|
$64.13
|
PP = $63.76
|
|
MB = $66.95
|
Most Recent Note - 5/22/2012 5:48:52 PM
G - Bounced from support at its longer-term 200 DMA line. Triggered technical sell signals with its recent losses undercutting prior highs in the $62-63 area and violating its 50 DMA line. See the latest FSU analysis for more details and a new annotated weekly graph.
>>> The latest Featured Stock Update with an annotated graph appeared on 5/22/2012. Click here.
View all notes |
Alert me of new notes |
CANSLIM.net Company Profile |
SEC |
Zacks Reports |
StockTalk |
News |
Chart |
Request a new note
C
A N
S L
I M


|
ALXN
-
NASDAQ
Alexion Pharmaceuticals
DRUGS - Drug Manufacturers - Other
|
$92.42
|
-0.68
-0.73% |
$93.36
|
2,832,049
149.63% of 50 DAV
50 DAV is 1,892,700
|
$95.01
-2.73%
|
5/1/2012
|
$91.73
|
PP = $95.11
|
|
MB = $99.87
|
 Most Recent Note - 5/25/2012 12:22:56 PM
Y - Consolidating above its 50 DMA line. Color code was changed to yellow while no new pivot point was cited. Volume-driven gains to new highs may trigger a technical buy signal. Faces little resistance in the $94-95 area. The M criteria remains an overriding concern until a follow-through day from at least one of the major averages confirms a new rally.
>>> The latest Featured Stock Update with an annotated graph appeared on 4/16/2012. Click here.
View all notes |
Alert me of new notes |
CANSLIM.net Company Profile |
SEC |
Zacks Reports |
StockTalk |
News |
Chart |
Request a new note
C
A N
S L
I M
|
ARBA
-
NASDAQ
Ariba Inc
INTERNET - Internet Software and Services
|
$45.22
|
+0.14
0.31% |
$45.29
|
2,666,169
149.10% of 50 DAV
50 DAV is 1,788,200
|
$45.48
-0.57%
|
4/27/2012
|
$38.53
|
PP = $37.24
|
|
MB = $39.10
|
Most Recent Note - 5/25/2012 12:23:52 PM
G - Holding its ground since tallying a considerable gain on 5/22/12 with heavy volume on news it will be bought by SAP in a $4.3 billion deal. The stock quickly got extended from its prior base after a quiet consolidation above chart support at its 50 DMA line and prior highs.
>>> The latest Featured Stock Update with an annotated graph appeared on 4/30/2012. Click here.
View all notes |
Alert me of new notes |
CANSLIM.net Company Profile |
SEC |
Zacks Reports |
StockTalk |
News |
Chart |
Request a new note
C
A N
S L
I M
|
CERN
-
NASDAQ
Cerner Corp
COMPUTER SOFTWARE and SERVICES - Healthcare Information Service
|
$79.01
|
-0.36
-0.45% |
$80.47
|
968,855
81.26% of 50 DAV
50 DAV is 1,192,300
|
$84.10
-6.05%
|
4/27/2012
|
$77.23
|
PP = $78.63
|
|
MB = $82.56
|
Most Recent Note - 5/21/2012 4:37:40 PM
Y - Color code is changed to yellow after above average volume behind today's gain was a sign of prompt support near its 50 DMA line. Its prior loss had negated its recent technical breakout. Market weakness (M criteria) is an overriding concern that argues against new buying efforts until a new confirmed rally with a follow-through day by at least one of the major averages.
>>> The latest Featured Stock Update with an annotated graph appeared on 5/1/2012. Click here.
View all notes |
Alert me of new notes |
CANSLIM.net Company Profile |
SEC |
Zacks Reports |
StockTalk |
News |
Chart |
Request a new note
C
A N
S L
I M
|
CMCSA
-
NASDAQ
Comcast Corp Cl A
MEDIA - CATV Systems
|
$28.85
|
-0.08
-0.28% |
$29.15
|
9,329,184
73.27% of 50 DAV
50 DAV is 12,732,000
|
$30.88
-6.56%
|
5/2/2012
|
$30.04
|
PP = $30.51
|
|
MB = $32.04
|
Most Recent Note - 5/21/2012 4:39:56 PM
G - Posted a gain today with lighter volume. Color code was changed to green after slumping under its 50 DMA line, and last week it also undercut the prior low ($28.54 on 4/10/12) triggering a more worrisome technical sell signal.
>>> The latest Featured Stock Update with an annotated graph appeared on 5/7/2012. Click here.
View all notes |
Alert me of new notes |
CANSLIM.net Company Profile |
SEC |
Zacks Reports |
StockTalk |
News |
Chart |
Request a new note
C
A N
S L
I M
|
Symbol/Exchange
Company Name
Industry Group |
PRICE |
CHANGE
(%Change) |
Day High |
Volume
(% DAV)
(% 50 day avg vol) |
52 Wk Hi
% From Hi |
Featured
Date |
Price
Featured |
Pivot Featured |
|
Max Buy |
COO
-
NYSE
Cooper Companies Inc
HEALTH SERVICES - Medical Instruments and Supplies
|
$85.53
|
-0.21
-0.24% |
$86.36
|
348,742
85.12% of 50 DAV
50 DAV is 409,700
|
$89.31
-4.23%
|
3/9/2012
|
$83.05
|
PP = $81.02
|
|
MB = $85.07
|
Most Recent Note - 5/21/2012 12:27:30 PM
G - Trading up today following a streak of 6 consecutive losses. Consolidating above prior highs in the $83-84 area and its 50 DMA line, important near-term support. A subsequent violation may trigger a worrisome sell signal.
>>> The latest Featured Stock Update with an annotated graph appeared on 5/18/2012. Click here.
View all notes |
Alert me of new notes |
CANSLIM.net Company Profile |
SEC |
Zacks Reports |
StockTalk |
News |
Chart |
Request a new note
C
A N
S L
I M
|
DG
-
NYSE
Dollar General Corp
RETAIL - Discount, Variety Stores
|
$47.58
|
-0.07
-0.15% |
$47.92
|
1,072,125
39.18% of 50 DAV
50 DAV is 2,736,300
|
$48.76
-2.42%
|
5/7/2012
|
$48.51
|
PP = $47.69
|
|
MB = $50.07
|
Most Recent Note - 5/22/2012 4:36:05 PM
G - Down today average volume, encountering resistance at its 50 DMA line. Recent violation of that important short-term average triggered a technical sell signal and its color code was changed to green. It has encountered recent distributional pressure while market conditions (M criteria) turned for the worse.
>>> The latest Featured Stock Update with an annotated graph appeared on 5/9/2012. Click here.
View all notes |
Alert me of new notes |
CANSLIM.net Company Profile |
SEC |
Zacks Reports |
StockTalk |
News |
Chart |
Request a new note
C
A N
S L
I M
|
EXPE
-
NASDAQ
Expedia Inc
INTERNET - Internet Information Providers
|
$44.89
|
-0.27
-0.60% |
$45.55
|
2,830,462
62.56% of 50 DAV
50 DAV is 4,524,200
|
$46.07
-2.56%
|
4/27/2012
|
$41.80
|
PP = $35.57
|
|
MB = $37.35
|
Most Recent Note - 5/23/2012 6:43:13 PM
G - Hit a new 52-week high today with 2 times average volume behind a considerable gain. Technically, it rallied from an advanced "3-weeks tight" base with no resistance remaining due to overhead supply, however no new pivot point has being cited. Until the market confirms a new rally with a solid follow through day from at least one of the major averages (M criteria) the fact-based investment system argues against new buying efforts in any stocks.
>>> The latest Featured Stock Update with an annotated graph appeared on 5/3/2012. Click here.
View all notes |
Alert me of new notes |
CANSLIM.net Company Profile |
SEC |
Zacks Reports |
StockTalk |
News |
Chart |
Request a new note
C
A N
S L
I M
|
GNC
-
NYSE
G N C Holdings Inc
RETAIL - Drug Stores
|
$39.55
|
-0.20
-0.50% |
$39.93
|
842,859
43.78% of 50 DAV
50 DAV is 1,925,200
|
$41.95
-5.72%
|
1/19/2012
|
$28.99
|
PP = $29.60
|
|
MB = $31.08
|
Most Recent Note - 5/21/2012 4:59:01 PM
G - Found support near prior highs and its 50 DMA line while consolidating. Reported earnings +82% on +23% sales revenues for the quarter ended March 31, 2012 versus the year ago period.
>>> The latest Featured Stock Update with an annotated graph appeared on 4/26/2012. Click here.
View all notes |
Alert me of new notes |
CANSLIM.net Company Profile |
SEC |
Zacks Reports |
StockTalk |
News |
Chart |
Request a new note
C
A N
S L
I M
|
MG
-
NYSE
Mistras Group Inc
DIVERSIFIED SERVICES - Bulding and Faci;ity Management Services
|
$22.99
|
-0.79
-3.32% |
$23.75
|
111,942
115.29% of 50 DAV
50 DAV is 97,100
|
$26.24
-12.39%
|
3/22/2012
|
$24.96
|
PP = $26.34
|
|
MB = $27.66
|
Most Recent Note - 5/25/2012 5:39:25 PM
G - Suffered a loss today with higher volume, finishing near the session lows while slumping toward recent lows and its 200 DMA line defining important near-term support in the $22.50 area.
>>> The latest Featured Stock Update with an annotated graph appeared on 4/2/2012. Click here.
View all notes |
Alert me of new notes |
CANSLIM.net Company Profile |
SEC |
Zacks Reports |
StockTalk |
News |
Chart |
Request a new note
C
A N
S L
I M
|
Symbol/Exchange
Company Name
Industry Group |
PRICE |
CHANGE
(%Change) |
Day High |
Volume
(% DAV)
(% 50 day avg vol) |
52 Wk Hi
% From Hi |
Featured
Date |
Price
Featured |
Pivot Featured |
|
Max Buy |
NTES
-
NASDAQ
Netease Inc Adr
INTERNET - Internet Information Providers
|
$57.26
|
-0.66
-1.14% |
$58.13
|
185,873
25.10% of 50 DAV
50 DAV is 740,500
|
$63.07
-9.21%
|
3/19/2012
|
$56.18
|
PP = $55.10
|
|
MB = $57.86
|
Most Recent Note - 5/24/2012 6:29:06 PM
G - Closed below its 50 DMA line today with a loss on light volume. Recent lows near the $55 area define important chart support to watch where a violation may trigger a worrisome technical sell signal. See the latest FSU analysis for more details and a new annotated graph.
>>> The latest Featured Stock Update with an annotated graph appeared on 5/24/2012. Click here.
View all notes |
Alert me of new notes |
CANSLIM.net Company Profile |
SEC |
Zacks Reports |
StockTalk |
News |
Chart |
Request a new note
C
A N
S L
I M
|
SWI
-
NYSE
Solarwinds Inc
COMPUTER SOFTWARE and SERVICES - Application Software
|
$47.68
|
-0.04
-0.08% |
$47.94
|
627,267
55.36% of 50 DAV
50 DAV is 1,133,100
|
$48.42
-1.53%
|
4/26/2012
|
$45.15
|
PP = $42.32
|
|
MB = $44.44
|
Most Recent Note - 5/23/2012 4:26:37 PM
G - Rallied to a new all-time high today with a considerable gain on below average volume. It did not form a sound new base of sufficient length, and the market (M criteria) is currently in need of a follow-through day to confirm a new rally.
>>> The latest Featured Stock Update with an annotated graph appeared on 5/21/2012. Click here.
View all notes |
Alert me of new notes |
CANSLIM.net Company Profile |
SEC |
Zacks Reports |
StockTalk |
News |
Chart |
Request a new note
C
A N
S L
I M
|
SXCI
-
NASDAQ
S X C Health Solutions
COMPUTER SOFTWARE and SERVICES - Healthcare Information Service
|
$91.34
|
+1.51
1.68% |
$91.39
|
624,035
56.49% of 50 DAV
50 DAV is 1,104,700
|
$100.50
-9.11%
|
2/23/2012
|
$68.24
|
PP = $66.05
|
|
MB = $69.35
|
Most Recent Note - 5/22/2012 4:32:09 PM
G - Reversed early gains today and closed near the session low with a small loss on higher (near average) volume. Still holding its ground in a tight range after pricing a new Public Offering last week. Consolidating in a tight range since it posted huge volume-driven gains on 4/18 and 4/19 while rallying on M&A news.
>>> The latest Featured Stock Update with an annotated graph appeared on 5/17/2012. Click here.
View all notes |
Alert me of new notes |
CANSLIM.net Company Profile |
SEC |
Zacks Reports |
StockTalk |
News |
Chart |
Request a new note
C
A N
S L
I M
|
TDG
-
NYSE
Transdigm Group Inc
AEROSPACE/DEFENSE - Aerospace/Defense Products and; Services
|
$124.23
|
-0.72
-0.58% |
$125.79
|
290,040
59.59% of 50 DAV
50 DAV is 486,700
|
$132.69
-6.38%
|
2/29/2012
|
$120.10
|
PP = $118.93
|
|
MB = $124.88
|
Most Recent Note - 5/23/2012 6:41:55 PM
G - Held its ground today after 2 solid gains backed by above average volume, a sign of prompt support at its 50 DMA line and near prior highs. Poor market conditions (M criteria) argue against making any new buying efforts until a new confirmed rally by at least one of the major averages with a solid follow-through day. See the latest FSU analysis for more details and a new annotated graph.
>>> The latest Featured Stock Update with an annotated graph appeared on 5/23/2012. Click here.
View all notes |
Alert me of new notes |
CANSLIM.net Company Profile |
SEC |
Zacks Reports |
StockTalk |
News |
Chart |
Request a new note
C
A N
S L
I M
|
TNGO
-
NASDAQ
Tangoe Inc
COMPUTER SOFTWARE and SERVICES - Technical and System Software
|
$20.83
|
-0.17
-0.81% |
$21.26
|
172,454
26.18% of 50 DAV
50 DAV is 658,700
|
$23.05
-9.63%
|
3/27/2012
|
$19.35
|
PP = $20.00
|
|
MB = $21.00
|
Most Recent Note - 5/25/2012 4:53:08 PM
G - Volume totals have been drying up while consolidating above prior highs in the $20 area and above important support at its 50 DMA line. It has consolidated below its "max buy" level, however investors' odds are more favorable when buying on strength rather than on pullbacks. Broader market conditions (M criteria) also argue against new buying efforts until a new confirmed rally with follow-through day. See the latest FSU analysis for more details and a new annotated graph.
>>> The latest Featured Stock Update with an annotated graph appeared on 5/25/2012. Click here.
View all notes |
Alert me of new notes |
CANSLIM.net Company Profile |
SEC |
Zacks Reports |
StockTalk |
News |
Chart |
Request a new note
C
A N
S L
I M
|
Symbol/Exchange
Company Name
Industry Group |
PRICE |
CHANGE
(%Change) |
Day High |
Volume
(% DAV)
(% 50 day avg vol) |
52 Wk Hi
% From Hi |
Featured
Date |
Price
Featured |
Pivot Featured |
|
Max Buy |
TSCO
-
NASDAQ
Tractor Supply Co
SPECIALTY RETAIL - Specialty Retail, Other
|
$99.62
|
+0.32
0.32% |
$100.41
|
615,102
67.80% of 50 DAV
50 DAV is 907,200
|
$101.20
-1.56%
|
5/1/2012
|
$98.38
|
PP = $101.30
|
|
MB = $106.37
|
Most Recent Note - 5/22/2012 4:29:33 PM
G - Promptly rebounded above its 50 DMA line today with a gain backed near average volume. It did not trigger a new (or add-on) technical buy signal in recent weeks. Market conditions (M criteria) argue against new buying efforts until a new confirmed rally with a solid follow-through day by at least one of the major averages.
>>> The latest Featured Stock Update with an annotated graph appeared on 4/17/2012. Click here.
View all notes |
Alert me of new notes |
CANSLIM.net Company Profile |
SEC |
Zacks Reports |
StockTalk |
News |
Chart |
Request a new note
C
A N
S L
I M
|
UA
-
NYSE
Under Armour Inc Cl A
CONSUMER NON-DURABLES - Textile - Apparel Clothing
|
$98.19
|
+0.90
0.93% |
$98.49
|
591,391
64.02% of 50 DAV
50 DAV is 923,700
|
$102.86
-4.54%
|
2/15/2012
|
$85.77
|
PP = $84.86
|
|
MB = $89.10
|
Most Recent Note - 5/21/2012 4:48:25 PM
G - Posted a gain and finished near the session high today but volume was lighter than average. Concerns were recently raised by weaker fundamentals, its first quarterly earnings increase below the +25% minimum guideline in more than 2 years.
>>> The latest Featured Stock Update with an annotated graph appeared on 4/4/2012. Click here.
View all notes |
Alert me of new notes |
CANSLIM.net Company Profile |
SEC |
Zacks Reports |
StockTalk |
News |
Chart |
Request a new note
C
A N
S L
I M
|
V
-
NYSE
Visa Inc Cl A
DIVERSIFIED SERVICES - Business/Management Services
|
$119.37
|
-0.40
-0.33% |
$120.40
|
2,944,986
81.51% of 50 DAV
50 DAV is 3,613,100
|
$125.35
-4.77%
|
3/12/2012
|
$116.53
|
PP = $119.46
|
|
MB = $125.43
|
Most Recent Note - 5/21/2012 4:51:13 PM
G - Up today with lighter volume, rebounding toward it 50 DMA line which has acted as a resistance level after the technical violation on 5/03/12. The longer it lingers below its 50 DMA line the worse its outlook becomes.
>>> The latest Featured Stock Update with an annotated graph appeared on 5/16/2012. Click here.
View all notes |
Alert me of new notes |
CANSLIM.net Company Profile |
SEC |
Zacks Reports |
StockTalk |
News |
Chart |
Request a new note
C
A N
S L
I M
|
VSI
-
NYSE
Vitamin Shoppe Inc
SPECIALTY RETAIL - Specialty Retail, Other
|
$50.40
|
-0.73
-1.43% |
$51.24
|
272,782
57.78% of 50 DAV
50 DAV is 472,100
|
$55.29
-8.84%
|
4/25/2012
|
$47.77
|
PP = $48.46
|
|
MB = $50.88
|
Most Recent Note - 5/21/2012 4:52:57 PM
G - Gain today was backed by lighter than average volume as it found some support near its old highs and halted a streak of 5 consecutive losses since a negative reversal at its 52-week high. It has slumped below its "max buy" level, however broader market weakness (M criteria) is an overriding concern which argues against any new buying efforts until a new rally is confirmed with a solid follow-through day by at least one of the major averages.
>>> The latest Featured Stock Update with an annotated graph appeared on 4/25/2012. Click here.
View all notes |
Alert me of new notes |
CANSLIM.net Company Profile |
SEC |
Zacks Reports |
StockTalk |
News |
Chart |
Request a new note
C
A N
S L
I M
|
WFM
-
NASDAQ
Whole Foods Market Inc
RETAIL - Grocery Stores
|
$87.27
|
+0.85
0.98% |
$87.67
|
1,076,314
66.07% of 50 DAV
50 DAV is 1,629,100
|
$91.50
-4.62%
|
5/3/2012
|
$90.28
|
PP = $86.45
|
|
MB = $90.77
|
Most Recent Note - 5/21/2012 4:55:02 PM
G - Gain today with slightly higher above average volume was a sign of prompt support as it rebounded above its 50 DMA line following a streak of 5 consecutive losses which completely negated the latest breakout. It stalled following its considerable "breakaway gap" on 5/03/12, meanwhile the broader market (M criteria) fell into the latest correction.
>>> The latest Featured Stock Update with an annotated graph appeared on 5/11/2012. Click here.
View all notes |
Alert me of new notes |
CANSLIM.net Company Profile |
SEC |
Zacks Reports |
StockTalk |
News |
Chart |
Request a new note
C
A N
S L
I M
|
Symbol/Exchange
Company Name
Industry Group |
PRICE |
CHANGE
(%Change) |
Day High |
Volume
(% DAV)
(% 50 day avg vol) |
52 Wk Hi
% From Hi |
Featured
Date |
Price
Featured |
Pivot Featured |
|
Max Buy |
|
|
|
THESE ARE NOT BUY RECOMMENDATIONS!
Comments contained in the body of this report are technical
opinions only. The material herein has been obtained
from sources believed to be reliable and accurate, however,
its accuracy and completeness cannot be guaranteed.
This site is not an investment advisor, hence it does
not endorse or recommend any securities or other investments.
Any recommendation contained in this report may not
be suitable for all investors and it is not to be deemed
an offer or solicitation on our part with respect to
the purchase or sale of any securities. All trademarks,
service marks and trade names appearing in this report
are the property of their respective owners, and are
likewise used for identification purposes only.
This report is a service available
only to active Paid Premium Members.
You may opt-out of receiving report notifications
at any time. Questions or comments may be submitted
by writing to Premium Membership Services 665 S.E. 10 Street, Suite 201 Deerfield Beach, FL 33441-5634 or by calling 1-800-965-8307
or 954-785-1121.
|
|
|

