You are not logged in.
This means you
CAN ONLY VIEW reports that were published prior to Monday, April 14, 2025.
You
MUST UPGRADE YOUR MEMBERSHIP if you want to see any current reports.
AFTER MARKET UPDATE - WEDNESDAY, MAY 25TH, 2011
Previous After Market Report Next After Market Report >>>
|
|
|
|
DOW |
+38.45 |
12,394.66 |
+0.31% |
|
Volume |
966,140,070 |
+11% |
|
Volume |
1,836,698,080 |
+1% |
|
NASDAQ |
+15.22 |
2,761.38 |
+0.55% |
|
Advancers |
1,974 |
63% |
|
Advancers |
1,724 |
64% |
|
S&P 500 |
+4.21 |
1,320.49 |
+0.32% |
|
Decliners |
1,043 |
33% |
|
Decliners |
885 |
33% |
|
Russell 2000 |
+10.54 |
820.87 |
+1.30% |
|
52 Wk Highs |
45 |
|
|
52 Wk Highs |
44 |
|
|
S&P 600 |
+5.14 |
438.73 |
+1.19% |
|
52 Wk Lows |
34 |
|
|
52 Wk Lows |
68 |
|
|
Today we have a question from a member concerning the lack of actionable ideas currently listed on the Featured Stocks page. Many members have told us they enjoy the occasional "Ken's Mailbag" included below the FSU table near the bottom of the evening report. These segments share a recent Q&A between CANSLIM.net's founder, Kenneth J. Gruneisen, and a member who has written in with a question concerning our services or a stock they are curious about. Please feel free to submit your questions or any feedback you have for us via the inquiry form - click here.
|
 |
Volume Higher With Better Leadership as Major Averages Post Gains
Kenneth J. Gruneisen - Passed the CAN SLIM® Master's Exam
Gains in commodities helped the market averages overcome negative economic news. Volume totals were reported higher than the prior session total on the NYSE and on the Nasdaq exchange. Advancers led decliners by about a 2-to-1 ratio on the NYSE and on the Nasdaq exchange. New 52-week highs outnumbered new 52-week lows on the NYSE, but on the Nasdaq exchange new lows again outnumbered new highs. Leadership improved as there were 17 high-ranked companies from the CANSLIM.net Leaders List that made new 52-week highs and appeared on the CANSLIM.net BreakOuts Page, up from the total of 8 on the prior session. On the Featured Stocks Page there were no stocks that closed the session with losses while all 15 high-ranked leaders currently included posted gains.
European debt concerns eased somewhat after Fitch said German banks have "manageable risk" regarding Greek debt. Mining and energy stocks were among the session's best performing sectors. Oil recovered from earlier losses as U.S. government data showed that refineries operated at a higher-than-forecast rate. Economic data was a letdown as April durable goods orders dropped 3.6%, the biggest decline in six months, and a greater drop than expected.
The Securities & Exchange Commission adopted new rules to establish a whistleblower program. Meanwhile, American International Group Inc (AIG -4.01%) fell after the government and the insurer raised $8.7 billion in a share sale. That still leaves the government with a 77% stake in the company.
After earnings missed expectations, Polo Ralph Lauren Corp (RL -11.35%) gapped down and violated its 50-day moving average (DMA) line. Costco Wholesale Corp (COST -1.27%) also gapped down after an earnings miss. Homebuilding stocks gained after Toll Brothers Inc (TOL +1.78%) reported home deliveries and new contracts picked up in the latest quarter. California Pizza Kitchen Inc (CPKI +10.53%) gapped up after the restaurant chain agreed to a $470 million offer from buyout firm Golden Gate Capital.
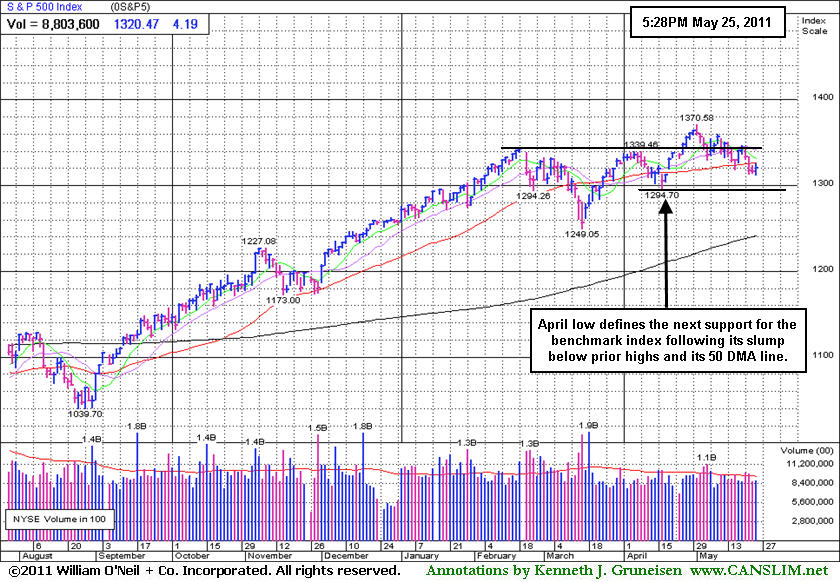
Loses early this week caused the Nasdaq Composite Index, S&P 500 Index, and Dow Jones Industrial Average to violate their respective 50--day moving average lines. The weak technical action in the major indices has raised greater concerns. Coupled with waning leadership (shrinking list of new 52-week highs), the recent slump suggests that market (M criteria) conditions have deteriorated from an "uptrend under pressure" to what may be a longer and more substantial correction. Until a new rally attempt and a solid follow-through day as confirmation, disciplined investors know it is probably best to avoid new buying efforts and take a more defensive stance. Eliminate weakening issues on a case-by-case basis, being sure to protect your hard-earned capital.
PICTURED: The S&P 500 Index's April low defines the next support after slumping below prior highs and its 50 DMA line. Its Wednesday gain halted a 3 session losing streak and marked Day 1 of a new rally attempt.
|
 Kenneth J. Gruneisen started out as a licensed stockbroker in August 1987, a couple of months prior to the historic stock market crash that took the Dow Jones Industrial Average down -22.6% in a single day. He has published daily fact-based fundamental and technical analysis on high-ranked stocks online for two decades. Through FACTBASEDINVESTING.COM, Kenneth provides educational articles, news, market commentary, and other information regarding proven investment systems that work in good times and bad.
Comments contained in the body of this report are technical opinions only and are not necessarily those of Gruneisen Growth Corp. The material herein has been obtained from sources believed to be reliable and accurate, however, its accuracy and completeness cannot be guaranteed. Our firm, employees, and customers may effect transactions, including transactions contrary to any recommendation herein, or have positions in the securities mentioned herein or options with respect thereto. Any recommendation contained in this report may not be suitable for all investors and it is not to be deemed an offer or solicitation on our part with respect to the purchase or sale of any securities. |
|
 |
Commodity-Linked Groups Post Standout Gains
Kenneth J. Gruneisen - Passed the CAN SLIM® Master's Exam
Commodity-linked groups were standout gainers again as the Gold & Silver Index ($XAU +1.19%), Oil Services Index ($OSX +2.82%), and Integrated Oil Index ($XOI +0.92%) were among Wednesday's leading groups. The Retail Index ($RLX +0.17%) and Broker/Dealer Index ($XBD +0.48%) inched higher, but the Bank Index ($BKX -0.08%) failed to go along with the session's broad-based gains. The Healthcare Index ($HMO +0.01%) also ended flat. Meanwhile, the tech sector had a positive bias as the Internet Index ($IIX +0.50%), Biotechnology Index ($BTK +0.85%), Semiconductor Index ($SOX +0.95%), and Networking Index ($NWX +1.14%) ended unanimously higher.
Charts courtesy www.stockcharts.com
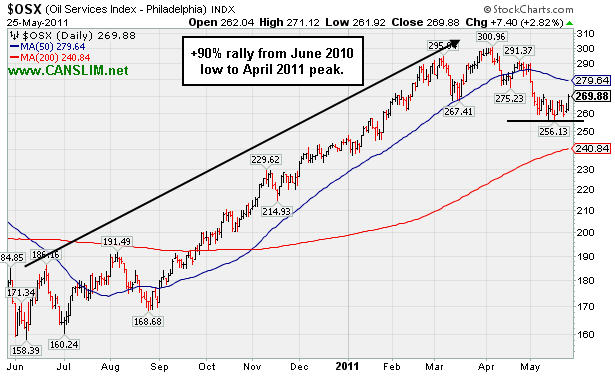
PICTURED: The Oil Services Index ($OSX +2.82%) rallied +90% from its June 2010 low to its April 2011 peak and is now consolidating below its 50 DMA line.
| Oil Services |
$OSX |
269.88 |
+7.40 |
+2.82% |
+10.10% |
| Healthcare |
$HMO |
2,325.64 |
+0.28 |
+0.01% |
+37.45% |
| Integrated Oil |
$XOI |
1,298.19 |
+11.77 |
+0.92% |
+7.01% |
| Semiconductor |
$SOX |
424.21 |
+4.00 |
+0.95% |
+3.01% |
| Networking |
$NWX |
312.95 |
+3.53 |
+1.14% |
+11.55% |
| Internet |
$IIX |
312.86 |
+1.57 |
+0.50% |
+1.67% |
| Broker/Dealer |
$XBD |
112.96 |
+0.54 |
+0.48% |
-7.04% |
| Retail |
$RLX |
526.58 |
+0.91 |
+0.17% |
+3.58% |
| Gold & Silver |
$XAU |
205.04 |
+2.41 |
+1.19% |
-9.51% |
| Bank |
$BKX |
48.88 |
-0.04 |
-0.08% |
-6.38% |
| Biotech |
$BTK |
1,454.65 |
+12.20 |
+0.85% |
+12.10% |
|
|
|
 |
Twice Average Volume Behind Technical Breakout
Kenneth J. Gruneisen - Passed the CAN SLIM® Master's Exam
As noted previously, the M criteria is an overriding concern arguing against new buying efforts until a follow-through day (FTD) from at least one of the major averages confirms a new rally. Disciplined investors may watch for an opportunity to accumulate shares in worthy buy candidates with the reassurance of a FTD or solid confirming gain from at least one of the major averages with heavier volume, and that gain should be coupled with an expansion in leadership (increase in the number of stocks hitting new 52-week highs).
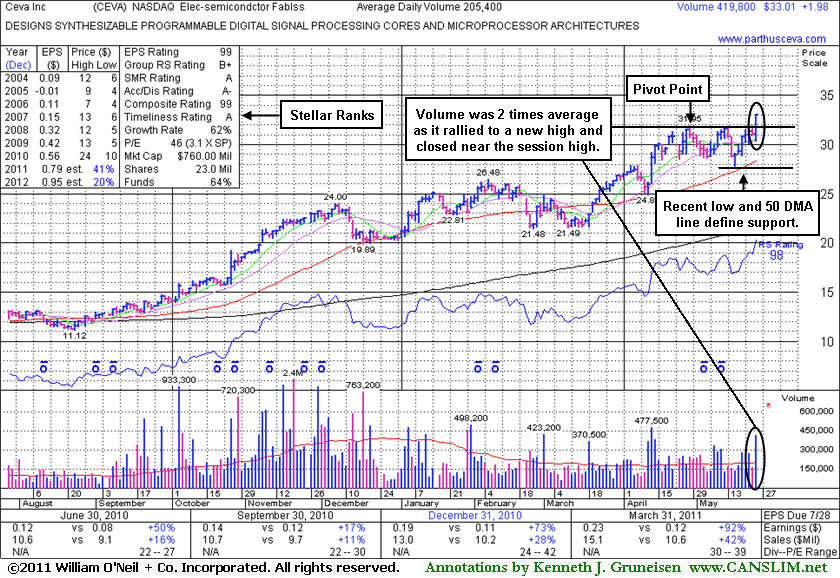
Ceva Inc (CEVA +$1.98 or +6.38% to $33.01) hit a new 52-week high today with above average volume triggering a technical buy signal while rising clear of all resistance due to overhead supply. Its strong +92% earnings increase on +42% sales revenues for the March 31, 2011 ended quarter shows more impressive acceleration. Its color code was changed to yellow as it was featured in the mid-day report today (5/25/11 mid-day report - read here) with a pivot point of $32.05 based on a short "square box" type base pattern. It found support above its 50-day moving average (DMA) line when recently testing support near prior chart highs. It has a good annual earnings (A criteria) history. However, Return On Equity is reported at 8%, below the 17% guideline. The number of top-rated funds owning its shares rose from 203 in Sep '10 to 248 in Mar '11, a very reassuring sign concerning the investment system's I criteria. Its current Up/Down Volume Ratio of 2.5 is also an unbiased indication of recent accumulation.
|
|
|
Color Codes Explained :
Y - Better candidates highlighted by our
staff of experts.
G - Previously featured
in past reports as yellow but may no longer be buyable under the
guidelines.
***Last / Change / Volume data in this table is the closing quote data***
Symbol/Exchange
Company Name
Industry Group |
PRICE |
CHANGE
(%Change) |
Day High |
Volume
(% DAV)
(% 50 day avg vol) |
52 Wk Hi
% From Hi |
Featured
Date |
Price
Featured |
Pivot Featured |
|
Max Buy |
CEVA
-
NASDAQ
Ceva Inc
ELECTRONICS - Semiconductor - Specialized
|
$33.01
|
+1.98
6.38% |
$33.10
|
421,123
205.03% of 50 DAV
50 DAV is 205,400
|
$31.95
3.32%
|
5/25/2011
|
$32.98
|
PP = $32.05
|
|
MB = $33.65
|
 Most Recent Note - 5/25/2011 12:15:15 PM
Y - Hit a new 52-week high today with above average volume while rising clear of all resistance due to overhead supply. Its strong +92% earnings increase on +42% sales revenues for the March 31, 2011 ended quarter shows more impressive acceleration. Color code is changed to yellow with a pivot point of $32.05 based on a short "square box" type base pattern. Found support above its 50 DMA line when recently testing support near prior chart highs. It has a good annual earnings (A criteria) history. The M criteria is an overriding concern arguing against new buying efforts until a follow-through day from at least one of the major averages confirms a new rally.
>>> The latest Featured Stock Update with an annotated graph appeared on 5/25/2011. Click here.
View all notes |
Alert me of new notes |
CANSLIM.net Company Profile |
SEC |
Zacks Reports |
StockTalk |
News |
Chart |
Request a new note
C
A N
S L
I M


|
CMG
-
NYSE
Chipotle Mexican Grill
LEISURE - Restaurants
|
$284.11
|
+3.54
1.26% |
$285.98
|
574,808
51.68% of 50 DAV
50 DAV is 1,112,300
|
$289.35
-1.81%
|
4/1/2011
|
$274.00
|
PP = $275.10
|
|
MB = $288.86
|
Most Recent Note - 5/20/2011 4:35:13 PM
G - Hovering near its all-time high after a 5-week cup shaped base with volume totals cooling in recent weeks while consolidating above its 50 DMA line. It faces virtually no resistance due to overhead supply.
>>> The latest Featured Stock Update with an annotated graph appeared on 5/17/2011. Click here.
View all notes |
Alert me of new notes |
CANSLIM.net Company Profile |
SEC |
Zacks Reports |
StockTalk |
News |
Chart |
Request a new note
C
A N
S L
I M
|
EZPW
-
NASDAQ
Ezcorp Inc Cl A
SPECIALTY RETAIL - Specialty Retail, Other
|
$30.59
|
+0.66
2.21% |
$30.79
|
260,720
75.20% of 50 DAV
50 DAV is 346,700
|
$33.08
-7.53%
|
2/18/2011
|
$27.94
|
PP = $30.04
|
|
MB = $31.54
|
Most Recent Note - 5/23/2011 4:16:24 PM
G - Small loss on light volume after gapping down today. Continuing its healthy consolidation above its 50 DMA line. It has not formed a sound new base pattern. Recent lows define important nearby chart support to watch where technical violations would raise more serious concerns.
>>> The latest Featured Stock Update with an annotated graph appeared on 5/10/2011. Click here.
View all notes |
Alert me of new notes |
CANSLIM.net Company Profile |
SEC |
Zacks Reports |
StockTalk |
News |
Chart |
Request a new note
C
A N
S L
I M
|
FOSL
-
NASDAQ
Fossil Inc
CONSUMER DURABLES - Recreational Goods, Other
|
$102.26
|
+0.73
0.72% |
$102.43
|
357,619
43.30% of 50 DAV
50 DAV is 825,900
|
$107.54
-4.91%
|
2/1/2011
|
$73.30
|
PP = $74.44
|
|
MB = $78.16
|
Most Recent Note - 5/23/2011 4:17:52 PM
G - Down on light volume today. Volume totals have been cooling while consolidating since its considerable gap up gain on 5/10/11 for a new all-time high. It is extended from any sound base. Prior highs near $96 define initial support to watch above its 50 DMA line.
>>> The latest Featured Stock Update with an annotated graph appeared on 5/2/2011. Click here.
View all notes |
Alert me of new notes |
CANSLIM.net Company Profile |
SEC |
Zacks Reports |
StockTalk |
News |
Chart |
Request a new note
C
A N
S L
I M
|
HMSY
-
NASDAQ
H M S Holdings Corp
COMPUTER SOFTWARE and SERVICES - Healthcare Information Service
|
$77.33
|
+0.51
0.66% |
$77.81
|
108,581
65.37% of 50 DAV
50 DAV is 166,100
|
$84.82
-8.83%
|
11/19/2010
|
$61.89
|
PP = $63.01
|
|
MB = $66.16
|
Most Recent Note - 5/23/2011 4:20:53 PM
G - Small gap down today on near average volume. Its has lingered for the past 3 weeks below its 50 DMA line which may now act as resistance. A rally above it would improve its technical stance. Deterioration below its recent chart low ($73.27) would raise more serious concerns and trigger an additional sell signal.
>>> The latest Featured Stock Update with an annotated graph appeared on 5/23/2011. Click here.
View all notes |
Alert me of new notes |
CANSLIM.net Company Profile |
SEC |
Zacks Reports |
StockTalk |
News |
Chart |
Request a new note
C
A N
S L
I M
|
Symbol/Exchange
Company Name
Industry Group |
PRICE |
CHANGE
(%Change) |
Day High |
Volume
(% DAV)
(% 50 day avg vol) |
52 Wk Hi
% From Hi |
Featured
Date |
Price
Featured |
Pivot Featured |
|
Max Buy |
HS
-
NYSE
Healthspring Inc
HEALTH SERVICES - Health Care Plans
|
$41.77
|
+0.66
1.61% |
$41.80
|
667,767
68.65% of 50 DAV
50 DAV is 972,700
|
$45.11
-7.40%
|
3/22/2011
|
$38.29
|
PP = $38.85
|
|
MB = $40.79
|
Most Recent Note - 5/24/2011 4:47:03 PM
G - Down on light volume today for a third consecutive loss, slumping toward prior highs closely coinciding with its 50 DMA line which define important chart support to watch. Violations would trigger technical sell signals.
>>> The latest Featured Stock Update with an annotated graph appeared on 5/20/2011. Click here.
View all notes |
Alert me of new notes |
CANSLIM.net Company Profile |
SEC |
Zacks Reports |
StockTalk |
News |
Chart |
Request a new note
C
A N
S L
I M
|
INFA
-
NASDAQ
Informatica Corp
COMPUTER SOFTWARE and SERVICES - Business Software and Services
|
$54.76
|
+0.81
1.50% |
$54.97
|
1,038,856
96.97% of 50 DAV
50 DAV is 1,071,300
|
$56.49
-3.06%
|
3/24/2011
|
$50.04
|
PP = $49.86
|
|
MB = $52.35
|
Most Recent Note - 5/23/2011 4:06:14 PM
G - Small gap down today for a loss with below average volume. It has not formed a sound new base pattern. Prior highs in the $49 area and its 50 DMA line, important chart support to watch. Subsequent violations would trigger technical sell signals.
>>> The latest Featured Stock Update with an annotated graph appeared on 5/24/2011. Click here.
View all notes |
Alert me of new notes |
CANSLIM.net Company Profile |
SEC |
Zacks Reports |
StockTalk |
News |
Chart |
Request a new note
C
A N
S L
I M
|
LULU
-
NASDAQ
Lululemon Athletica
MANUFACTURING - Textile Manufacturing
|
$97.58
|
+0.35
0.36% |
$98.29
|
1,436,392
68.84% of 50 DAV
50 DAV is 2,086,500
|
$102.83
-5.10%
|
5/18/2011
|
$98.15
|
PP = $102.93
|
|
MB = $108.08
|
Most Recent Note - 5/23/2011 4:10:58 PM
Y - Managed a positive reversal today after a small gap down. Volume totals have been lighter than average in recent weeks while this high-ranked Retail-Apparel firm has been consolidating near its all-time highs. Color code was changed to yellow with new pivot point cited based on a new base pattern formed since its 4/21/11 high. Its 50 DMA line defines support coinciding near recent chart lows, important levels to watch on pullbacks.
>>> The latest Featured Stock Update with an annotated graph appeared on 5/3/2011. Click here.
View all notes |
Alert me of new notes |
CANSLIM.net Company Profile |
SEC |
Zacks Reports |
StockTalk |
News |
Chart |
Request a new note
C
A N
S L
I M
|
MG
-
NYSE
Mistras Group Inc
DIVERSIFIED SERVICES - Bulding and Faci;ity Management Services
|
$16.48
|
+0.03
0.18% |
$16.54
|
76,017
42.30% of 50 DAV
50 DAV is 179,700
|
$18.46
-10.73%
|
3/15/2011
|
$15.48
|
PP = $15.90
|
|
MB = $16.70
|
Most Recent Note - 5/19/2011 5:31:03 PM
G - Completed a new Public Offering recently and it is now lingering below its 50 DMA line with volume totals cooling. Gains above that short-term average would help its outlook, technically, meanwhile the recent low ($15.44 on 5/05/11) defines the next chart support.
>>> The latest Featured Stock Update with an annotated graph appeared on 5/12/2011. Click here.
View all notes |
Alert me of new notes |
CANSLIM.net Company Profile |
SEC |
Zacks Reports |
StockTalk |
News |
Chart |
Request a new note
C
A N
S L
I M
|
MWIV
-
NASDAQ
M W I Veterinary Supply
HEALTH SERVICES - Medical Instruments and; Supplies
|
$81.43
|
+0.42
0.52% |
$81.64
|
61,289
69.65% of 50 DAV
50 DAV is 88,000
|
$86.99
-6.39%
|
11/4/2010
|
$61.79
|
PP = $59.60
|
|
MB = $62.58
|
Most Recent Note - 5/19/2011 5:32:05 PM
G - Hovering in a tight trading range near its all-time high with volume totals cooling since 5/05/11 while stubbornly holding its ground. It has not formed a sound base pattern. Its 50 DMA line defines important support to watch.
>>> The latest Featured Stock Update with an annotated graph appeared on 5/5/2011. Click here.
View all notes |
Alert me of new notes |
CANSLIM.net Company Profile |
SEC |
Zacks Reports |
StockTalk |
News |
Chart |
Request a new note
C
A N
S L
I M
|
Symbol/Exchange
Company Name
Industry Group |
PRICE |
CHANGE
(%Change) |
Day High |
Volume
(% DAV)
(% 50 day avg vol) |
52 Wk Hi
% From Hi |
Featured
Date |
Price
Featured |
Pivot Featured |
|
Max Buy |
OPNT
-
NASDAQ
Opnet Technologies
INTERNET - Internet Software and Services
|
$37.94
|
+0.92
2.49% |
$38.29
|
60,510
47.53% of 50 DAV
50 DAV is 127,300
|
$42.51
-10.75%
|
5/11/2011
|
$41.21
|
PP = $40.50
|
|
MB = $42.53
|
Most Recent Note - 5/25/2011 4:22:33 PM
G - Gain today with light volume helped it rally near its 50 DMA line ($38.07 now) which may now act as resistance. Its color code was changed to green after it completely negated its latest breakout.
>>> The latest Featured Stock Update with an annotated graph appeared on 5/11/2011. Click here.
View all notes |
Alert me of new notes |
CANSLIM.net Company Profile |
SEC |
Zacks Reports |
StockTalk |
News |
Chart |
Request a new note
C
A N
S L
I M
|
PCLN
-
NASDAQ
Priceline.Com Inc
INTERNET - Internet Software and Services
|
$498.81
|
+7.89
1.61% |
$502.77
|
1,047,938
92.70% of 50 DAV
50 DAV is 1,130,500
|
$561.88
-11.22%
|
1/3/2011
|
$399.55
|
PP = $428.20
|
|
MB = $449.61
|
Most Recent Note - 5/23/2011 3:55:20 PM
G - Gapped down today, violating its 50 DMA line again with a loss on higher volume indicative of more distributional pressure. Recent chart low ($493.67 on 5/17/11) defines an important near-term support level where further deterioration would raise even greater concerns.
>>> The latest Featured Stock Update with an annotated graph appeared on 5/19/2011. Click here.
View all notes |
Alert me of new notes |
CANSLIM.net Company Profile |
SEC |
Zacks Reports |
StockTalk |
News |
Chart |
Request a new note
C
A N
S L
I M
|
RAX
-
NYSE
Rackspace Hosting Inc
INTERNET - Internet Software and; Services
|
$41.40
|
+0.53
1.30% |
$41.74
|
1,335,361
75.21% of 50 DAV
50 DAV is 1,775,500
|
$46.50
-10.96%
|
3/16/2011
|
$36.28
|
PP = $40.72
|
|
MB = $42.76
|
Most Recent Note - 5/23/2011 3:58:25 PM
G - Gapped down for a loss today without heavy volume, slumping near its 50 DMA line. It has not formed a sound new base. Deterioration below its recent chart low ($38.84 on 5/12/11) would trigger more worrisome technical sell signals.
>>> The latest Featured Stock Update with an annotated graph appeared on 5/13/2011. Click here.
View all notes |
Alert me of new notes |
CANSLIM.net Company Profile |
SEC |
Zacks Reports |
StockTalk |
News |
Chart |
Request a new note
C
A N
S L
I M
|
TIBX
-
NASDAQ
Tibco Software Inc
COMPUTER SOFTWARE and SERVICES - Business Software and Services
|
$28.18
|
+0.43
1.55% |
$28.36
|
2,491,137
93.69% of 50 DAV
50 DAV is 2,658,900
|
$30.75
-8.36%
|
3/18/2011
|
$23.88
|
PP = $26.04
|
|
MB = $27.34
|
Most Recent Note - 5/23/2011 3:48:09 PM
G - Gapped down today, consolidating just above its 50 DMA line and recent low ($27.17). Violations may trigger technical sell signals.
>>> The latest Featured Stock Update with an annotated graph appeared on 5/18/2011. Click here.
View all notes |
Alert me of new notes |
CANSLIM.net Company Profile |
SEC |
Zacks Reports |
StockTalk |
News |
Chart |
Request a new note
C
A N
S L
I M
|
ULTA
-
NASDAQ
Ulta Salon Cosm & Frag
SPECIALTY RETAIL - Specialty Retail, Other
|
$52.83
|
+0.78
1.50% |
$53.18
|
279,985
53.87% of 50 DAV
50 DAV is 519,700
|
$56.87
-7.10%
|
1/6/2011
|
$36.12
|
PP = $37.34
|
|
MB = $39.21
|
Most Recent Note - 5/20/2011 4:49:03 PM
G - Losses this week with higher volume were indicative of distributional pressure while slumping from its all-time high toward its 50 DMA line (now $50.68). Chart readers know that short-term average typically defines support to watch where a violation may trigger a technical sell signal.
>>> The latest Featured Stock Update with an annotated graph appeared on 4/28/2011. Click here.
View all notes |
Alert me of new notes |
CANSLIM.net Company Profile |
SEC |
Zacks Reports |
StockTalk |
News |
Chart |
Request a new note
C
A N
S L
I M
|
Symbol/Exchange
Company Name
Industry Group |
PRICE |
CHANGE
(%Change) |
Day High |
Volume
(% DAV)
(% 50 day avg vol) |
52 Wk Hi
% From Hi |
Featured
Date |
Price
Featured |
Pivot Featured |
|
Max Buy |
|
 |
| Subscriber Questions: |
May 24, 2011 |
Dear Ken,
I just signed up today as a premium member, and used to be a member earlier too. I am a little concerned that there is only one Featured stock in the Featured stock list with a Y LULU. Are you planning to add more stocks to the list and in what timeframe? I have been a fan of your Featured stock list and I only signed up again for this list. Please let me know. Thanks. Hilario |
| Ken's Response: |
May 25, 2011 |
Dear Hilario,
Welcome back! I looked into your membership history with CANSLIM.net and it seems that after your upgraded membership expired on 11/4/2010 you let nearly 6 months pass. We are very pleased that you chose to reactive your upgraded membership. Indeed, we expect that in the year ahead there will be many opportunities for you to benefit greatly from our service.
If you take time to scroll down through the dynamic archives of this year's mid-day and after market reports
(http://premium.canslim.net/Archives/2011/default.asp) these are some of the symbols of stocks that were highlighted in yellow earlier this year that you might not have read about.
OPEN at $74.05 1/05/11 subsequently traded as high as $118.66
PCLN at $427.20 1/05/11 subsequently traded as high as $561.88
ULTA at $36.32 on 1/06/11 subsequently traded as high as $56.87
TIBX at $24.35 on 2/01/11 subsequently traded as high as $30.75
LULU at $76.84 on 2/04/11 subsequently traded as high as $102.83
MG at $15.48 on 3/15/11 subsequently traded as high as $18.46
Other new or returning stocks which were highlighted in yellow this year included HS, RAX, ARUN, ORCL, UA, CRUS, BIDU, CMG, DECK, EBIX, JOBS, EZPW, AIXG, OPNT. In particular, GSIT and CTCT are two issues that were highlighted in yellow this year which can serve as examples of exactly why having a strict discipline of limiting losses at 7-8% is crucial to your success.
I understand that you are looking for actionable ideas under the fact-based system. If you simply looked at the Featured Stocks page for stocks currently highlighted in yellow, however, you might easily overlook some very important details concerning the market environment (M criteria) which have been covered in detail in the daily After Market Updates. Also, in the monthly newsletter, CANSLIM.net News May 2011 issue we included a comprehensive market commentary under the headline "Rally Continues; Worthy Targets Recently More Elusive". There was also an Editor's Letter under the headline "Read This, And Stay Out Of The Pool!". http://premium.canslim.net/Premium/cnn.aspx?D=050111 Since this was published, market conditions have only deteriorated.
One of the key concerns we have repeated in recent commentaries has been the poor performance in the financial groups ($XBD Broker/Dealer Index, and $BKX Bank Index) frequently highlighted in the Industry Group Watch section. They are considered reliable "leading indicators" and, as an example, our longtime members saw us call attention in the past as they both topped out and started getting into technical trouble earlier in 2007, well before the major averages topped out in October 2007 and then entered a Bear Market.
I am not saying that we are heading into another bear market now, but until the financials start acting better, history suggests that the major averages are prone to more severe downdrafts. Without an expansion in leadership (stocks making new 52-week highs) it is also difficult or impossible for the market to make a sustained advance. This is why the Market Commentary we publish each day emphasizes the number of high-ranked Leaders List stocks hitting new 52-week highs - to identify if there is a healthy crop of strong leaders or not!
When I was in the Certification program in May 2005 the market was in a correction after having enjoyed a better than 2-year rally from the March 2003 lows. The expert trainers said at the time, "The next confirmed rally with a follow-through day could always be just 4 days away."
Best regards,

Kenneth J. Gruneisen
Founder & Contributing Writer for CANSLIM.net
www.canslim.net |
|
|
|
THESE ARE NOT BUY RECOMMENDATIONS!
Comments contained in the body of this report are technical
opinions only. The material herein has been obtained
from sources believed to be reliable and accurate, however,
its accuracy and completeness cannot be guaranteed.
This site is not an investment advisor, hence it does
not endorse or recommend any securities or other investments.
Any recommendation contained in this report may not
be suitable for all investors and it is not to be deemed
an offer or solicitation on our part with respect to
the purchase or sale of any securities. All trademarks,
service marks and trade names appearing in this report
are the property of their respective owners, and are
likewise used for identification purposes only.
This report is a service available
only to active Paid Premium Members.
You may opt-out of receiving report notifications
at any time. Questions or comments may be submitted
by writing to Premium Membership Services 665 S.E. 10 Street, Suite 201 Deerfield Beach, FL 33441-5634 or by calling 1-800-965-8307
or 954-785-1121.
|
|
|

