You are not logged in.
This means you
CAN ONLY VIEW reports that were published prior to Monday, April 14, 2025.
You
MUST UPGRADE YOUR MEMBERSHIP if you want to see any current reports.
AFTER MARKET UPDATE - FRIDAY, MAY 24TH, 2013
Previous After Market Report Next After Market Report >>>
|
|
|
|
DOW |
+8.60 |
15,303.10 |
+0.06% |
|
Volume |
590,738,530 |
-30% |
|
Volume |
1,409,041,730 |
-19% |
|
NASDAQ |
-0.28 |
3,459.14 |
-0.01% |
|
Advancers |
1,330 |
43% |
|
Advancers |
1,279 |
50% |
|
S&P 500 |
-0.91 |
1,649.60 |
-0.06% |
|
Decliners |
1,639 |
53% |
|
Decliners |
1,174 |
46% |
|
Russell 2000 |
-0.00 |
984.28 |
-0.00% |
|
52 Wk Highs |
60 |
|
|
52 Wk Highs |
68 |
|
|
S&P 600 |
+0.01 |
553.18 |
+0.00% |
|
52 Wk Lows |
22 |
|
|
52 Wk Lows |
15 |
|
|
 |
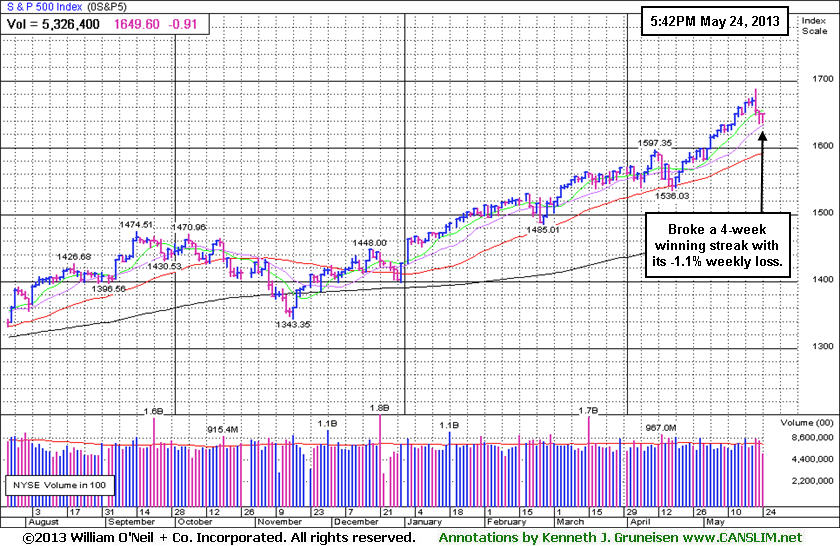
Indices Break From 4-Week Winning Streak to Record Highs
Kenneth J. Gruneisen - Passed the CAN SLIM® Master's Exam
Losses for the week ended a 4-week winning streak as the Dow Jones Industrial Average was down -0.3%, and the S&P 500 Index and Nasdaq Composite Index were both off about -1.1% for the week The major averages ended mixed on Friday's session, albeit off of their worst levels. The volume totals were reported much lighter than the prior session totals on the Nasdaq exchange and on the NYSE as traders headed out for the long Memorial Day weekend. Advancers narrowly led decliners on the Nasdaq exchange but decliners outnumbered advancers by an 8-7 margin on the NYSE. There were 17 high-ranked companies from the CANSLIM.net Leaders List making new 52-week highs and appearing on the CANSLIM.net BreakOuts Page, up from the prior session total of 10 only stocks. New 52-week highs outnumbered new 52-week lows on both the NYSE and the Nasdaq exchange. There were gains for 9 of the 14 high-ranked companies currently included on the Featured Stocks Page.
Investors continued to weigh concerns that the Federal Reserve could be considering paring back its bond purchasing program. On the economic front, durable goods orders for April topped expectations but are had little positive effect on equities.
Nine of the 10 sectors on the S&P finished lower, led by declines in utility stocks. Duke Energy Corp (DUK -1.26%) led the space lower. Retailers showed weakness following some disappointing corporate earnings reports. Sears Holdings Corp (SHLD -13.62%) and Abercrombie & Fitch Co (ANF -8.00%) fell hard after posting results below analysts' expectations. Williams-Sonoma Inc (WSM -2.05%) and Salesforce.com Inc (CRM -5.34%) also fell following their quarterly profit tallies.
Turning to fixed income markets, Treasuries were higher along the curve with the benchmark 10-year note up 1/16 of a point to yield 2.01%.
The market (M criteria) uptrend has lifted the Dow Jones Industrial Average and the S&P 500 Index to new record highs. The indices' rally to new highs confirmed the market's uptrend which means odds are favorable for new buying efforts in stocks meeting all of the fact-based investment system's key criteria. Action-worthy leaders best matching the winning models are covered on an ongoing basis on the Featured Stocks Page - including our Certified experts' latest notes and links to additional resources including detailed analysis with annotated graphs.
The Premium Member Homepage - includes "dynamic archives" to all prior pay reports published. Watch for an announcement via email concerning the next WEBCAST.
PICTURED: The S&P 500 Index broke a 4-week winning streak with its -1.1% weekly loss.
|
 Kenneth J. Gruneisen started out as a licensed stockbroker in August 1987, a couple of months prior to the historic stock market crash that took the Dow Jones Industrial Average down -22.6% in a single day. He has published daily fact-based fundamental and technical analysis on high-ranked stocks online for two decades. Through FACTBASEDINVESTING.COM, Kenneth provides educational articles, news, market commentary, and other information regarding proven investment systems that work in good times and bad.
Comments contained in the body of this report are technical opinions only and are not necessarily those of Gruneisen Growth Corp. The material herein has been obtained from sources believed to be reliable and accurate, however, its accuracy and completeness cannot be guaranteed. Our firm, employees, and customers may effect transactions, including transactions contrary to any recommendation herein, or have positions in the securities mentioned herein or options with respect thereto. Any recommendation contained in this report may not be suitable for all investors and it is not to be deemed an offer or solicitation on our part with respect to the purchase or sale of any securities. |
|
 |
Defensive Groups Lagged on Mixed Session
Kenneth J. Gruneisen - Passed the CAN SLIM® Master's Exam
Financial shares were mixed on Friday as the Bank Index ($BKX +0.33%) edged higher and the Broker/Dealer Index ($XBD -0.31%) edged lower. Energy-related shares quietly ended lower as the Integrated Oil Index ($XOI -0.16%) and Oil Services Index ($OSX -0.15%) finished with tiny losses. The Retail Index ($RLX -0.13%), Internet Index ($IIX -0.16%), and Semiconductor Index ($SOX -0.05%) had a slightly negative bias while the Networking Index ($NWX +0.56%) was a standout gainer in the tech sector. The Biotechnology Index ($BTK -0.52%) and defensive groups fell hardest as the Healthcare Index ($HMO -1.29%) and Gold & Silver Index ($XAU -1.25%) lagged.
Charts courtesy www.stockcharts.com
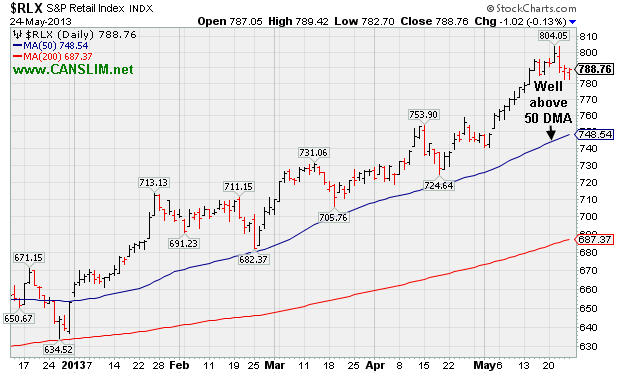
PICTURED: The Retail Index ($RLX -0.13%) is consolidating well above its 50-day moving average (DMA) line.
| Oil Services |
$OSX |
259.37 |
-0.40 |
-0.15% |
+17.81% |
| Healthcare |
$HMO |
3,070.50 |
-40.05 |
-1.29% |
+22.13% |
| Integrated Oil |
$XOI |
1,397.81 |
-2.21 |
-0.16% |
+12.56% |
| Semiconductor |
$SOX |
461.50 |
-0.25 |
-0.05% |
+20.16% |
| Networking |
$NWX |
238.72 |
+1.33 |
+0.56% |
+5.37% |
| Internet |
$IIX |
379.69 |
-0.61 |
-0.16% |
+16.11% |
| Broker/Dealer |
$XBD |
121.42 |
-0.37 |
-0.31% |
+28.72% |
| Retail |
$RLX |
788.76 |
-1.02 |
-0.13% |
+20.78% |
| Gold & Silver |
$XAU |
100.58 |
-1.27 |
-1.25% |
-39.26% |
| Bank |
$BKX |
60.88 |
+0.20 |
+0.33% |
+18.72% |
| Biotech |
$BTK |
1,982.63 |
-10.43 |
-0.52% |
+28.16% |
|
|
|
 |
Finished Week With Quiet Gains After Negating Prior Breakout
Kenneth J. Gruneisen - Passed the CAN SLIM® Master's Exam
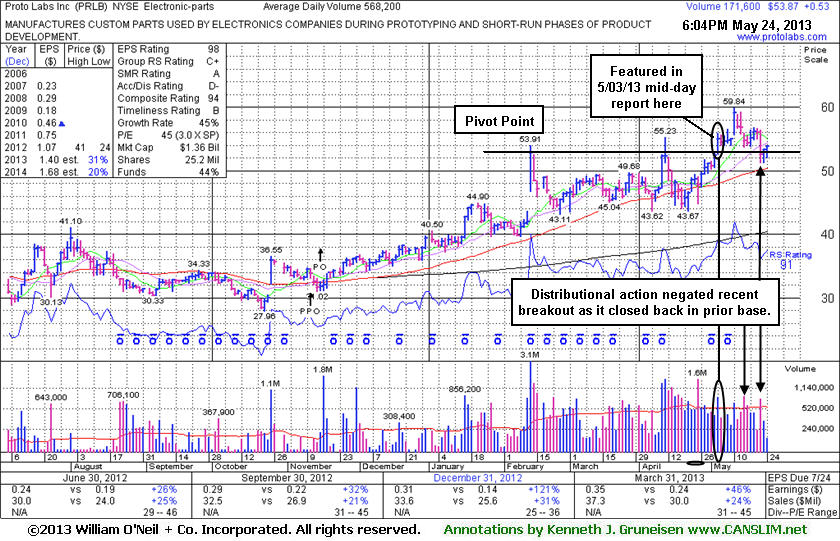
Proto Labs Inc (PRLB +$0.53 or +0.99% to $53.87) tallied small gains with very light volume after a damaging loss with above average volume led to a retreat below its pivot point. It remains above its 50-day moving average (DMA) line, however its close below its old high close ($52.82 on 2/13/13) on Wednesday completely negated its technical breakout as it slumped back into its prior base. It was last shown in this FSU section with an annotated graph on 5/03/13 under the headline, "Volume +47% Above Average Behind Gain for New Highs", after highlighted in yellow in the earlier mid-day report (read here). The previously cited pivot point (based on its 2/13/13 high) still was considered a very important threshold as it hit a new 52-week high with a solid gain backed by +47% above average volume, sufficient to clinch a technical buy signal. However, subsequent gains lacked volume conviction, and then distributional action began taking its toll.
The number of top-rated funds owning its shares rose from 131 in Jun '12 to 204 in Mar '13, a reassuring trend concerning the I criteria. Its small supply of only 18.9 million shares (S criteria) in the publicly traded float is ideal, yet it can contribute to greater price volatility in the event of institutional buying or selling. Its Accumulation/ Distribution Rating of D- was noted as a concern after losses with above average volume following its earlier breakout attempt which failed. It recently reported earnings +46% on +24% sales revenues for the Mar '13 quarter, continuing its strong growth trend satisfying the C criteria. The high-ranked Electronic - Parts firm may likely find support above its 50-day moving average (DMA) line and continue rallying, however disciplined investors always limit losses by selling if any stock falls more than -7% from their purchase price.
|
|
|
Color Codes Explained :
Y - Better candidates highlighted by our
staff of experts.
G - Previously featured
in past reports as yellow but may no longer be buyable under the
guidelines.
***Last / Change / Volume data in this table is the closing quote data***
Symbol/Exchange
Company Name
Industry Group |
PRICE |
CHANGE
(%Change) |
Day High |
Volume
(% DAV)
(% 50 day avg vol) |
52 Wk Hi
% From Hi |
Featured
Date |
Price
Featured |
Pivot Featured |
|
Max Buy |
AL
-
NYSE
Air Lease Corp Cl A
DIVERSIFIED SERVICES - Rental and Leasing Services
|
$28.89
|
+0.09
0.31% |
$29.02
|
205,754
43.76% of 50 DAV
50 DAV is 470,200
|
$31.00
-6.81%
|
5/9/2013
|
$30.95
|
PP = $29.38
|
|
MB = $30.85
|
Most Recent Note - 5/23/2013 4:21:00 PM
Y - Gapped down today and tested support at its 50 DMA line with a loss on above average volume, slumping back below its pivot point.
>>> The latest Featured Stock Update with an annotated graph appeared on 5/9/2013. Click here.
View all notes |
Alert me of new notes |
CANSLIM.net Company Profile |
SEC |
Zacks Reports |
StockTalk |
News |
Chart |
Request a new note
C
A N
S L
I M


|
AMBA
-
NASDAQ
Ambarella Inc
ELECTRONICS - Semiconductor - Specialized
|
$15.49
|
-0.70
-4.32% |
$16.36
|
968,395
132.68% of 50 DAV
50 DAV is 729,900
|
$17.90
-13.46%
|
5/6/2013
|
$15.31
|
PP = $16.10
|
|
MB = $16.91
|
 Most Recent Note - 5/24/2013 5:48:13 PM
Y - Suffered another loss today with above aveerage volume and finished near the session low. The close below its old high close ($15.66 on 3/28/13) raised more serious concerns by completely negating its recent breakout.
>>> The latest Featured Stock Update with an annotated graph appeared on 5/6/2013. Click here.
View all notes |
Alert me of new notes |
CANSLIM.net Company Profile |
SEC |
Zacks Reports |
StockTalk |
News |
Chart |
Request a new note
C
A N
S L
I M
|
CELG
-
NASDAQ
Celgene Corp
DRUGS - Drug Manufacturers - Major
|
$122.58
|
-1.06
-0.86% |
$123.71
|
2,286,520
73.73% of 50 DAV
50 DAV is 3,101,200
|
$131.82
-7.01%
|
3/27/2013
|
$113.24
|
PP = $115.54
|
|
MB = $121.32
|
Most Recent Note - 5/23/2013 3:33:59 PM
G - Holding its ground above its 50 DMA line after encountering distributional pressure. A violation of its 50 DMA line (now $119.60) would raise concerns and trigger a technical sell signal. It is extended from any sound base pattern, yet may go on to produce more climactic gains.
>>> The latest Featured Stock Update with an annotated graph appeared on 5/13/2013. Click here.
View all notes |
Alert me of new notes |
CANSLIM.net Company Profile |
SEC |
Zacks Reports |
StockTalk |
News |
Chart |
Request a new note
C
A N
S L
I M
|
EQM
-
NYSE
E Q T Midstream Partners
ENERGY - Oil and Gas Pipelines
|
$50.36
|
+0.36
0.72% |
$50.71
|
156,229
181.66% of 50 DAV
50 DAV is 86,000
|
$50.79
-0.85%
|
4/25/2013
|
$40.16
|
PP = $40.84
|
|
MB = $42.88
|
Most Recent Note - 5/24/2013 6:04:38 PM
G - Tallied its 8th consecutive gain today with above average volume as it inched to a new all-time high close, getting more extended from its latest base. Its 50 DMA line defines important near-term chart support above prior highs.
>>> The latest Featured Stock Update with an annotated graph appeared on 5/16/2013. Click here.
View all notes |
Alert me of new notes |
CANSLIM.net Company Profile |
SEC |
Zacks Reports |
StockTalk |
News |
Chart |
Request a new note
C
A N
S L
I M
|
FLT
-
NYSE
Fleetcor Technologies
DIVERSIFIED SERVICES - Business/Management Services
|
$82.54
|
+0.48
0.58% |
$82.95
|
575,529
63.68% of 50 DAV
50 DAV is 903,800
|
$85.56
-3.53%
|
3/21/2013
|
$71.14
|
PP = $73.00
|
|
MB = $76.65
|
Most Recent Note - 5/22/2013 1:55:11 PM
G - Still stubbornly holding its ground near its all-time high, extended from any sound base pattern. Its 50 DMA line and recent low ($70.09) define near-term support where violations would raise more serious concerns and trigger worrisome technical sell signals.
>>> The latest Featured Stock Update with an annotated graph appeared on 5/8/2013. Click here.
View all notes |
Alert me of new notes |
CANSLIM.net Company Profile |
SEC |
Zacks Reports |
StockTalk |
News |
Chart |
Request a new note
C
A N
S L
I M
|
Symbol/Exchange
Company Name
Industry Group |
PRICE |
CHANGE
(%Change) |
Day High |
Volume
(% DAV)
(% 50 day avg vol) |
52 Wk Hi
% From Hi |
Featured
Date |
Price
Featured |
Pivot Featured |
|
Max Buy |
LNKD
-
NYSE
Linkedin Corp Class A
INTERNET - Internet Information Providers
|
$173.80
|
-2.53
-1.43% |
$176.77
|
1,362,841
57.87% of 50 DAV
50 DAV is 2,355,200
|
$202.91
-14.35%
|
4/12/2013
|
$182.69
|
PP = $184.25
|
|
MB = $193.46
|
Most Recent Note - 5/22/2013 5:49:47 PM
G - Loss today with higher but near average volume led to a close just below its 50 DMA line raising concerns and its color code is changed to green. Recent lows in the $171 area define important near-term support above the 4/03/13 low ($165), levels where subsequent violations may raise greater concerns and trigger more worrisome technical sell signals.
>>> The latest Featured Stock Update with an annotated graph appeared on 5/21/2013. Click here.
View all notes |
Alert me of new notes |
CANSLIM.net Company Profile |
SEC |
Zacks Reports |
StockTalk |
News |
Chart |
Request a new note
C
A N
S L
I M
|
LOPE
-
NASDAQ
Grand Canyon Education
DIVERSIFIED SERVICES - Education and; Training Services
|
$33.00
|
+0.33
1.01% |
$33.37
|
592,062
149.55% of 50 DAV
50 DAV is 395,900
|
$34.07
-3.14%
|
5/10/2013
|
$29.03
|
PP = $27.28
|
|
MB = $28.64
|
Most Recent Note - 5/22/2013 12:37:56 PM
G - Adding to its spurt of volume-driven gains with today's 7th consecutive gain, getting very extended from prior highs. Gains of greater than +20% in the first 2-3 weeks following its "breakaway gap" suggest holding for a minimum of 8 week under the fact-based investment system's rules. Prior highs in the $27 area define initial support to watch on pullbacks.
>>> The latest Featured Stock Update with an annotated graph appeared on 5/10/2013. Click here.
View all notes |
Alert me of new notes |
CANSLIM.net Company Profile |
SEC |
Zacks Reports |
StockTalk |
News |
Chart |
Request a new note
C
A N
S L
I M
|
MRLN
-
NASDAQ
Marlin Business Services
DIVERSIFIED SERVICES - Rental and Leasing Services
|
$23.37
|
+1.07
4.80% |
$23.50
|
22,797
93.05% of 50 DAV
50 DAV is 24,500
|
$25.97
-10.01%
|
3/15/2013
|
$22.29
|
PP = $23.18
|
|
MB = $24.34
|
Most Recent Note - 5/24/2013 6:49:31 PM
Y - Color code is changed to yellow again as it promptly rebounded back above its 50 DMA line today, The gain on higher (near average) volume and strong finish near the session high helped its technical stance and outlook improve.
>>> The latest Featured Stock Update with an annotated graph appeared on 5/23/2013. Click here.
View all notes |
Alert me of new notes |
CANSLIM.net Company Profile |
SEC |
Zacks Reports |
StockTalk |
News |
Chart |
Request a new note
C
A N
S L
I M
|
N
-
NYSE
Netsuite Inc
DIVERSIFIED SERVICES - Business/Management Services
|
$87.35
|
-2.34
-2.61% |
$88.75
|
510,520
141.14% of 50 DAV
50 DAV is 361,700
|
$95.76
-8.78%
|
12/12/2012
|
$64.75
|
PP = $67.12
|
|
MB = $70.48
|
Most Recent Note - 5/24/2013 6:45:50 PM
G - Gapped down today for another loss with above average volume, and weak technical action this week raised concerns. Previously noted - "It is extended from any sound base. Fundamentally, concerns were raised by 2 consecutive quarterly comparisons with earnings below the minimum guideline (C criteria)."
>>> The latest Featured Stock Update with an annotated graph appeared on 5/15/2013. Click here.
View all notes |
Alert me of new notes |
CANSLIM.net Company Profile |
SEC |
Zacks Reports |
StockTalk |
News |
Chart |
Request a new note
C
A N
S L
I M
|
NSM
-
NYSE
Nationstar Mtg Hldgs Inc
FINANCIAL SERVICES - Credit Services
|
$41.89
|
-0.44
-1.04% |
$42.41
|
1,421,733
110.16% of 50 DAV
50 DAV is 1,290,600
|
$46.91
-10.70%
|
5/7/2013
|
$39.71
|
PP = $42.34
|
|
MB = $44.46
|
Most Recent Note - 5/23/2013 1:02:26 PM
Y - Color code is changed to yellow while it has shown resilience and rebounded into positive territory after gapping down today following a damaging loss with above average volume with a weak finish on the prior session. Prior highs in the $42 area define initial chart support to watch. Disciplined investors alway limit losses by selling any stock that falls more than -7% from their purchase price.
>>> The latest Featured Stock Update with an annotated graph appeared on 5/7/2013. Click here.
View all notes |
Alert me of new notes |
CANSLIM.net Company Profile |
SEC |
Zacks Reports |
StockTalk |
News |
Chart |
Request a new note
C
A N
S L
I M
|
Symbol/Exchange
Company Name
Industry Group |
PRICE |
CHANGE
(%Change) |
Day High |
Volume
(% DAV)
(% 50 day avg vol) |
52 Wk Hi
% From Hi |
Featured
Date |
Price
Featured |
Pivot Featured |
|
Max Buy |
PRAA
-
NASDAQ
Portfolio Recovery Assoc
DIVERSIFIED SERVICES - Business/Management Services
|
$147.12
|
+0.63
0.43% |
$147.95
|
53,885
76.65% of 50 DAV
50 DAV is 70,300
|
$151.51
-2.90%
|
5/1/2013
|
$130.77
|
PP = $127.88
|
|
MB = $134.27
|
Most Recent Note - 5/22/2013 5:42:38 PM
G - Hovering near its 52-week high after an impressive streak of 13 consecutive gains into new high territory. It is very extended from prior highs in the $127 area and its 50 DMA line defining important chart support. See the latest FSU analysis for more details and a new annotated graph.
>>> The latest Featured Stock Update with an annotated graph appeared on 5/22/2013. Click here.
View all notes |
Alert me of new notes |
CANSLIM.net Company Profile |
SEC |
Zacks Reports |
StockTalk |
News |
Chart |
Request a new note
C
A N
S L
I M
|
PRLB
-
NYSE
Proto Labs Inc
MANUFACTURING - Small Tools and Accessories
|
$53.87
|
+0.53
0.99% |
$53.95
|
172,777
30.41% of 50 DAV
50 DAV is 568,200
|
$59.84
-9.98%
|
5/3/2013
|
$54.77
|
PP = $54.01
|
|
MB = $56.71
|
Most Recent Note - 5/24/2013 6:43:18 PM
Y - Consolidating above its 50 DMA line after slumping into its prior base. See the latest FSU analysis for more details and a new annotated graph.
>>> The latest Featured Stock Update with an annotated graph appeared on 5/24/2013. Click here.
View all notes |
Alert me of new notes |
CANSLIM.net Company Profile |
SEC |
Zacks Reports |
StockTalk |
News |
Chart |
Request a new note
C
A N
S L
I M
|
RRTS
-
NYSE
Roadrunner Trans Systems
TRANSPORTATION - Air Delivery and Freight Service
|
$27.44
|
+0.25
0.92% |
$27.47
|
86,506
41.27% of 50 DAV
50 DAV is 209,600
|
$28.00
-2.00%
|
4/3/2013
|
$22.77
|
PP = $23.75
|
|
MB = $24.94
|
Most Recent Note - 5/22/2013 1:41:27 PM
G - Hitting another new all-time high with light volume behind today's gain while getting more extended from its latest base. Prior highs in the $23 area define initial support to watch above its 50 DMA line. Fundamental concerns were raised by its sub par earnings increase in the Mar '13 quarter, below the +25% minimum guideline (C criteria).
>>> The latest Featured Stock Update with an annotated graph appeared on 5/14/2013. Click here.
View all notes |
Alert me of new notes |
CANSLIM.net Company Profile |
SEC |
Zacks Reports |
StockTalk |
News |
Chart |
Request a new note
C
A N
S L
I M
|
VRX
-
NYSE
Valeant Pharmaceuticals
DRUGS - Drug Manufacturers - Other
|
$84.47
|
+9.80
13.12% |
$87.50
|
10,383,614
724.46% of 50 DAV
50 DAV is 1,433,300
|
$78.69
7.35%
|
4/30/2013
|
$60.24
|
PP = $76.66
|
|
MB = $80.49
|
Most Recent Note - 5/23/2013 4:24:04 PM
Y- Volume totals have been cooling while consolidating just above its 50 DMA line, an encouraging sign that few investors have headed for the exit. Below that important short-term average its prior low ($69.87 on 4/04/13) defines important support. Subsequent violations may trigger technical sell signals. Prior reports cautioned - "Sub par earnings for the Mar '13 quarter below the +25% minimum guideline (C criteria) raised fundamental concerns."
>>> The latest Featured Stock Update with an annotated graph appeared on 5/17/2013. Click here.
View all notes |
Alert me of new notes |
CANSLIM.net Company Profile |
SEC |
Zacks Reports |
StockTalk |
News |
Chart |
Request a new note
C
A N
S L
I M
|
|
|
|
THESE ARE NOT BUY RECOMMENDATIONS!
Comments contained in the body of this report are technical
opinions only. The material herein has been obtained
from sources believed to be reliable and accurate, however,
its accuracy and completeness cannot be guaranteed.
This site is not an investment advisor, hence it does
not endorse or recommend any securities or other investments.
Any recommendation contained in this report may not
be suitable for all investors and it is not to be deemed
an offer or solicitation on our part with respect to
the purchase or sale of any securities. All trademarks,
service marks and trade names appearing in this report
are the property of their respective owners, and are
likewise used for identification purposes only.
This report is a service available
only to active Paid Premium Members.
You may opt-out of receiving report notifications
at any time. Questions or comments may be submitted
by writing to Premium Membership Services 665 S.E. 10 Street, Suite 201 Deerfield Beach, FL 33441-5634 or by calling 1-800-965-8307
or 954-785-1121.
|
|
|

