You are not logged in.
This means you
CAN ONLY VIEW reports that were published prior to Monday, April 14, 2025.
You
MUST UPGRADE YOUR MEMBERSHIP if you want to see any current reports.
AFTER MARKET UPDATE - MONDAY, MAY 24TH, 2010
Previous After Market Report Next After Market Report >>>
|
|
|
|
DOW |
-126.82 |
10,066.57 |
-1.24% |
|
Volume |
1,313,373,110 |
-43% |
|
Volume |
2,024,567,870 |
-38% |
|
NASDAQ |
-15.49 |
2,213.55 |
-0.69% |
|
Advancers |
1,185 |
37% |
|
Advancers |
936 |
33% |
|
S&P 500 |
-14.04 |
1,073.65 |
-1.29% |
|
Decliners |
1,921 |
60% |
|
Decliners |
1,755 |
62% |
|
Russell 2000 |
-8.08 |
641.21 |
-1.24% |
|
52 Wk Highs |
17 |
|
|
52 Wk Highs |
12 |
|
|
S&P 600 |
-4.60 |
344.92 |
-1.32% |
|
52 Wk Lows |
28 |
|
|
52 Wk Lows |
59 |
|
|
 |
Stock Suffer Broad Losses on Lighter Volume
Adam Sarhan, Contributing Writer,
The major averages ended lower as the dollar rallied after European debt woes continued to spread. As expected volume was lighter compared to Friday's heavy options expiration levels. Decliners led advancers by more than a 3-to-2 ratio on the NYSE and by nearly a 2-to-1 ratio on the Nasdaq exchange. New 52-week lows outnumbered new 52-week highs on the Nasdaq exchange and on the NYSE. Leadership was narrow on Monday as there were only 4 high-ranked companies from the CANSLIM.net Leaders List that made a new 52-week high and appeared on the CANSLIM.net BreakOuts Page, higher than the 0 issues that appeared on Friday. It is difficult for the market to mount a sustained rally without a healthy crop of strong leaders.
Fresh contagion woes spread after Spain said it stepped in to save one of its largest banks. The Bank of Spain put CajaSur, a large Spanish bank, under a provisional administrator after the bank lost 596 million euros ($739 million) on 426 million euros in revenue last year. This sent a slew of financial shares lower across the globe as investors were concerned that more banks will fail.
In the US, the National Association of Realtors said sales of existing homes (i.e. previously owned homes) rose in April to the highest level in five months. The report said buyers scrambled to buy the homes before the government's tax credit expired. Sales increased +7.6% to a 5.77 million annual rate. This was the highest reading since November 2009 which was the month the incentive was first due to expire. Initially, housing stocks rallied on the news but the bears quickly showed up and quelled the bulls' efforts.
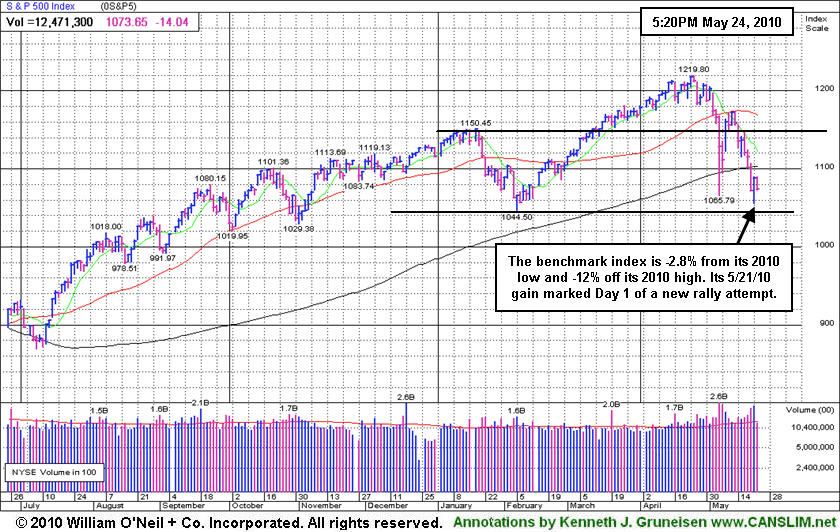
Monday marked Day 2 of a new rally attempt which means that as long as Friday's (Day 1) lows are not breached, the earliest a possible FTD could emerge would be this Wednesday )(Day 4). However, if at anytime, Friday's lows are breached, then the day count will be reset. What does all of this mean for investors? Simple, the market remains in a correction which reiterates the importance of adopting a strong defense stance until a new rally is confirmed. Trade accordingly.
PICTURED: The S&P 500 Index is -2.8% from its 2010 low and -12% off its 2010 high. Its 5/21/10 gain marked Day 1 of a new rally attempt.
|
|
|
 |
Energy and Financial Groups Dove While Defensive Groups Held Up
Kenneth J. Gruneisen - Passed the CAN SLIM® Master's Exam
Energy-related and financial shares were among Monday's biggest decliners as the Oil Services Index ($OSX -3.95%) and Integrated Oil Index ($XOI -2.52%) slumped and Bank Index ($BKX -3.29%) and Broker/Dealer Index ($XBD -2.47%) also erased the bulk of their Friday gains and more. The Semiconductor Index ($SOX -1.88%) and Networking Index ($NWX -0.92%) led the tech sector lower, followed by the Internet Index ($IIX -0.31%) and Biotechnology Index ($BTK -0.12%). Defensive groups held their ground as the Gold & Silver Index ($XAU -0.03%) and Healthcare Index ($HMO +0.04%) finished virtually unchanged.
Charts courtesy www.stockcharts.com
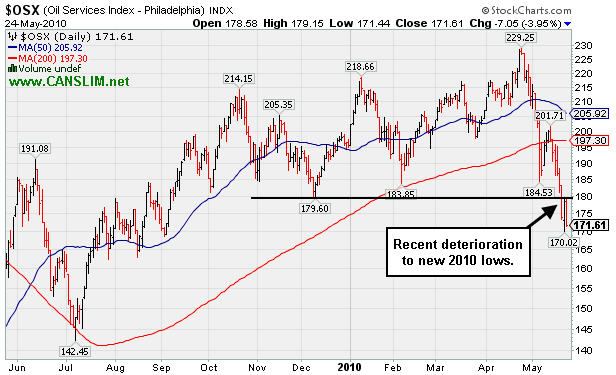
PICTURED: The Oil Services Index ($OSX -3.95%) recently slumped to a new 2010 low.
| Oil Services |
$OSX |
171.61 |
-7.05 |
-3.95% |
-11.96% |
| Healthcare |
$HMO |
1,431.98 |
+0.64 |
+0.04% |
-2.78% |
| Integrated Oil |
$XOI |
940.49 |
-24.32 |
-2.52% |
-11.96% |
| Semiconductor |
$SOX |
342.54 |
-6.57 |
-1.88% |
-4.83% |
| Networking |
$NWX |
236.81 |
-2.19 |
-0.92% |
+2.49% |
| Internet |
$IIX |
232.58 |
-0.72 |
-0.31% |
-0.55% |
| Broker/Dealer |
$XBD |
105.71 |
-2.67 |
-2.47% |
-8.12% |
| Retail |
$RLX |
434.61 |
-1.79 |
-0.41% |
+5.71% |
| Gold & Silver |
$XAU |
166.06 |
-0.05 |
-0.03% |
-1.30% |
| Bank |
$BKX |
48.73 |
-1.66 |
-3.29% |
+14.10% |
| Biotech |
$BTK |
1,039.33 |
-1.23 |
-0.12% |
+10.32% |
|
|
|
 |
Broader Market Weakness Hindering Majority Of Stocks
Kenneth J. Gruneisen - Passed the CAN SLIM® Master's Exam
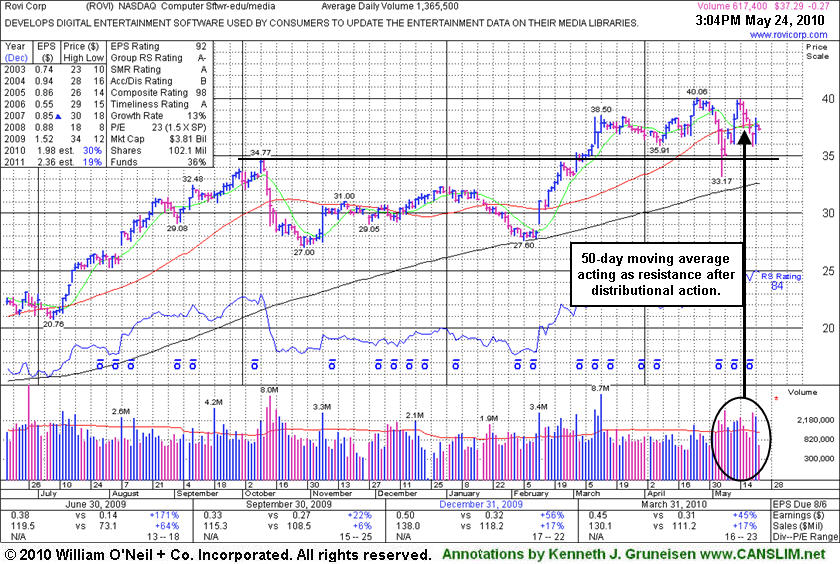
Rovi Corp (ROVI -$0.73 or -1.94% to $36.83) recently endured distributional pressure, and while it is now trading just below its 50-day moving average (DMA) line, it is also consolidating only -7% from its 52-week high without a great deal of resistance due to overhead supply. It makes a good candidate to have on investors' watch list until a new confirmed rally, meanwhile broader market action (M criteria) may be expected to adversely impact 3 out of 4 stocks. Its 50 DMA line may now act as resistance, while a convincing gain above that important short-term average line would help its outlook improve. Its recent chart low ($33.17) defines near-term chart support above its 200 DMA line. Its 4/23/10 gain for a new all-time high helped it clear a fresh base but was noted as it lacked sufficient volume to trigger a proper new technical buy signal. Earlier, ROVI had triggered a technical buy signal with a high-volume gain on 3/02/10 that may have signaled the beginning of a substantial advance, but thus far it made limited progress. Earnings per share increases in 3 of the past 4 quarterly comparisons versus the year ago period showed better than +25% growth.
|
|
|
Color Codes Explained :
Y - Better candidates highlighted by our
staff of experts.
G - Previously featured
in past reports as yellow but may no longer be buyable under the
guidelines.
***Last / Change / Volume data in this table is the closing quote data***
Symbol/Exchange
Company Name
Industry Group |
PRICE |
CHANGE
(%Change) |
Day High |
Volume
(% DAV)
(% 50 day avg vol) |
52 Wk Hi
% From Hi |
Featured
Date |
Price
Featured |
Pivot Featured |
|
Max Buy |
BIDU
-
NASDAQ
Baidu Inc Ads
INTERNET - Internet Information Providers
|
$71.01
|
+0.15
0.22% |
$73.35
|
10,631,612
59.60% of 50 DAV
50 DAV is 17,837,300
|
$82.29
-13.71%
|
1/13/2010
|
$43.13
|
PP = $42.68
|
|
MB = $44.81
|
 Most Recent Note - 5/24/2010 4:04:37 PM
G - Consolidating above its 50 DMA line. A worrisome negative reversal from its all-time high on 5/13/10 followed a 10:1 stock split. It is extended from any sound base.
 >>> The latest Featured Stock Update with an annotated graph appeared on 5/14/2010. Click here. >>> The latest Featured Stock Update with an annotated graph appeared on 5/14/2010. Click here.
View all notes |
Alert me of new notes |
CANSLIM.net Company Profile
|
BPI
-
NYSE
Bridgepoint Education
DIVERSIFIED SERVICES - Education and; Training Services
|
$22.76
|
-0.45
-1.94% |
$23.78
|
441,115
85.65% of 50 DAV
50 DAV is 515,000
|
$27.50
-17.24%
|
4/13/2010
|
$25.59
|
PP = $25.76
|
|
MB = $27.05
|
Most Recent Note - 5/24/2010 4:06:15 PM
G - Quietly consolidating below its 50 DMA line still. Recent lows coincide with old chart highs near $22 as a very important support level to watch.
>>> The latest Featured Stock Update with an annotated graph appeared on 5/7/2010. Click here.
View all notes |
Alert me of new notes |
CANSLIM.net Company Profile
|
BRLI
-
NASDAQ
Bio Reference Labs Inc
HEALTH SERVICES - Medical Laboratories and Researc
|
$22.14
|
+0.05
0.23% |
$22.35
|
162,435
87.33% of 50 DAV
50 DAV is 186,000
|
$24.67
-10.27%
|
2/12/2010
|
$39.02
|
PP = $20.49
|
|
MB = $21.51
|
Most Recent Note - 5/24/2010 4:08:43 PM
G - It would need to rally back above its 50 DMA line for its outlook to improve after distributional action led to another violation of its short-term average last week.
>>> The latest Featured Stock Update with an annotated graph appeared on 5/11/2010. Click here.
View all notes |
Alert me of new notes |
CANSLIM.net Company Profile
|
CRM
-
NYSE
Salesforce.Com Inc
INTERNET - Internet Software and Services
|
$82.19
|
-1.05
-1.26% |
$85.02
|
2,318,277
115.74% of 50 DAV
50 DAV is 2,003,000
|
$89.84
-8.52%
|
3/5/2010
|
$72.28
|
PP = $75.53
|
|
MB = $79.31
|
Most Recent Note - 5/24/2010 4:10:59 PM
G - Holding its ground after a positive reversal on 5/21/10 a sign of great institutional support again near its 50 DMA line. Concerns were raised after Microsoft Corp. recently sued the company for infringing on nine of its patents.
>>> The latest Featured Stock Update with an annotated graph appeared on 5/17/2010. Click here.
View all notes |
Alert me of new notes |
CANSLIM.net Company Profile
|
LL
-
NYSE
Lumber Liquidators Hldgs
RETAIL - Home Improvement Stores
|
$28.17
|
-0.17
-0.60% |
$28.63
|
143,348
38.46% of 50 DAV
50 DAV is 372,700
|
$33.41
-15.68%
|
4/22/2010
|
$29.87
|
PP = $29.03
|
|
MB = $30.48
|
Most Recent Note - 5/24/2010 4:25:33 PM
G - Holding its ground after a positive reversal on 5/21/10, but technically it remains below its 50 DMA line after its slump under its December 2009 highs recently negated the latest breakout.
>>> The latest Featured Stock Update with an annotated graph appeared on 5/19/2010. Click here.
View all notes |
Alert me of new notes |
CANSLIM.net Company Profile
|
Symbol/Exchange
Company Name
Industry Group |
PRICE |
CHANGE
(%Change) |
Day High |
Volume
(% DAV)
(% 50 day avg vol) |
52 Wk Hi
% From Hi |
Featured
Date |
Price
Featured |
Pivot Featured |
|
Max Buy |
LOPE
-
NASDAQ
Grand Canyon Education
DIVERSIFIED SERVICES - Education and; Training Services
|
$25.92
|
-0.07
-0.27% |
$26.35
|
773,306
193.04% of 50 DAV
50 DAV is 400,600
|
$28.46
-8.92%
|
4/13/2010
|
$27.71
|
PP = $27.33
|
|
MB = $28.70
|
Most Recent Note - 5/24/2010 4:26:38 PM
G - Held its ground today after a positive reversal and rally for a close above its 50 DMA line on 5/21/10 were encouraging signs. Its 4/29/10 low of $23.66 is the next important chart support.
>>> The latest Featured Stock Update with an annotated graph appeared on 5/10/2010. Click here.
View all notes |
Alert me of new notes |
CANSLIM.net Company Profile
|
MELI
-
NASDAQ
Mercadolibre Inc
INTERNET - Internet Software and; Services
|
$46.93
|
-1.43
-2.96% |
$48.99
|
617,205
99.47% of 50 DAV
50 DAV is 620,500
|
$55.75
-15.82%
|
5/13/2010
|
$54.21
|
PP = $55.85
|
|
MB = $58.64
|
Most Recent Note - 5/24/2010 4:28:32 PM
G - It has struggled following its 5/13/10 negative reversal and would need to rally back above its 50 DMA line for its outlook to improve. Meanwhile, its 200 DMA and recent lows define important near-term chart support.
>>> The latest Featured Stock Update with an annotated graph appeared on 5/13/2010. Click here.
View all notes |
Alert me of new notes |
CANSLIM.net Company Profile
|
ROVI
-
NASDAQ
Rovi Corp
COMPUTER SOFTWARE andamp; SERVICES - Security Software andamp; Services
|
$36.83
|
-0.73
-1.94% |
$37.70
|
964,828
70.66% of 50 DAV
50 DAV is 1,365,500
|
$40.06
-8.06%
|
4/20/2010
|
$37.62
|
PP = $38.60
|
|
MB = $40.53
|
Most Recent Note - 5/24/2010 4:33:54 PM
G - Loss today on light volume leaves it below its 50 DMA line which may now act as resistance. Consolidating just -8% from its 52-week high. Its recent chart low ($33.17) defines near-term chart support above its 200 DMA line.
>>> The latest Featured Stock Update with an annotated graph appeared on 5/5/2010. Click here.
View all notes |
Alert me of new notes |
CANSLIM.net Company Profile
|
SUMR
-
NASDAQ
Summer Infant Inc
CONSUMER NON-DURABLES - Personal Products
|
$7.75
|
+0.26
3.47% |
$7.78
|
46,607
84.43% of 50 DAV
50 DAV is 55,200
|
$8.21
-5.60%
|
5/4/2010
|
$6.85
|
PP = $7.09
|
|
MB = $7.44
|
Most Recent Note - 5/24/2010 4:36:39 PM
G - Gain today on light volume lifted it well above its "max buy" level for its third best close ever. Recently found prompt support near prior chart highs and its 50 DMA line.
>>> The latest Featured Stock Update with an annotated graph appeared on 5/21/2010. Click here.
View all notes |
Alert me of new notes |
CANSLIM.net Company Profile
|
ULTA
-
NASDAQ
Ulta Salon Cosm & Frag
SPECIALTY RETAIL - Specialty Retail, Other
|
$23.55
|
+0.23
0.99% |
$24.07
|
244,050
57.74% of 50 DAV
50 DAV is 422,700
|
$25.76
-8.58%
|
3/12/2010
|
$22.81
|
PP = $21.72
|
|
MB = $22.81
|
Most Recent Note - 5/24/2010 4:38:56 PM
G - Held its ground today after a positive reversal on 5/21/10 helped it promptly rally back above its 50 DMA line. Recent chart lows define important support to watch now.
>>> The latest Featured Stock Update with an annotated graph appeared on 5/20/2010. Click here.
View all notes |
Alert me of new notes |
CANSLIM.net Company Profile
|
Symbol/Exchange
Company Name
Industry Group |
PRICE |
CHANGE
(%Change) |
Day High |
Volume
(% DAV)
(% 50 day avg vol) |
52 Wk Hi
% From Hi |
Featured
Date |
Price
Featured |
Pivot Featured |
|
Max Buy |
|
|
|
THESE ARE NOT BUY RECOMMENDATIONS!
Comments contained in the body of this report are technical
opinions only. The material herein has been obtained
from sources believed to be reliable and accurate, however,
its accuracy and completeness cannot be guaranteed.
This site is not an investment advisor, hence it does
not endorse or recommend any securities or other investments.
Any recommendation contained in this report may not
be suitable for all investors and it is not to be deemed
an offer or solicitation on our part with respect to
the purchase or sale of any securities. All trademarks,
service marks and trade names appearing in this report
are the property of their respective owners, and are
likewise used for identification purposes only.
This report is a service available
only to active Paid Premium Members.
You may opt-out of receiving report notifications
at any time. Questions or comments may be submitted
by writing to Premium Membership Services 665 S.E. 10 Street, Suite 201 Deerfield Beach, FL 33441-5634 or by calling 1-800-965-8307
or 954-785-1121.
|
|
|


