You are not logged in.
This means you
CAN ONLY VIEW reports that were published prior to Monday, April 14, 2025.
You
MUST UPGRADE YOUR MEMBERSHIP if you want to see any current reports.
AFTER MARKET UPDATE - FRIDAY, MAY 21ST, 2010
Previous After Market Report Next After Market Report >>>
|
|
|
|
DOW |
+125.38 |
10,193.39 |
+1.25% |
|
Volume |
2,301,329,990 |
+8% |
|
Volume |
3,271,242,490 |
-0% |
|
NASDAQ |
+25.03 |
2,229.04 |
+1.14% |
|
Advancers |
2,357 |
74% |
|
Advancers |
1,755 |
62% |
|
S&P 500 |
+16.10 |
1,087.69 |
+1.50% |
|
Decliners |
754 |
24% |
|
Decliners |
955 |
34% |
|
Russell 2000 |
+9.25 |
649.29 |
+1.45% |
|
52 Wk Highs |
11 |
|
|
52 Wk Highs |
10 |
|
|
S&P 600 |
+4.46 |
349.52 |
+1.29% |
|
52 Wk Lows |
101 |
|
|
52 Wk Lows |
140 |
|
|
 |
Major Averages Overcame Early Weakness Friday To Close Higher
Adam Sarhan, Contributing Writer,
Stocks got clobbered this week sending all of the major averages below their respective 200-day moving average (DMA) lines as contagion and economic woes dominated the headlines. A series of options expired on Friday which contributed to higher volume on the NYSE, yet the Nasdaq exchange's volume total was reported below Thursday's total. Volume expanded as the major averages declined this week, which was a clear sign that institutional investors were aggressively dumping stocks. Advancers led decliners by more than a 3-to-1 ratio on the NYSE and by nearly a 2-to-1 ratio on the Nasdaq exchange. New 52-week lows outnumbered new 52-week highs on both major exchanges. Leadership was virtually nonexistent on Friday as there were 0 high-ranked companies from the CANSLIM.net Leaders List that made a new 52-week high and appeared on the CANSLIM.net BreakOuts Page, which matched Thursday's reading. It is difficult for the market to rally without a healthy crop of strong leaders.
On Monday, the major averages closed with modest gains after spending most of the session in the red. Crude oil slid below the psychologically important $70 a barrel level and New York's manufacturing slowed. It is important to note that crude oil is used as a good proxy for the strength of the overall economy. Therefore, the fact that crude has sliced and closed below its longer-term 200-day moving average (DMA) line bodes poorly for the economic recovery. It is also disconcerting to see copper, another proxy for the global recovery, drop and close below its respective 200 DMA line which also bodes poorly for the pro-growth theme. On Tuesday, stocks negatively reversed (opened higher but closed lower) as the Euro plunged to a fresh 4-year low against the US dollar. In a surprise move, Germany's SEC, BaFin, placed a temporary ban on naked short selling of euro bonds, banks and insurers in an attempt to curb the month long decline and ease contagion woes.
On Wednesday, all the major averages undercut their recent lows which effectively ended the latest rally attempt. Economic news was mixed, US consumer prices fell short of expectations which helped allay inflation woes. Elsewhere, the Mortgage Bankers Association (MBA) said foreclosures surged to a new record in the first quarter as uncomfortably high unemployment rates caused homeowners to fall behind on monthly payments. The report also showed that residential foreclosures jumped to +4.63% from +4.58% in the fourth quarter of 2009. Shortly after 2:00PM EST, the minutes of the Federal Reserve's latest meeting were released. Fed officials said they were not in a rush to sell $1.1 trillion of mortgage-backed securities, with a majority of policy makers wanting to wait until they begin raising interest rates before unloading their positions.
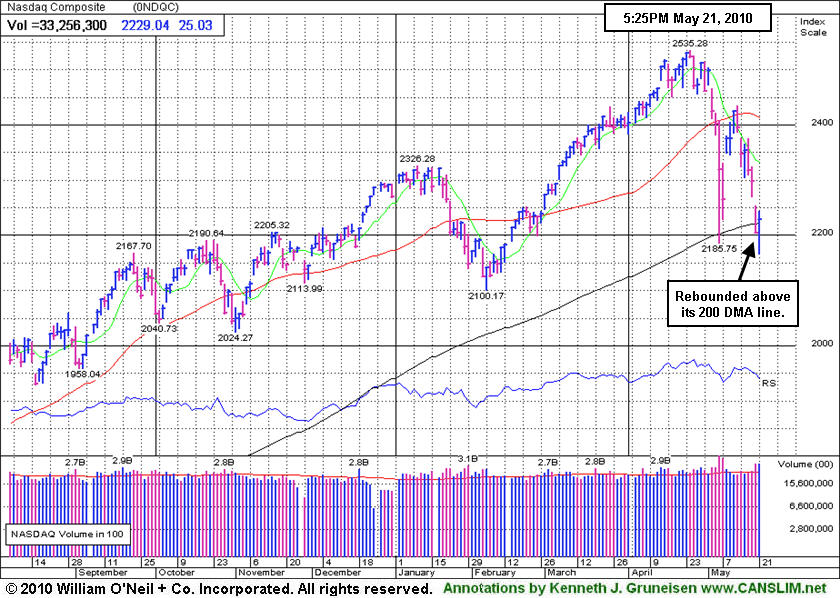
Stocks took a heavy beating on Thursday, sending all the major averages below their respective 200 DMA lines on heavy volume. Stocks ended higher on Friday after the S&P 500, Russell 2000 and Nasdaq Composite all shook out below their May 6, 2010 (flash crash) low. For the week, all the major averages suffered tremendous losses and fell over -10% from their late April highs, which is the first time a pullback of that magnitude has occurred since the March 2009 low. The fact that the market rallied on Friday technically marked Day 1 of a new rally attempt which means the earliest a proper follow-through day (FTD) could occur would be Wednesday, providing Friday's lows are not breached. However, if at anytime, Friday's lows are breached, then the day count will be reset. What does all of this mean for investors? Simple, the market remains in a correction which reiterates the importance of adopting a strong defense stance until a new rally is confirmed. Trade accordingly.
Professional Money Management Services - Free Portfolio Review:
If your portfolio is greater than $100,000 and you would like a free portfolio review, click here to get connected with one of our portfolio managers. ** Serious inquires only, please.
PICTURED: The Nasdaq Composite Index rebounded above its 200-day moving average line with a late afternoon rally on Friday.
|
|
|
 |
Financial Shares Halt Worrisome Slide
Kenneth J. Gruneisen - Passed the CAN SLIM® Master's Exam
Financial shares posted gains on Friday as the Broker/Dealer Index ($XBD +3.12%) and Bank Index ($BKX +3.98%) halted their worrisome downward slides. The Retail Index ($RLX +2.01%) and tech sector rose as the Networking Index ($NWX +2.16%), Semiconductor Index ($SOX +2.50%), and Internet Index ($IIX +1.74%) posted solid gains. Commodity-linked groups were also on the rise as the Gold & Silver Index ($XAU +0.78%), Integrated Oil Index ($XOI +1.44%), and Oil Services Index ($OSX +2.78%) posted gains. Meanwhile, the Biotechnology Index ($BTK -0.49%) and Healthcare Index ($HMO -0.35%) suffered modest losses.
Charts courtesy www.stockcharts.com
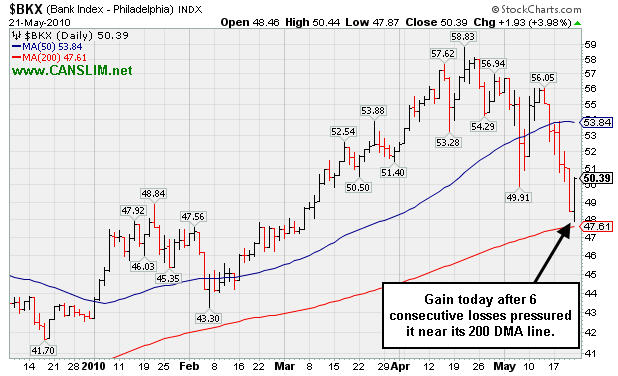
PICTURED: The Bank Index ($BKX +3.98%) posted a gain after 6 consecutive losses pressured it near its 200-day moving average (DMA) line.
Charts courtesy www.stockcharts.com
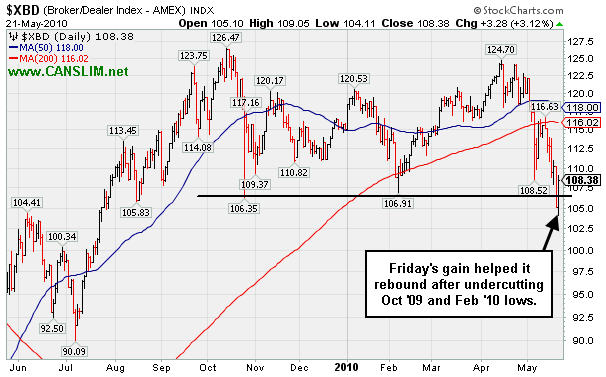
PICTURED: The Broker/Dealer Index ($XBD +3.12%) posted a gain on Friday that helped it rebound after undercutting Oct '09 and Feb '10 lows.
| Oil Services |
$OSX |
178.66 |
+4.84 |
+2.78% |
-8.34% |
| Healthcare |
$HMO |
1,431.34 |
-4.96 |
-0.35% |
-2.82% |
| Integrated Oil |
$XOI |
964.81 |
+13.66 |
+1.44% |
-9.68% |
| Semiconductor |
$SOX |
349.11 |
+8.51 |
+2.50% |
-3.00% |
| Networking |
$NWX |
239.02 |
+5.07 |
+2.17% |
+3.44% |
| Internet |
$IIX |
233.30 |
+4.00 |
+1.74% |
-0.24% |
| Broker/Dealer |
$XBD |
108.40 |
+3.30 |
+3.14% |
-5.78% |
| Retail |
$RLX |
436.40 |
+8.59 |
+2.01% |
+6.15% |
| Gold & Silver |
$XAU |
166.11 |
+1.29 |
+0.78% |
-1.27% |
| Bank |
$BKX |
50.39 |
+1.93 |
+3.98% |
+17.98% |
| Biotech |
$BTK |
1,040.38 |
-5.33 |
-0.51% |
+10.43% |
|
|
|
 |
Positive Reversal Near Chart Support Levels
Kenneth J. Gruneisen - Passed the CAN SLIM® Master's Exam
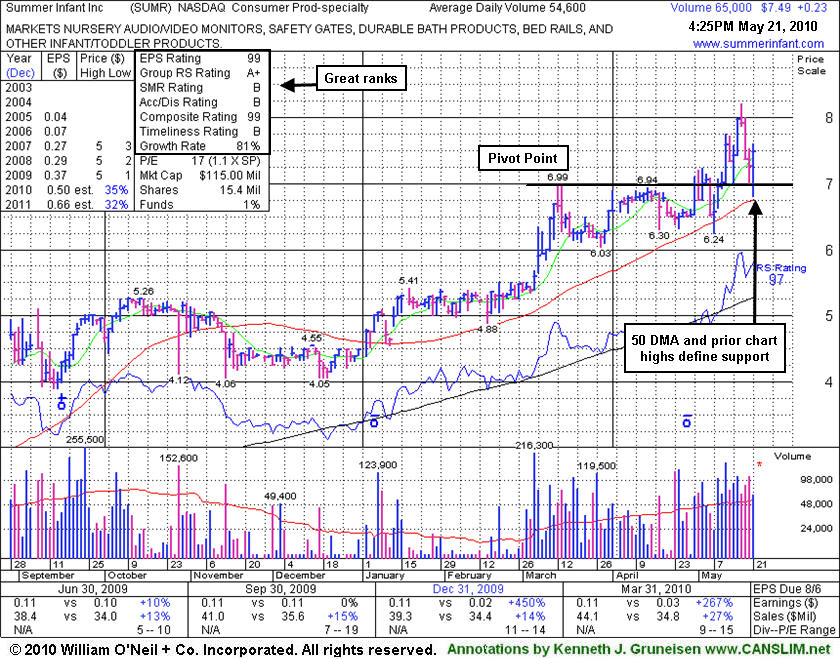
Summer Infant Inc (SUMR +$0.23 or +3.17% or $7.49) finished near its previously cited "max buy" level after early weakness tested support of prior chart highs and its 50-day moving average (DMA) line. The positive reversal and close near its session high was encouraging.
SUMR was featured in the 5/04/10 mid-day report (read here) with notes while - "Inching into new high ground this week on the right side of a 7-week flat base above its 50 DMA line and well above prior chart highs in the $5 area. Color code is yellow with pivot point noted based upon its 3/15/10 high plus ten cents. Quarterly earnings (C criteria) in the 2 latest quarterly comparisons showed great increases while sales revenues growth accelerated to +27% in the period ended Mach 31, 2010. It has a good annual earnings (A criteria) history, and a small supply (S criteria) of only 11.0 million shares in the public float. Technically, a gain and strong close above its pivot point with heavy volume would trigger a buy signal."
Earlier mid-day report appearances included notes (which can be reviewed using the "view all notes" link on any stock) that were critical of the company's prior sales and earnings growth history. Recent quarterly comparisons show sales revenues growth accelerating and big earnings increases (triple digit percentages), plus it has a good annual earnings (A criteria) history. Low-priced stocks are supposed to be avoided under the fact-based system because they are typically riskier candidates, however, when all key criteria are satisfied and market conditions are bullish buying efforts may be justified. Broader market action (M criteria) is normally expected to impact 3 out of 4 stocks, and odds are currently stacked against investors' success until a new rally with a follow-through day from at least one of the major averages confirms that strength is returning to stocks.
|
|
|
Color Codes Explained :
Y - Better candidates highlighted by our
staff of experts.
G - Previously featured
in past reports as yellow but may no longer be buyable under the
guidelines.
***Last / Change / Volume data in this table is the closing quote data***
Symbol/Exchange
Company Name
Industry Group |
PRICE |
CHANGE
(%Change) |
Day High |
Volume
(% DAV)
(% 50 day avg vol) |
52 Wk Hi
% From Hi |
Featured
Date |
Price
Featured |
Pivot Featured |
|
Max Buy |
BIDU
-
NASDAQ
Baidu Inc Ads
INTERNET - Internet Information Providers
|
$70.85
|
+3.27
4.84% |
$71.62
|
20,705,148
116.55% of 50 DAV
50 DAV is 17,764,300
|
$82.29
-13.90%
|
1/13/2010
|
$43.13
|
PP = $42.68
|
|
MB = $44.81
|
 Most Recent Note - 5/21/2010 3:42:58 PM
G - Rallying on higher volume today following 6 consecutive losses after a worrisome negative reversal from its all-time high on 5/13/10. It is extended from any sound base. Do not be confused as the latest Featured Price, PP and MB levels have been adjusted for a recent 10:1 stock split.
 >>> The latest Featured Stock Update with an annotated graph appeared on 5/14/2010. Click here. >>> The latest Featured Stock Update with an annotated graph appeared on 5/14/2010. Click here.
View all notes |
Alert me of new notes |
CANSLIM.net Company Profile
|
BPI
-
NYSE
Bridgepoint Education
DIVERSIFIED SERVICES - Education and; Training Services
|
$23.21
|
+0.45
1.98% |
$24.09
|
651,167
128.54% of 50 DAV
50 DAV is 506,600
|
$27.50
-15.60%
|
4/13/2010
|
$25.59
|
PP = $25.76
|
|
MB = $27.05
|
Most Recent Note - 5/21/2010 3:46:39 PM
G - Still consolidating below its 50 DMA line, its recent lows coincide with old chart highs near $22 as a very important support level to watch.
>>> The latest Featured Stock Update with an annotated graph appeared on 5/7/2010. Click here.
View all notes |
Alert me of new notes |
CANSLIM.net Company Profile
|
BRLI
-
NASDAQ
Bio Reference Labs Inc
HEALTH SERVICES - Medical Laboratories and Researc
|
$22.09
|
+0.24
1.10% |
$22.30
|
187,819
103.03% of 50 DAV
50 DAV is 182,300
|
$24.67
-10.47%
|
2/12/2010
|
$39.02
|
PP = $20.49
|
|
MB = $21.51
|
Most Recent Note - 5/21/2010 3:50:22 PM
G - Distributional pressure this week led to another 50 DMA line violation as its 5/20/10 loss on higher volume raised more concerns.
>>> The latest Featured Stock Update with an annotated graph appeared on 5/11/2010. Click here.
View all notes |
Alert me of new notes |
CANSLIM.net Company Profile
|
CRM
-
NYSE
Salesforce.Com Inc
INTERNET - Internet Software and Services
|
$83.24
|
+4.21
5.33% |
$84.07
|
10,899,023
615.17% of 50 DAV
50 DAV is 1,771,700
|
$89.84
-7.35%
|
3/5/2010
|
$72.28
|
PP = $75.53
|
|
MB = $79.31
|
Most Recent Note - 5/21/2010 3:52:33 PM
G - A positive reversal after gapping down today is a sign of great institutional support again near its 50 DMA line. Concerns were raised this week after Microsoft Corp. sued the company for infringing on nine of its patents.
>>> The latest Featured Stock Update with an annotated graph appeared on 5/17/2010. Click here.
View all notes |
Alert me of new notes |
CANSLIM.net Company Profile
|
LL
-
NYSE
Lumber Liquidators Hldgs
RETAIL - Home Improvement Stores
|
$28.34
|
+1.44
5.35% |
$28.62
|
324,651
87.48% of 50 DAV
50 DAV is 371,100
|
$33.41
-15.18%
|
4/22/2010
|
$29.87
|
PP = $29.03
|
|
MB = $30.48
|
Most Recent Note - 5/21/2010 3:58:27 PM
G - Positive reversal after a gap down today is encouraging, but technically it remains below its 50 DMA line after its slump under its December 2009 highs recently negated the latest breakout.
>>> The latest Featured Stock Update with an annotated graph appeared on 5/19/2010. Click here.
View all notes |
Alert me of new notes |
CANSLIM.net Company Profile
|
Symbol/Exchange
Company Name
Industry Group |
PRICE |
CHANGE
(%Change) |
Day High |
Volume
(% DAV)
(% 50 day avg vol) |
52 Wk Hi
% From Hi |
Featured
Date |
Price
Featured |
Pivot Featured |
|
Max Buy |
LOPE
-
NASDAQ
Grand Canyon Education
DIVERSIFIED SERVICES - Education and; Training Services
|
$25.99
|
+0.69
2.73% |
$26.00
|
1,080,267
288.69% of 50 DAV
50 DAV is 374,200
|
$28.46
-8.68%
|
4/13/2010
|
$27.71
|
PP = $27.33
|
|
MB = $28.70
|
Most Recent Note - 5/21/2010 4:00:34 PM
G - Positive reversal today and rally for a close above its 50 DMA line were very encouraging signs after a small gap down. Its 4/29/10 low of $23.66 is the next important chart support.
>>> The latest Featured Stock Update with an annotated graph appeared on 5/10/2010. Click here.
View all notes |
Alert me of new notes |
CANSLIM.net Company Profile
|
MELI
-
NASDAQ
Mercadolibre Inc
INTERNET - Internet Software and; Services
|
$48.36
|
+2.03
4.38% |
$49.00
|
903,717
151.71% of 50 DAV
50 DAV is 595,700
|
$55.75
-13.26%
|
5/13/2010
|
$54.21
|
PP = $55.85
|
|
MB = $58.64
|
Most Recent Note - 5/21/2010 4:04:23 PM
G - Positive reversal today after a small gap down halted a streak of 6 consecutive losses following its 5/13/10 negative reversal. It would need to rally back above its 50 DMA line for its outlook to improve, meanwhile its 200 DMA and recent lows define important near-term chart support.
>>> The latest Featured Stock Update with an annotated graph appeared on 5/13/2010. Click here.
View all notes |
Alert me of new notes |
CANSLIM.net Company Profile
|
ROVI
-
NASDAQ
Rovi Corp
COMPUTER SOFTWARE andamp; SERVICES - Security Software andamp; Services
|
$37.56
|
+0.68
1.84% |
$38.24
|
2,687,328
194.72% of 50 DAV
50 DAV is 1,380,100
|
$40.06
-6.24%
|
4/20/2010
|
$37.62
|
PP = $38.60
|
|
MB = $40.53
|
Most Recent Note - 5/21/2010 4:11:46 PM
G - Gain today halted a streak of 5 consecutive small losses, closing near its 50 DMA line and only -6.3% from its 52-week high. Its recent chart low ($33.17) defines near-term chart support above its 200 DMA line.
>>> The latest Featured Stock Update with an annotated graph appeared on 5/5/2010. Click here.
View all notes |
Alert me of new notes |
CANSLIM.net Company Profile
|
SUMR
-
NASDAQ
Summer Infant Inc
CONSUMER NON-DURABLES - Personal Products
|
$7.49
|
+0.23
3.17% |
$7.60
|
65,032
119.99% of 50 DAV
50 DAV is 54,200
|
$8.21
-8.77%
|
5/4/2010
|
$6.85
|
PP = $7.09
|
|
MB = $7.44
|
Most Recent Note - 5/21/2010 4:20:06 PM
G - Positive reversal and close today near its session high was encouraging. Finished near its previously cited "max buy" level after early weakness tested support of prior chart highs and its 50 DMA line.
>>> The latest Featured Stock Update with an annotated graph appeared on 5/21/2010. Click here.
View all notes |
Alert me of new notes |
CANSLIM.net Company Profile
|
ULTA
-
NASDAQ
Ulta Salon Cosm & Frag
SPECIALTY RETAIL - Specialty Retail, Other
|
$23.32
|
+1.16
5.23% |
$23.83
|
422,425
99.93% of 50 DAV
50 DAV is 422,700
|
$25.76
-9.47%
|
3/12/2010
|
$22.81
|
PP = $21.72
|
|
MB = $22.81
|
Most Recent Note - 5/21/2010 4:22:01 PM
G - After a small gap down today it positively reversed and promptly rallied back above its 50 DMA line with a gain on higher volume. Recent chart lows define important support to watch now.
>>> The latest Featured Stock Update with an annotated graph appeared on 5/20/2010. Click here.
View all notes |
Alert me of new notes |
CANSLIM.net Company Profile
|
Symbol/Exchange
Company Name
Industry Group |
PRICE |
CHANGE
(%Change) |
Day High |
Volume
(% DAV)
(% 50 day avg vol) |
52 Wk Hi
% From Hi |
Featured
Date |
Price
Featured |
Pivot Featured |
|
Max Buy |
|
|
|
THESE ARE NOT BUY RECOMMENDATIONS!
Comments contained in the body of this report are technical
opinions only. The material herein has been obtained
from sources believed to be reliable and accurate, however,
its accuracy and completeness cannot be guaranteed.
This site is not an investment advisor, hence it does
not endorse or recommend any securities or other investments.
Any recommendation contained in this report may not
be suitable for all investors and it is not to be deemed
an offer or solicitation on our part with respect to
the purchase or sale of any securities. All trademarks,
service marks and trade names appearing in this report
are the property of their respective owners, and are
likewise used for identification purposes only.
This report is a service available
only to active Paid Premium Members.
You may opt-out of receiving report notifications
at any time. Questions or comments may be submitted
by writing to Premium Membership Services 665 S.E. 10 Street, Suite 201 Deerfield Beach, FL 33441-5634 or by calling 1-800-965-8307
or 954-785-1121.
|
|
|


