You are not logged in.
This means you
CAN ONLY VIEW reports that were published prior to Tuesday, July 9, 2024.
You
MUST UPGRADE YOUR MEMBERSHIP if you want to see any current reports.
AFTER MARKET UPDATE - MONDAY, MAY 20TH, 2024
Previous After Market Report Next After Market Report >>>
|
|
|
|
DOW |
-196.82 |
39,806.77 |
-0.49% |
|
Volume |
813,363,177 |
-12% |
|
Volume |
6,937,093,700 |
-28% |
|
NASDAQ |
+108.91 |
16,794.87 |
+0.65% |
|
Advancers |
1,411 |
51% |
|
Advancers |
2,158 |
51% |
|
S&P 500 |
+4.86 |
5,308.13 |
+0.09% |
|
Decliners |
1,366 |
49% |
|
Decliners |
2,082 |
49% |
|
Russell 2000 |
+6.78 |
2,102.50 |
+0.32% |
|
52 Wk Highs |
229 |
|
|
52 Wk Highs |
223 |
|
|
S&P 600 |
-1.03 |
1,337.66 |
-0.08% |
|
52 Wk Lows |
30 |
|
|
52 Wk Lows |
104 |
|
|
 |
Nasdaq Composite Hits New High but Dow Reversed into the Red
Kenneth J. Gruneisen - Passed the CAN SLIM® Master's Exam
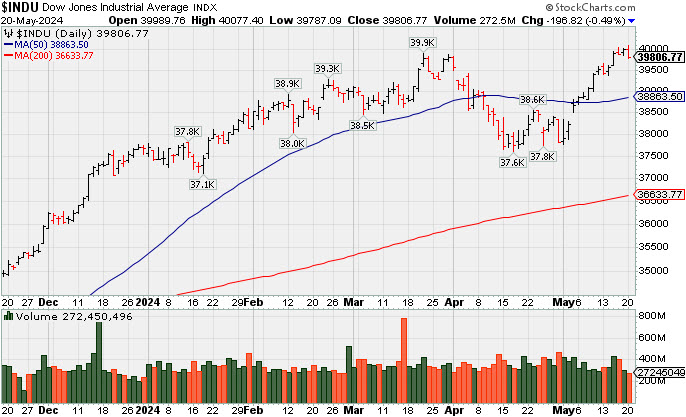
The Nasdaq Composite Index (+0.7%) logged another record closing high while the S&P 500 Index (+0.2%) and Russell 2000 Index (+0.8%) also posted gains, but the Dow Jones Industrial Average (-0.5%) fell nearly 200 points. Volume reported was lighter than the prior session totals on the NYSE and on the Nasdaq exchange. Advancers led decliners by a very narrow margin on the NYSE and on the Nasdaq exchange. There were 97 high-ranked companies from the Leaders List that hit new 52-week highs and were listed on the BreakOuts Page versus 59 on the prior session. New 52-week highs totals expanded and solidly outnumbered new 52-week lows on the NYSE and on the Nasdaq exchange. The major indices are in a confirmed uptrend (M criteria).
PICTURED: The Dow Jones Industrial Average had a "negative reversal" and closed near the session low with a loss after hitting a new all-time high.
NVIDIA (NVDA +2.49%) was a winning standout as several analysts raised their price targets in front of NVDA's earnings report due Wednesday afternoon. Microsoft (MSFT +1.22%) rose after introducing Co Pilot+ PCs and in front of its Build Developers Conference starting Tuesday.
The S&P 500 information technology sector (+1.3%) led while the heavily-weighted financial sector fell -1.2%. A sizable loss in JP Morgan Chase (JPM -4.50%) was in response to CEO Dimon saying at its Investor Day that the company is not expecting to buy back a lot of stock at these levels. The consumer discretionary sector (-0.7%) was the next worst performer due to losses in Amazon.com (AMZN -0.63%) and Tesla (TSLA -1.41%).
The 10-yr note yield settled two basis points higher at 4.44% and the 2-yr note yield rose two basis points to 4.84%. There was no US economic data of note on Monday and none due Tuesday. The Minutes from the April 30-May 1 FOMC meeting and the Existing Home Sales report for April will be released Wednesday. The weekly jobless claims report and New Home Sales report for April will be released Thursday, and the Durable Goods Orders for April will be released Friday.
|
 Kenneth J. Gruneisen started out as a licensed stockbroker in August 1987, a couple of months prior to the historic stock market crash that took the Dow Jones Industrial Average down -22.6% in a single day. He has published daily fact-based fundamental and technical analysis on high-ranked stocks online for two decades. Through FACTBASEDINVESTING.COM, Kenneth provides educational articles, news, market commentary, and other information regarding proven investment systems that work in good times and bad.
Comments contained in the body of this report are technical opinions only and are not necessarily those of Gruneisen Growth Corp. The material herein has been obtained from sources believed to be reliable and accurate, however, its accuracy and completeness cannot be guaranteed. Our firm, employees, and customers may effect transactions, including transactions contrary to any recommendation herein, or have positions in the securities mentioned herein or options with respect thereto. Any recommendation contained in this report may not be suitable for all investors and it is not to be deemed an offer or solicitation on our part with respect to the purchase or sale of any securities. |
|
 |
Gold & Silver Index and Tech Indexes Posted Gains
Kenneth J. Gruneisen - Passed the CAN SLIM® Master's Exam
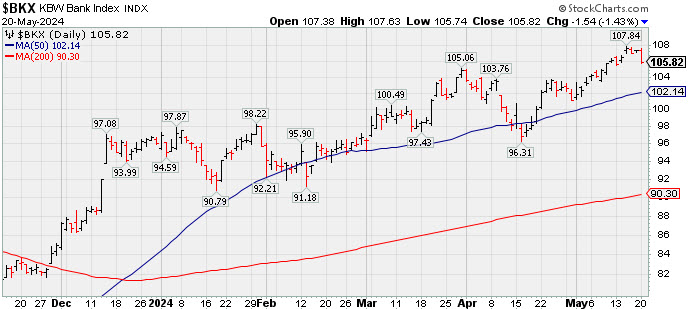
The Retail Index ($RLX -0.88%) and Bank Index ($BKX -1.43%) both lost ground on Monday while the Broker/Dealer Index ($XBD -0.12%) did a better job of holding its ground. The Semiconductor Index ($SOX +2.15%) led the tech sector while the Biotech Index ($BTK +0.70%) and the Networking Index ($NWX +0.46%) both followed with modest gains. Commodity-linked groups had a mostly positive bias as the Gold & Silver Index ($XAU +1.43%) while the Oil Services ($OSX +0.63%) posted a smaller gain but the Integrated Oil Index ($XOI -0.77%) lost ground.
![]() PICTURED: The Bank Index ($BKX -1.43%) is consolidating after recently hitting new 2024 highs.
| Oil Services |
$OSX |
88.63 |
+0.55 |
+0.63% |
+5.66% |
| Integrated Oil |
$XOI |
2,105.90 |
-16.37 |
-0.77% |
+13.07% |
| Semiconductor |
$SOX |
5,090.35 |
+107.33 |
+2.15% |
+21.91% |
| Networking |
$NWX |
816.78 |
+3.74 |
+0.46% |
-1.92% |
| Broker/Dealer |
$XBD |
637.31 |
-0.78 |
-0.12% |
+14.36% |
| Retail |
$RLX |
4,398.58 |
-39.00 |
-0.88% |
+14.02% |
| Gold & Silver |
$XAU |
151.36 |
+2.13 |
+1.43% |
+20.42% |
| Bank |
$BKX |
105.82 |
-1.54 |
-1.43% |
+10.21% |
| Biotech |
$BTK |
5,282.27 |
+36.63 |
+0.70% |
-2.52% |
|
|
|
 |
Strong Finish for Archrock After Highlighted in Mid-Day Report
Kenneth J. Gruneisen - Passed the CAN SLIM® Master's Exam
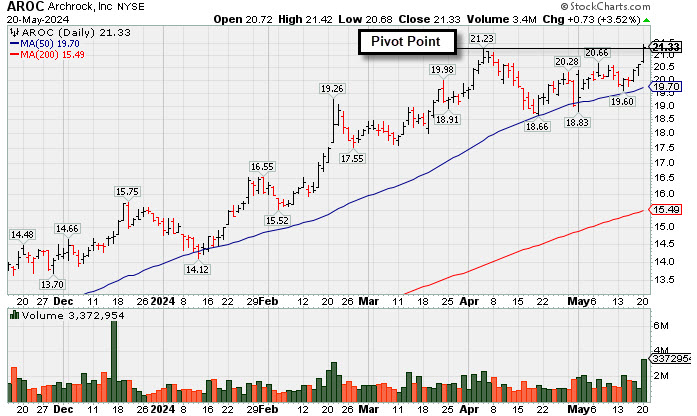
Archrock (AROC +$0.72 or +3.50% to $21.32) finished strong after highlighted in yellow with pivot point cited based on its 4/04/24 high plus 10 cents in the earlier mid-day report (read here). It touched a new high and posted a big gain backed by +144% above average volume. AROC found support above its 50-day moving average (DMA) line during an orderly 6-week flat base. Subsequent gains and a strong close above the pivot point backed by at least +40% above average volume may trigger a technical buy signal.
It has a highest possible Earnings Per Share Rating of 99. Earnings increases have been above the +25% mninimum guideline in quarterly comparisons through Mar '24 versus the year-ago periods. Annual earnings (A criteria) growth has been strong after a loss in FY '20. It hails from the OilandGas-Machinery/Equip group which is currently ranked 48th on the 197 Industryu Groups List (L criteria).
There are 156.3 million shares (S criteria) outstanding. The number of top-rated funds owning its shares rose frm 380 in Jun '23 to 434 in Mar '24, a reassuring sign concerning the I criteria. Its current Up/Down Volume Ratio of 1.7 is an unbiased indication its shares have been under accumulation over the past 50 days.
|
|
|
Color Codes Explained :
Y - Better candidates highlighted by our
staff of experts.
G - Previously featured
in past reports as yellow but may no longer be buyable under the
guidelines.
***Last / Change / Volume data in this table is the closing quote data***
Symbol/Exchange
Company Name
Industry Group |
PRICE |
CHANGE
(%Change) |
Day High |
Volume
(% DAV)
(% 50 day avg vol) |
52 Wk Hi
% From Hi |
Featured
Date |
Price
Featured |
Pivot Featured |
|
Max Buy |
 TDG
-
NYSE
TDG
-
NYSE
TransDigm Group
Aerospace/Defense
|
$1,312.76
|
+20.81
1.61% |
$1,317.01
|
179,423
88.82% of 50 DAV
50 DAV is 202,000
|
$1,330.82
-1.36%
|
4/12/2024
|
$1,224.21
|
PP = $1,246.32
|
|
MB = $1,308.64
|
 Most Recent Note - 5/20/2024 5:19:32 PM
G - Posted a gain today with lighter volume. It is extended from any sound base and its 50 DMA line ($1,238) defines near-term support to watch on pullbacks. Reported Mar '24 quarterly earnings +34% on +21% sales revenues versus the year-ago period.
>>> FEATURED STOCK ARTICLE : Found Support at 50-Day Moving Average Line and Hit New High - 4/30/2024 |
View all notes |
Set NEW NOTE alert |
Company Profile |
SEC
News |
Chart |
Request a new note
C
A
S
I |
USLM
-
NASDAQ
U.S. Lime & Minerals
Bldg-Cement/Concrt/Ag
|
$363.10
|
-1.72
-0.47% |
$370.01
|
23,208
85.96% of 50 DAV
50 DAV is 27,000
|
$378.78
-4.14%
|
2/9/2024
|
$254.68
|
PP = $265.09
|
|
MB = $278.34
|
Most Recent Note - 5/20/2024 5:20:40 PM
G - Pulled back today for a 4th consecutive small loss with below-average volume. Stubbornly holding its ground following noted volume-driven gains into new all-time high territory. Its 50 DMA line ($315) defines important near-term support to watch on pullbacks. Fundamentals remain strong.
>>> FEATURED STOCK ARTICLE : Stubbornly Held Ground and Posted Quiet Gain for Best-Ever Close - 5/14/2024 |
View all notes |
Set NEW NOTE alert |
Company Profile |
SEC
News |
Chart |
Request a new note
C
A
S
I |
CLS
-
NYSE
Celestica
Elec-Contract Mfg
|
$52.67
|
+1.09
2.11% |
$52.89
|
1,376,098
59.75% of 50 DAV
50 DAV is 2,303,000
|
$53.01
-0.64%
|
5/15/2024
|
$51.52
|
PP = $51.22
|
|
MB = $53.78
|
Most Recent Note - 5/20/2024 5:18:46 PM
Y - Posted a gain today with below average volume for a best-ever close. Finished strong after highlighted in yellow in the 5/15/24 mid-day report with pivot point cited based on its 4/04/24 high plus 10 cents after a 6-week flat base. On pullbacks prior highs in the $51 area define initial support to watch above its 50 DMA line ($46.10).
>>> FEATURED STOCK ARTICLE : Strong Breakout After 6-Week Flat Base - 5/15/2024 |
View all notes |
Set NEW NOTE alert |
Company Profile |
SEC
News |
Chart |
Request a new note
C
A
S
I |
AROC
-
NYSE
Archrock
OilandGas-Machinery/Equip
|
$21.32
|
+0.72
3.50% |
$21.42
|
3,372,954
240.07% of 50 DAV
50 DAV is 1,405,000
|
$21.40
-0.37%
|
5/20/2024
|
$21.23
|
PP = $21.50
|
|
MB = $22.58
|
Most Recent Note - 5/20/2024 12:10:55 PM
Y - Color code is changed to yellow with pivot point cited based on its 4/04/24 high plus 10 cents. Found support above its 50 DMA line during an orderly 6-week flat base. Subsequent gains above the pivot point backed by at least +40% above average volume may trigger a technical buy signal. Earnings increases have been above the +25% mninimum guideline in quarterly comparisons through Mar '24 versus the year-ago periods. Annual earnings (A criteria) growth has been strong after a loss in FY '20.
>>> FEATURED STOCK ARTICLE : Strong Finish for Archrock After Highlighted in Mid-Day Report - 5/20/2024 |
View all notes |
Set NEW NOTE alert |
Company Profile |
SEC
News |
Chart |
Request a new note
C
A
S
I |
|
|
|
THESE ARE NOT BUY RECOMMENDATIONS!
Comments contained in the body of this report are technical
opinions only. The material herein has been obtained
from sources believed to be reliable and accurate, however,
its accuracy and completeness cannot be guaranteed.
This site is not an investment advisor, hence it does
not endorse or recommend any securities or other investments.
Any recommendation contained in this report may not
be suitable for all investors and it is not to be deemed
an offer or solicitation on our part with respect to
the purchase or sale of any securities. All trademarks,
service marks and trade names appearing in this report
are the property of their respective owners, and are
likewise used for identification purposes only.
This report is a service available
only to active Paid Premium Members.
You may opt-out of receiving report notifications
at any time. Questions or comments may be submitted
by writing to Premium Membership Services 665 S.E. 10 Street, Suite 201 Deerfield Beach, FL 33441-5634 or by calling 1-800-965-8307
or 954-785-1121.
|
|
|