***Last / Change / Volume data in this table is the closing quote data***
Symbol/Exchange
Company Name
Industry Group |
PRICE |
CHANGE
(%Change) |
Day High |
Volume
(% DAV)
(% 50 day avg vol) |
52 Wk Hi
% From Hi |
Featured
Date |
Price
Featured |
Pivot Featured |
|
Max Buy |
ACN
-
NYSE
Accenture Plc
DIVERSIFIED SERVICES - Business/Management Services
|
$58.39
|
-0.73
-1.23% |
$59.25
|
2,782,024
77.60% of 50 DAV
50 DAV is 3,585,200
|
$65.89
-11.38%
|
3/23/2012
|
$64.13
|
PP = $63.76
|
|
MB = $66.95
|
Most Recent Note - 5/15/2012 8:05:20 PM
G - Halted its slide above its 200 DMA line after triggering technical sell signals while slumping under prior highs in the $62-63 area and violating its 50 DMA line.
>>> The latest Featured Stock Update with an annotated graph appeared on 3/23/2012. Click here.
View all notes |
Alert me of new notes |
CANSLIM.net Company Profile |
SEC |
Zacks Reports |
StockTalk |
News |
Chart |
Request a new note
C
A N
S L
I M


|
ADS
-
NYSE
Alliance Data Sys Corp
COMPUTER SOFTWARE and SERVICES - Information and Delivery Service
|
$121.95
|
-3.77
-3.00% |
$126.01
|
932,652
165.25% of 50 DAV
50 DAV is 564,400
|
$130.66
-6.67%
|
1/17/2012
|
$108.24
|
PP = $107.43
|
|
MB = $112.80
|
Most Recent Note - 5/15/2012 8:34:03 PM
G - Holding its ground near its 50 DMA line. The recent low ($122.70 on 5/09/12) defines important support where a violation would complete a bearish head-and-shoulders pattern and trigger a worrisome technical sell signal. Sub par earnings increases in the 2 latest quarterly reports (Dec '11 and Mar '12) raised fundamental concerns.
>>> The latest Featured Stock Update with an annotated graph appeared on 4/24/2012. Click here.
View all notes |
Alert me of new notes |
CANSLIM.net Company Profile |
SEC |
Zacks Reports |
StockTalk |
News |
Chart |
Request a new note
C
A N
S L
I M
|
ALLT
-
NASDAQ
Allot Communications Ltd
COMPUTER SOFTWARE andamp; SERVICES - Technical andamp; System Software
|
$22.49
|
-1.34
-5.62% |
$24.00
|
981,783
194.49% of 50 DAV
50 DAV is 504,800
|
$26.97
-16.61%
|
3/13/2012
|
$19.72
|
PP = $18.91
|
|
MB = $19.86
|
 Most Recent Note - 5/17/2012 1:24:48 PM
G - Damaging loss today has it trading below its 50 DMA line for the first time since 2/16/12, raising concerns. It has also slumped very near the previously noted low ($22.46 on 4/23/12), where further deterioration may raise more serious concerns and trigger a more worrisome technical sell signal.
>>> The latest Featured Stock Update with an annotated graph appeared on 3/19/2012. Click here.
View all notes |
Alert me of new notes |
CANSLIM.net Company Profile |
SEC |
Zacks Reports |
StockTalk |
News |
Chart |
Request a new note
C
A N
S L
I M
|
ALXN
-
NASDAQ
Alexion Pharmaceuticals
DRUGS - Drug Manufacturers - Other
|
$84.35
|
-2.64
-3.03% |
$87.40
|
1,499,423
120.78% of 50 DAV
50 DAV is 1,241,400
|
$95.01
-11.22%
|
5/1/2012
|
$91.73
|
PP = $95.11
|
|
MB = $99.87
|
Most Recent Note - 5/17/2012 5:44:45 PM
G - Today's loss came with above average volume. A rebound above its 50 DMA line is needed for its outlook to improve. Meanwhile its recent low ($81.28 on 5/07/12) defines the only near-term chart support level above its 200 DMA line.
>>> The latest Featured Stock Update with an annotated graph appeared on 4/16/2012. Click here.
View all notes |
Alert me of new notes |
CANSLIM.net Company Profile |
SEC |
Zacks Reports |
StockTalk |
News |
Chart |
Request a new note
C
A N
S L
I M
|
ARBA
-
NASDAQ
Ariba Inc
INTERNET - Internet Software and Services
|
$36.63
|
-1.47
-3.86% |
$38.10
|
771,548
78.86% of 50 DAV
50 DAV is 978,400
|
$40.45
-9.44%
|
4/27/2012
|
$38.53
|
PP = $37.24
|
|
MB = $39.10
|
Most Recent Note - 5/17/2012 1:28:06 PM
Y - Quietly pulling back near its pivot point today and its color code is changed to yellow. Important near-term support to watch is at prior highs in the $35-37 area, and its 50 DMA line which it is still well above.
>>> The latest Featured Stock Update with an annotated graph appeared on 4/30/2012. Click here.
View all notes |
Alert me of new notes |
CANSLIM.net Company Profile |
SEC |
Zacks Reports |
StockTalk |
News |
Chart |
Request a new note
C
A N
S L
I M
|
Symbol/Exchange
Company Name
Industry Group |
PRICE |
CHANGE
(%Change) |
Day High |
Volume
(% DAV)
(% 50 day avg vol) |
52 Wk Hi
% From Hi |
Featured
Date |
Price
Featured |
Pivot Featured |
|
Max Buy |
CERN
-
NASDAQ
Cerner Corp
COMPUTER SOFTWARE and SERVICES - Healthcare Information Service
|
$78.01
|
-1.21
-1.53% |
$79.65
|
1,165,261
101.36% of 50 DAV
50 DAV is 1,149,600
|
$84.10
-7.24%
|
4/27/2012
|
$77.23
|
PP = $78.63
|
|
MB = $82.56
|
Most Recent Note - 5/15/2012 8:40:27 PM
Y - Color code is changed to yellow while holding its ground above its pivot point and staying near its all-time high after testing near prior chart highs that acted as support. Market weakness (M criteria) is an overriding concern that argues against new buying efforts until a new confirmed rally with a follow-through day by at least one of the major averages.
>>> The latest Featured Stock Update with an annotated graph appeared on 5/1/2012. Click here.
View all notes |
Alert me of new notes |
CANSLIM.net Company Profile |
SEC |
Zacks Reports |
StockTalk |
News |
Chart |
Request a new note
C
A N
S L
I M
|
CMCSA
-
NASDAQ
Comcast Corp Cl A
MEDIA - CATV Systems
|
$28.35
|
-0.50
-1.73% |
$28.86
|
9,677,915
77.00% of 50 DAV
50 DAV is 12,568,900
|
$30.88
-8.18%
|
5/2/2012
|
$30.04
|
PP = $30.51
|
|
MB = $32.04
|
Most Recent Note - 5/15/2012 8:11:13 PM
G - Color code is changed to green after slumping under its 50 DMA line and negating its recent breakout. Prior low ($28.54 on 4/10/12) defines the next important chart support level to watch where a violation may trigger a more worrisome technical sell signal.
>>> The latest Featured Stock Update with an annotated graph appeared on 5/7/2012. Click here.
View all notes |
Alert me of new notes |
CANSLIM.net Company Profile |
SEC |
Zacks Reports |
StockTalk |
News |
Chart |
Request a new note
C
A N
S L
I M
|
COO
-
NYSE
Cooper Companies Inc
HEALTH SERVICES - Medical Instruments and Supplies
|
$85.75
|
-0.90
-1.04% |
$86.99
|
442,858
101.34% of 50 DAV
50 DAV is 437,000
|
$89.31
-3.99%
|
3/9/2012
|
$83.05
|
PP = $81.02
|
|
MB = $85.07
|
Most Recent Note - 5/17/2012 1:36:55 PM
G - Volume totals have still been cooling while consolidating, a sign that few are headed for the exits. It remains perched near its 52-week and all-time highs and above its "max buy" level, slightly extended from its prior base. Prior highs in the $83-84 area define near-term support above its 50 DMA line.
>>> The latest Featured Stock Update with an annotated graph appeared on 3/9/2012. Click here.
View all notes |
Alert me of new notes |
CANSLIM.net Company Profile |
SEC |
Zacks Reports |
StockTalk |
News |
Chart |
Request a new note
C
A N
S L
I M
|
DG
-
NYSE
Dollar General Corp
RETAIL - Discount, Variety Stores
|
$45.99
|
-1.62
-3.40% |
$47.11
|
3,806,493
148.41% of 50 DAV
50 DAV is 2,564,800
|
$48.76
-5.68%
|
5/7/2012
|
$48.51
|
PP = $47.69
|
|
MB = $50.07
|
Most Recent Note - 5/17/2012 5:49:17 PM
G - Down today with above average volume while violating its 50 DMA line triggering a technical sell signal. Color code is changed to green. It has encountered recent distributional pressure while market conditions (M criteria) turned for the worse.
>>> The latest Featured Stock Update with an annotated graph appeared on 5/9/2012. Click here.
View all notes |
Alert me of new notes |
CANSLIM.net Company Profile |
SEC |
Zacks Reports |
StockTalk |
News |
Chart |
Request a new note
C
A N
S L
I M
|
EXPE
-
NASDAQ
Expedia Inc
INTERNET - Internet Information Providers
|
$41.10
|
-1.91
-4.44% |
$43.01
|
4,215,194
95.12% of 50 DAV
50 DAV is 4,431,500
|
$43.92
-6.42%
|
4/27/2012
|
$41.80
|
PP = $35.57
|
|
MB = $37.35
|
Most Recent Note - 5/17/2012 5:30:49 PM
G - Considerable loss today broke a streak of 4 consecutive gains which had lifted it to its best close of 2012. Volume totals have been cooling while consolidating in a tight range after it quickly got extended from its prior base following a "breakaway gap".
>>> The latest Featured Stock Update with an annotated graph appeared on 5/3/2012. Click here.
View all notes |
Alert me of new notes |
CANSLIM.net Company Profile |
SEC |
Zacks Reports |
StockTalk |
News |
Chart |
Request a new note
C
A N
S L
I M
|
Symbol/Exchange
Company Name
Industry Group |
PRICE |
CHANGE
(%Change) |
Day High |
Volume
(% DAV)
(% 50 day avg vol) |
52 Wk Hi
% From Hi |
Featured
Date |
Price
Featured |
Pivot Featured |
|
Max Buy |
GNC
-
NYSE
G N C Holdings Inc
RETAIL - Drug Stores
|
$36.54
|
-2.21
-5.70% |
$38.74
|
2,171,396
103.35% of 50 DAV
50 DAV is 2,101,000
|
$41.95
-12.90%
|
1/19/2012
|
$28.99
|
PP = $29.60
|
|
MB = $31.08
|
Most Recent Note - 5/17/2012 1:44:07 PM
G - Down today on below average volume, trading -9.5% off its all-time high. Important support to watch is at prior highs near $36 above its 50 DMA line. Reported earnings +82% on +23% sales revenues for the quarter ended March 31, 2012 versus the year ago period.
>>> The latest Featured Stock Update with an annotated graph appeared on 4/26/2012. Click here.
View all notes |
Alert me of new notes |
CANSLIM.net Company Profile |
SEC |
Zacks Reports |
StockTalk |
News |
Chart |
Request a new note
C
A N
S L
I M
|
ISRG
-
NASDAQ
Intuitive Surgical Inc
HEALTH SERVICES - Medical Appliances and Equipment
|
$519.09
|
-18.09
-3.37% |
$535.55
|
377,836
129.66% of 50 DAV
50 DAV is 291,400
|
$594.89
-12.74%
|
12/20/2011
|
$442.43
|
PP = $449.16
|
|
MB = $471.62
|
Most Recent Note - 5/17/2012 1:46:16 PM
G - Today's 4th consecutive loss has it slumping further below its 50 DMA line. Its violation of that important short-term moving average has triggered a technical sell signal this week.
>>> The latest Featured Stock Update with an annotated graph appeared on 5/15/2012. Click here.
View all notes |
Alert me of new notes |
CANSLIM.net Company Profile |
SEC |
Zacks Reports |
StockTalk |
News |
Chart |
Request a new note
C
A N
S L
I M
|
LULU
-
NASDAQ
Lululemon Athletica
MANUFACTURING - Textile Manufacturing
|
$66.97
|
-3.96
-5.58% |
$71.21
|
2,954,013
135.77% of 50 DAV
50 DAV is 2,175,700
|
$81.09
-17.41%
|
5/1/2012
|
$76.05
|
PP = $77.23
|
|
MB = $81.09
|
Most Recent Note - 5/17/2012 5:36:29 PM
Today's damaging loss was marked by above average volume while slumping below its prior low ($69.64 on 4/24/12) raising more serious concerns and triggering additional technical sell signals. Based on recent deterioration it will be dropped from the Featured Stocks list tonight.
>>> The latest Featured Stock Update with an annotated graph appeared on 4/12/2012. Click here.
View all notes |
Alert me of new notes |
CANSLIM.net Company Profile |
SEC |
Zacks Reports |
StockTalk |
News |
Chart |
Request a new note
C
A N
S L
I M
|
MA
-
NYSE
Mastercard Inc Cl A
DIVERSIFIED SERVICES - Business/Management Services
|
$398.58
|
-10.79
-2.64% |
$413.80
|
1,196,783
131.07% of 50 DAV
50 DAV is 913,100
|
$466.98
-14.65%
|
3/12/2012
|
$419.86
|
PP = $428.67
|
|
MB = $450.10
|
Most Recent Note - 5/15/2012 8:23:40 PM
G - Ended in the lower third of its intra-day range today while posting a small gain on very light volume. Last week's 50 DMA line violation raised concerns, and its subsequent deterioration below its prior low ($420.75 on 4/23/12) raised even greater concerns.
>>> The latest Featured Stock Update with an annotated graph appeared on 4/11/2012. Click here.
View all notes |
Alert me of new notes |
CANSLIM.net Company Profile |
SEC |
Zacks Reports |
StockTalk |
News |
Chart |
Request a new note
C
A N
S L
I M
|
MG
-
NYSE
Mistras Group Inc
DIVERSIFIED SERVICES - Bulding and Faci;ity Management Services
|
$23.36
|
-0.40
-1.68% |
$23.89
|
124,643
124.39% of 50 DAV
50 DAV is 100,200
|
$26.24
-10.98%
|
3/22/2012
|
$24.96
|
PP = $26.34
|
|
MB = $27.66
|
Most Recent Note - 5/15/2012 8:25:15 PM
G - Consolidating in a tight trading range near its 50 DMA line for more than a month, holding its ground above its 200 DMA line. Previously noted - "A volume-driven gain above its recent chart high ($25.49 on 3/21/12) may help trigger a proper technical buy signal after a new base formation, however no new (lower) pivot point is currently being cited, and it may continue encountering stubborn resistance."
>>> The latest Featured Stock Update with an annotated graph appeared on 4/2/2012. Click here.
View all notes |
Alert me of new notes |
CANSLIM.net Company Profile |
SEC |
Zacks Reports |
StockTalk |
News |
Chart |
Request a new note
C
A N
S L
I M
|
Symbol/Exchange
Company Name
Industry Group |
PRICE |
CHANGE
(%Change) |
Day High |
Volume
(% DAV)
(% 50 day avg vol) |
52 Wk Hi
% From Hi |
Featured
Date |
Price
Featured |
Pivot Featured |
|
Max Buy |
NTES
-
NASDAQ
Netease Inc Adr
INTERNET - Internet Information Providers
|
$60.47
|
+2.78
4.82% |
$63.07
|
2,453,058
369.10% of 50 DAV
50 DAV is 664,600
|
$61.45
-1.59%
|
3/19/2012
|
$56.18
|
PP = $55.10
|
|
MB = $57.86
|
Most Recent Note - 5/17/2012 12:58:39 PM
G - Gapped up today and hit a new 52-week high. It had not formed a sound base pattern, however no overhead supply remains to act as resistance. Reported earnings +33% on +36% sales revenues for the quarter ended March 31, 2012 versus the year ago period and it received an analyst upgrade. Recent lows near the $55 area define important chart support to watch.
>>> The latest Featured Stock Update with an annotated graph appeared on 3/27/2012. Click here.
View all notes |
Alert me of new notes |
CANSLIM.net Company Profile |
SEC |
Zacks Reports |
StockTalk |
News |
Chart |
Request a new note
C
A N
S L
I M
|
RRTS
-
NYSE
Roadrunner Trans Systems
TRANSPORTATION - Air Delivery and Freight Service
|
$17.19
|
-0.73
-4.07% |
$17.90
|
78,086
81.42% of 50 DAV
50 DAV is 95,900
|
$19.06
-9.81%
|
5/3/2012
|
$18.20
|
PP = $18.69
|
|
MB = $19.62
|
Most Recent Note - 5/17/2012 5:47:25 PM
G - Color code is changed to green after today's 4th consecutive loss on light volume violated its 50 DMA line. It encountered resistance and still needs a strong finish above the pivot point cited to clinch a proper technical buy signal.
>>> The latest Featured Stock Update with an annotated graph appeared on 4/9/2012. Click here.
View all notes |
Alert me of new notes |
CANSLIM.net Company Profile |
SEC |
Zacks Reports |
StockTalk |
News |
Chart |
Request a new note
C
A N
S L
I M
|
SHOO
-
NASDAQ
Steven Madden Limited
CONSUMER NON-DURABLES - Textile - Apparel Footwear
|
$38.92
|
-1.67
-4.11% |
$40.56
|
505,193
150.76% of 50 DAV
50 DAV is 335,100
|
$45.70
-14.84%
|
4/27/2012
|
$43.20
|
PP = $45.32
|
|
MB = $47.59
|
Most Recent Note - 5/17/2012 5:49:52 PM
Failing to rebound after recently noted technical deterioration below the recent low ($40.91 on 4/24/12) raised more serious concerns. Earnings growth for the quarter ended March 31, 2012 versus the year ago period was below the +25% minimum guideline. It now faces resistance up through the $45 area due to overhead supply created over the past 3 months while trading at higher levels. It will be dropped from the Featured Stocks list tonight.
>>> The latest Featured Stock Update with an annotated graph appeared on 5/10/2012. Click here.
View all notes |
Alert me of new notes |
CANSLIM.net Company Profile |
SEC |
Zacks Reports |
StockTalk |
News |
Chart |
Request a new note
C
A N
S L
I M
|
SWI
-
NYSE
Solarwinds Inc
COMPUTER SOFTWARE and SERVICES - Application Software
|
$45.05
|
+0.05
0.11% |
$45.30
|
1,373,781
123.90% of 50 DAV
50 DAV is 1,108,800
|
$47.66
-5.48%
|
4/26/2012
|
$45.15
|
PP = $42.32
|
|
MB = $44.44
|
Most Recent Note - 5/15/2012 12:45:23 PM
G - Rallying well above its "max buy" level with today's gain. It triggered a technical buy signal on 4/26/12 as it was featured in the mid-day report and noted - "Reported earnings +43% on +39% sales revenues for the quarter ended March 31, 2012 versus the year ago period. It held its ground stubbornly after violating its 50 DMA line when a damaging loss with above average volume triggered technical sell signals on 4/10/12 and it was dropped from the Featured Stocks list. Earnings below the +25% guideline for the Dec '11 quarter (+21%) had also raised fundamental concerns at that time, however the stock's resilience and impressive acceleration means that 3 of the past 4 quarterly comparisons are now above the minimum guideline concerning the C criteria. Its annual earnings (A criteria) history has been strong."
>>> The latest Featured Stock Update with an annotated graph appeared on 3/16/2012. Click here.
View all notes |
Alert me of new notes |
CANSLIM.net Company Profile |
SEC |
Zacks Reports |
StockTalk |
News |
Chart |
Request a new note
C
A N
S L
I M
|
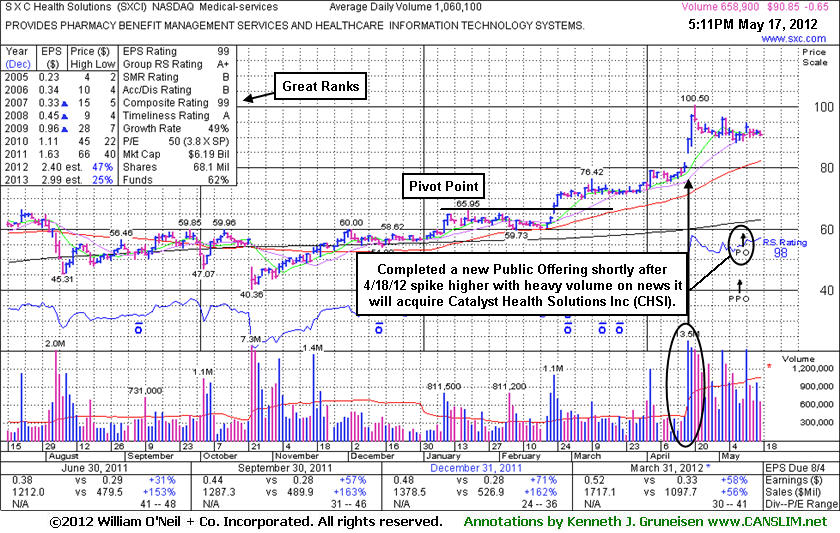
SXCI
-
NASDAQ
S X C Health Solutions
COMPUTER SOFTWARE and SERVICES - Healthcare Information Service
|
$90.85
|
-0.65
-0.71% |
$92.10
|
658,994
62.16% of 50 DAV
50 DAV is 1,060,100
|
$100.50
-9.60%
|
2/23/2012
|
$68.24
|
PP = $66.05
|
|
MB = $69.35
|
Most Recent Note - 5/17/2012 5:28:51 PM
G - Still holding its ground in a tight range after pricing a new Public Offering last week. Consolidating in a tight range since it posted huge volume-driven gains on 4/18 and 4/19 while rallying on M&A news. See latest FSU analysis for more details and a new annotated graph.
>>> The latest Featured Stock Update with an annotated graph appeared on 5/17/2012. Click here.
View all notes |
Alert me of new notes |
CANSLIM.net Company Profile |
SEC |
Zacks Reports |
StockTalk |
News |
Chart |
Request a new note
C
A N
S L
I M
|
Symbol/Exchange
Company Name
Industry Group |
PRICE |
CHANGE
(%Change) |
Day High |
Volume
(% DAV)
(% 50 day avg vol) |
52 Wk Hi
% From Hi |
Featured
Date |
Price
Featured |
Pivot Featured |
|
Max Buy |
TDC
-
NYSE
Teradata Corp
COMPUTER SOFTWARE and SERVICES - Technical and; System Software
|
$66.33
|
-1.52
-2.24% |
$67.91
|
3,104,206
196.07% of 50 DAV
50 DAV is 1,583,200
|
$79.89
-16.97%
|
5/3/2012
|
$79.06
|
PP = $70.73
|
|
MB = $74.27
|
Most Recent Note - 5/17/2012 5:38:38 PM
Suffered another damaging loss today with heavy volume twice its average daily trading total raising more concerns. Prior lows in the $66 area define important chart support level to watch. Based on recent deterioration it will be dropped from the Featured Stocks list tonight.
>>> The latest Featured Stock Update with an annotated graph appeared on 5/8/2012. Click here.
View all notes |
Alert me of new notes |
CANSLIM.net Company Profile |
SEC |
Zacks Reports |
StockTalk |
News |
Chart |
Request a new note
C
A N
S L
I M
|
TDG
-
NYSE
Transdigm Group Inc
AEROSPACE/DEFENSE - Aerospace/Defense Products and; Services
|
$120.24
|
-3.77
-3.04% |
$124.72
|
577,844
125.95% of 50 DAV
50 DAV is 458,800
|
$132.69
-9.38%
|
2/29/2012
|
$120.10
|
PP = $118.93
|
|
MB = $124.88
|
Most Recent Note - 5/17/2012 5:41:34 PM
G - Today's loss with above average volume has it testing support at its 50 DMA line and near prior highs which also define important chart support. Poor market conditions (M criteria) argue against making any new buying efforts until a new confirmed rally by at least one of the major averages with a solid follow-through day.
>>> The latest Featured Stock Update with an annotated graph appeared on 3/30/2012. Click here.
View all notes |
Alert me of new notes |
CANSLIM.net Company Profile |
SEC |
Zacks Reports |
StockTalk |
News |
Chart |
Request a new note
C
A N
S L
I M
|
TNGO
-
NASDAQ
Tangoe Inc
COMPUTER SOFTWARE and SERVICES - Technical and System Software
|
$21.29
|
+0.78
3.80% |
$21.46
|
549,553
85.29% of 50 DAV
50 DAV is 644,300
|
$23.05
-7.64%
|
3/27/2012
|
$19.35
|
PP = $20.00
|
|
MB = $21.00
|
Most Recent Note - 5/16/2012 2:06:03 PM
G - Reversing for a considerable loss and slumping under its "max buy" level today after starting the session with a small gap up. Support to watch is at its 50 DMA line.
>>> The latest Featured Stock Update with an annotated graph appeared on 4/3/2012. Click here.
View all notes |
Alert me of new notes |
CANSLIM.net Company Profile |
SEC |
Zacks Reports |
StockTalk |
News |
Chart |
Request a new note
C
A N
S L
I M
|
TSCO
-
NASDAQ
Tractor Supply Co
SPECIALTY RETAIL - Specialty Retail, Other
|
$95.22
|
-2.78
-2.84% |
$99.46
|
1,303,320
156.40% of 50 DAV
50 DAV is 833,300
|
$101.20
-5.91%
|
5/1/2012
|
$98.38
|
PP = $101.30
|
|
MB = $106.37
|
Most Recent Note - 5/17/2012 5:45:54 PM
Y - Reversed an early gain today and closed near the session low with a loss on heavy volume. Still consolidating above its 50 DMA line which recently acted as support. Volume-driven gains to new highs did not trigger a new (or add-on) technical buy signal in recent weeks. Market conditions (M criteria) also argue against new buying efforts until a new confirmed rally with a solid follow-through day by at least one of the major averages.
>>> The latest Featured Stock Update with an annotated graph appeared on 4/17/2012. Click here.
View all notes |
Alert me of new notes |
CANSLIM.net Company Profile |
SEC |
Zacks Reports |
StockTalk |
News |
Chart |
Request a new note
C
A N
S L
I M
|
UA
-
NYSE
Under Armour Inc Cl A
CONSUMER NON-DURABLES - Textile - Apparel Clothing
|
$90.03
|
-4.70
-4.96% |
$94.86
|
1,172,612
124.71% of 50 DAV
50 DAV is 940,300
|
$102.86
-12.47%
|
2/15/2012
|
$85.77
|
PP = $84.86
|
|
MB = $89.10
|
Most Recent Note - 5/17/2012 5:33:28 PM
G - Down today on higher volume, a sign of distributional pressure, closing a penny off the session low. Concerns were recently raised by weaker fundamentals, its first quarterly earnings increase below the +25% minimum guideline in more than 2 years.
>>> The latest Featured Stock Update with an annotated graph appeared on 4/4/2012. Click here.
View all notes |
Alert me of new notes |
CANSLIM.net Company Profile |
SEC |
Zacks Reports |
StockTalk |
News |
Chart |
Request a new note
C
A N
S L
I M
|
Symbol/Exchange
Company Name
Industry Group |
PRICE |
CHANGE
(%Change) |
Day High |
Volume
(% DAV)
(% 50 day avg vol) |
52 Wk Hi
% From Hi |
Featured
Date |
Price
Featured |
Pivot Featured |
|
Max Buy |
V
-
NYSE
Visa Inc Cl A
DIVERSIFIED SERVICES - Business/Management Services
|
$115.01
|
-2.52
-2.14% |
$118.26
|
4,429,382
129.92% of 50 DAV
50 DAV is 3,409,300
|
$125.35
-8.25%
|
3/12/2012
|
$116.53
|
PP = $119.46
|
|
MB = $125.43
|
Most Recent Note - 5/16/2012 6:43:45 PM
G - Still consolidating below its 50 DMA line which has acted as a resistance level after the technical violation on 5/03/12. The longer it lingers below its 50 DMA line the worse its outlook becomes. See the latest FSU analysis for more details and a new annotated graph.
>>> The latest Featured Stock Update with an annotated graph appeared on 5/16/2012. Click here.
View all notes |
Alert me of new notes |
CANSLIM.net Company Profile |
SEC |
Zacks Reports |
StockTalk |
News |
Chart |
Request a new note
C
A N
S L
I M
|
VSI
-
NYSE
Vitamin Shoppe Inc
SPECIALTY RETAIL - Specialty Retail, Other
|
$49.02
|
-3.82
-7.23% |
$52.32
|
959,876
208.22% of 50 DAV
50 DAV is 461,000
|
$55.29
-11.34%
|
4/25/2012
|
$47.77
|
PP = $48.46
|
|
MB = $50.88
|
Most Recent Note - 5/17/2012 1:55:12 PM
G - Gapped down today for a 5th consecutive loss since a negative reversal at its 52-week high. It has slumped below its "max buy" level, however broader market weakness (M criteria) is an overriding concern which argues against any new buying efforts until a new rally is confirmed with a solid follow-through day by at least one of the major averages.
>>> The latest Featured Stock Update with an annotated graph appeared on 4/25/2012. Click here.
View all notes |
Alert me of new notes |
CANSLIM.net Company Profile |
SEC |
Zacks Reports |
StockTalk |
News |
Chart |
Request a new note
C
A N
S L
I M
|
WFM
-
NASDAQ
Whole Foods Market Inc
RETAIL - Grocery Stores
|
$83.96
|
-2.51
-2.90% |
$86.83
|
1,746,280
112.89% of 50 DAV
50 DAV is 1,546,900
|
$91.50
-8.24%
|
5/3/2012
|
$90.28
|
PP = $86.45
|
|
MB = $90.77
|
Most Recent Note - 5/17/2012 5:52:19 PM
G - Violated its 50 DMA line today with its 4th consecutive loss, triggering a technical sell signal. Color code is changed to green. The weak close below its old high close ($85.97 on 3/13/12) completely negated the latest breakout and raised more serious concerns. It stalled following its considerable "breakaway gap" on 5/03/12, meanwhile the broader market (M criteria) fell into the latest correction.
>>> The latest Featured Stock Update with an annotated graph appeared on 5/11/2012. Click here.
View all notes |
Alert me of new notes |
CANSLIM.net Company Profile |
SEC |
Zacks Reports |
StockTalk |
News |
Chart |
Request a new note
C
A N
S L
I M
|