You are not logged in.
This means you
CAN ONLY VIEW reports that were published prior to Monday, April 14, 2025.
You
MUST UPGRADE YOUR MEMBERSHIP if you want to see any current reports.
AFTER MARKET UPDATE - MONDAY, MAY 17TH, 2010
Previous After Market Report Next After Market Report >>>
|
|
|
|
DOW |
+5.67 |
10,625.83 |
+0.05% |
|
Volume |
1,441,496,230 |
-5% |
|
Volume |
2,319,207,530 |
-8% |
|
NASDAQ |
+7.38 |
2,354.23 |
+0.31% |
|
Advancers |
1,244 |
39% |
|
Advancers |
1,314 |
46% |
|
S&P 500 |
+1.26 |
1,136.94 |
+0.11% |
|
Decliners |
1,845 |
58% |
|
Decliners |
1,415 |
50% |
|
Russell 2000 |
+1.73 |
695.71 |
+0.25% |
|
52 Wk Highs |
30 |
|
|
52 Wk Highs |
41 |
|
|
S&P 600 |
+2.19 |
374.19 |
+0.59% |
|
52 Wk Lows |
25 |
|
|
52 Wk Lows |
53 |
|
|
 |
Afternoon Gains Erased Mid-Day Losses
Adam Sarhan, Contributing Writer,
The major averages closed higher after spending most of the session in the red as crude oil slid below the psychologically important $70 a barrel level and New York's manufacturing slowed. Volume totals were reported lower on the Nasdaq and the NYSE compared to Friday's total which was not an encouraging sign. Decliners led advancers by about a 3-to-2 ratio on the NYSE and by a small margin on the Nasdaq exchange. New 52-week highs outnumbered new 52-week lows on the NYSE but trailed new lows on the Nasdaq exchange. There were 7 high-ranked companies from the CANSLIM.net Leaders List that made a new 52-week high and appeared on the CANSLIM.net BreakOuts Page, higher than the 3 issues that appeared on the prior session.
All but one of the 39 energy companies in the benchmark S&P 500 Index fell after crude oil dipped below $70 a barrel for the first time in three months. BP Plc (BP -0.64%) finally enjoyed some success after the company inserted a one mile pipe into the oil leak. The pipe will pump oil and gas to an oil tanker, 5,000 feet above the leak, which will temporarily collect and store it before the oil is transferred, using a different vessel, to an oil storage facility on land. It is important to note that crude oil is used as a good proxy for the strength of the overall economy. Therefore, the fact that crude has sliced and closed below its longer-term 200-day moving average (DMA) line bodes poorly for the economic recovery. It is also disconcerting to see copper, another proxy for the global recovery, drop and close below its respective 200 DMA line on Monday.
European finance ministers met in Brussels to discuss their plans on reducing their nations' wild deficits and aid them in balancing their budgets. Spain and Portugal have already announced budget cuts which are designed to reduce their ballooning debt. Meanwhile, the euro positively reversed, opened lower and closed higher, after a violent 5-day sell off. Remember that over the past 4 consecutive weeks the euro has fallen sharply and is currently due for an "oversold bounce" of some sort.
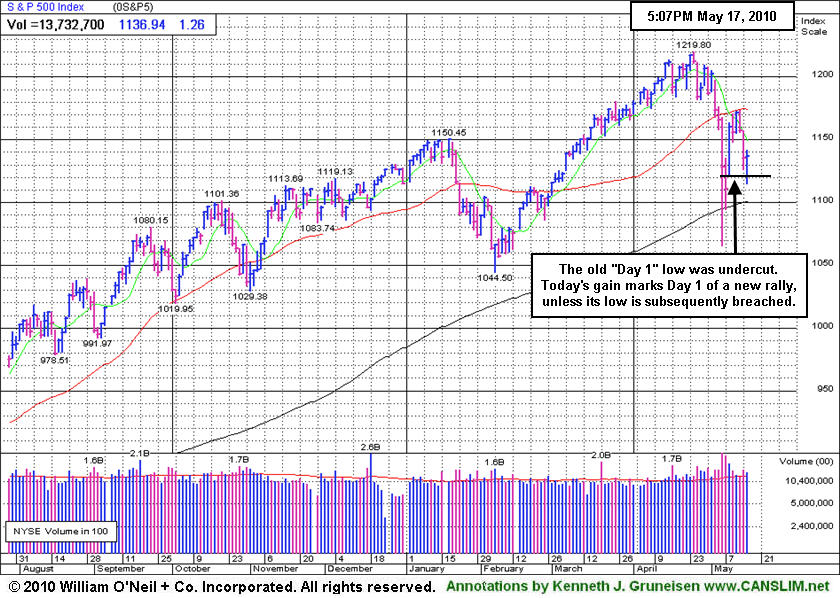
The NYSE Composite Index closed below its 200 DMA line for the second straight session which is not a healthy sign. Furthermore, the S&P 500 and the Nasdaq Composite indexes have each undercut last Monday's lows which means the day count has been reset for those indexes. The fact that the Nasdaq Composite and S&P 500 Index closed higher means that they marked Day 1 of a new rally attempt and the earliest a possible FTD can emerge for either index would be Thursday. However, the Dow Jones Industrial Average has yet to violate last Monday's low, which means that it just finished Day 6 of its current rally attempt and the window for a proper FTD remains open (unless its 5/10/10 low of 10,386 is breached). What does all of this mean for investors? Simple, the market is in a correction which reiterates the importance of adopting a defense stance until a new rally is confirmed. Trade accordingly.
Professional Money Management Services - Free Portfolio Review:
If your portfolio is greater than $100,000 and you would like a free portfolio review, click here to get connected with one of our portfolio managers. ** Serious inquires only, please.
PICTURED: The S&P 500 Index began a new rally attempt by finishing with a gain after early losses undercut its prior "Day 1" low, resetting the day count.
|
|
|
 |
Tech Sector Rose While Commodity-linked Groups Fell
Kenneth J. Gruneisen - Passed the CAN SLIM® Master's Exam
Tech sector strength helped the Nasdaq Composite Index out-pace its peers on Monday as the Semiconductor Index ($SOX +1.56%), Networking Index ($NWX +1.10%), Biotechnology Index ($BTK +0.63%),and Internet Index ($IIX +0.56%) posted small gains. Financial shares ended with a slightly negative bias as the Broker/Dealer Index ($XBD -0.14%) and Bank Index ($BKX -0.11%) edged lower, meanwhile the Healthcare Index ($HMO +0.12%) and Retail Index ($RLX +0.18%) inched higher. Commodity-linked groups clearly lagged as the Gold & Silver Index ($XAU -2.09%), Oil Services Index ($OSX -1.62%), and Integrated Oil Index ($XOI -0.72%) finished the session in the red.
Charts courtesy www.stockcharts.com
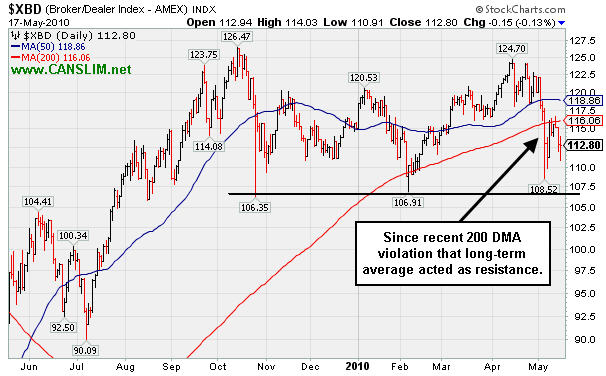
PICTURED: The Broker/Dealer Index ($XBD -0.14%) has encountered resistance at its long-term 200-day moving average (DMA) line since slumping considerably in early May. Weakness in the Bank Index led to a 50 DMA breach which was illustrated in Friday's IGW section (read here). Further deterioration in the financial group would not bode well for the broader market's latest rally attempt, as the financial group has long been recognized as a very important leading indicator.
| Oil Services |
$OSX |
190.19 |
-3.14 |
-1.62% |
-2.43% |
| Healthcare |
$HMO |
1,505.37 |
+1.84 |
+0.12% |
+2.20% |
| Integrated Oil |
$XOI |
1,000.51 |
-7.25 |
-0.72% |
-6.34% |
| Semiconductor |
$SOX |
359.39 |
+5.53 |
+1.56% |
-0.14% |
| Networking |
$NWX |
251.65 |
+2.73 |
+1.10% |
+8.91% |
| Internet |
$IIX |
244.91 |
+1.36 |
+0.56% |
+4.72% |
| Broker/Dealer |
$XBD |
112.79 |
-0.16 |
-0.14% |
-1.97% |
| Retail |
$RLX |
455.67 |
+0.84 |
+0.18% |
+10.84% |
| Gold & Silver |
$XAU |
179.96 |
-3.84 |
-2.09% |
+6.96% |
| Bank |
$BKX |
53.22 |
-0.06 |
-0.11% |
+24.61% |
| Biotech |
$BTK |
1,092.42 |
+6.80 |
+0.63% |
+15.95% |
|
|
|
 |
Time Needed To See If New Base-On-Base Pattern Forms
Kenneth J. Gruneisen - Passed the CAN SLIM® Master's Exam
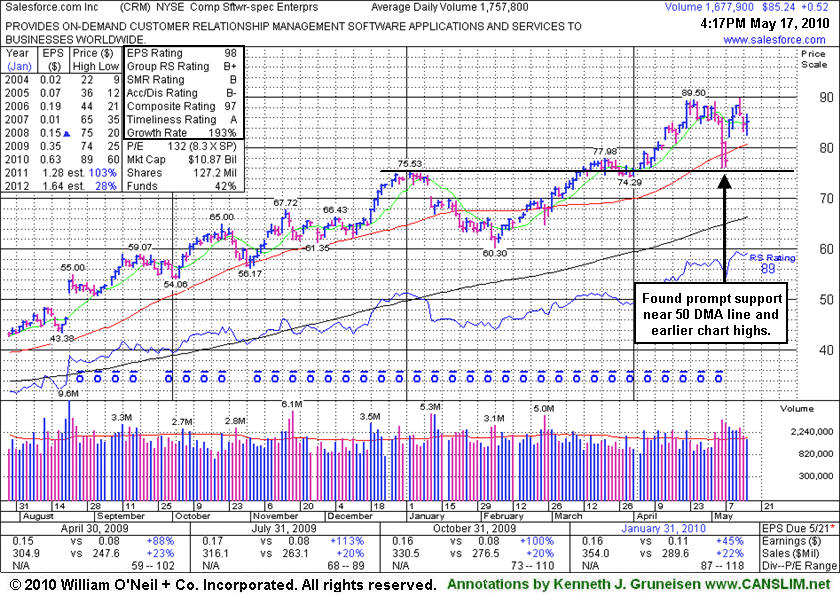
Salesforce.com, Inc. (CRM +$0.52 or +0.61% to $85.24) is holding its ground above its 50-day moving average (DMA) line following a negative reversal after reaching a new all-time high on 5/13/10. Its gap up on 5/10/10 promptly repaired a brief violation of its 50 DMA line, a sign of great institutional support, however more time is needed to see if it may form a more reliable base-on-base pattern. The current market (M criteria) conditions have been calling for investors to lock in gains and raise cash. Caution is advised until a new rally with follow-through-day from one of the major indices confirms a healthier market environment, as the current market correction could last longer and cause more technical damage.
New (or add-on) buying efforts might be considered appropriate under the investment system guidelines when at some future point this high-ranked Computer Software - Enterprise firm eventually forms a new sound base. It has traded up +80.56% since featured in a Stock Bulletin on 8/16/09 under the headline "Forces Have Been Favorable For Software Services Firm." The increase in institutional (I criteria) ownership has been encouraging in the past, however the number of top-rated funds owning its shares fell from 325 in Dec '09 to 309 in Mar '10.
|
|
|
Color Codes Explained :
Y - Better candidates highlighted by our
staff of experts.
G - Previously featured
in past reports as yellow but may no longer be buyable under the
guidelines.
***Last / Change / Volume data in this table is the closing quote data***
Symbol/Exchange
Company Name
Industry Group |
PRICE |
CHANGE
(%Change) |
Day High |
Volume
(% DAV)
(% 50 day avg vol) |
52 Wk Hi
% From Hi |
Featured
Date |
Price
Featured |
Pivot Featured |
|
Max Buy |
BIDU
-
NASDAQ
Baidu Inc Ads
INTERNET - Internet Information Providers
|
$73.18
|
-0.80
-1.08% |
$75.10
|
15,378,132
86.52% of 50 DAV
50 DAV is 17,775,100
|
$82.29
-11.07%
|
1/13/2010
|
$431.25
|
PP = $426.75
|
|
MB = $448.09
|
Most Recent Note - 5/14/2010 2:04:24 PM
G - Gapped down today after a worrisome negative reversal from its all-time high on the prior session. It is extended from any sound base following a big gap up gain on 5/12/10 as a 10:1 stock split occurred. Last week's loss broke a 13 week winning streak. Prior notes mentioned its small supply of shares as a factor that might contribute to more climactic gains. It is clear of resistance due to overhead supply.
 >>> The latest Featured Stock Update with an annotated graph appeared on 5/14/2010. Click here. >>> The latest Featured Stock Update with an annotated graph appeared on 5/14/2010. Click here.
View all notes |
Alert me of new notes |
CANSLIM.net Company Profile
|
BPI
-
NYSE
Bridgepoint Education
DIVERSIFIED SERVICES - Education and; Training Services
|
$24.25
|
+0.33
1.38% |
$25.46
|
1,177,482
241.19% of 50 DAV
50 DAV is 488,200
|
$27.50
-11.82%
|
4/13/2010
|
$25.59
|
PP = $25.76
|
|
MB = $27.05
|
 Most Recent Note - 5/17/2010 4:02:25 PM
G - Late-afternoon rebound led to an impressive positive reversal today, a sign of prompt support arriving after early losses below its 50 DMA line technically violated prior chart lows.
>>> The latest Featured Stock Update with an annotated graph appeared on 5/7/2010. Click here.
View all notes |
Alert me of new notes |
CANSLIM.net Company Profile
|
BRLI
-
NASDAQ
Bio Reference Labs Inc
HEALTH SERVICES - Medical Laboratories and Researc
|
$24.04
|
+0.02
0.08% |
$24.66
|
277,564
148.11% of 50 DAV
50 DAV is 187,400
|
$24.67
-2.57%
|
2/12/2010
|
$39.02
|
PP = $20.49
|
|
MB = $21.51
|
Most Recent Note - 5/14/2010 2:16:20 PM
G - Perched near all-time highs today after rallying steadily since a gap up on 5/10/10. Promptly rallied back after violations of its 50 DMA line and 3/26/10 low triggered technical sell signals.
>>> The latest Featured Stock Update with an annotated graph appeared on 5/11/2010. Click here.
View all notes |
Alert me of new notes |
CANSLIM.net Company Profile
|
CISG
-
NASDAQ
Cninsure Inc Ads
INSURANCE - Insurance Brokers
|
$25.88
|
-1.15
-4.25% |
$27.31
|
249,949
100.83% of 50 DAV
50 DAV is 247,900
|
$28.62
-9.57%
|
3/3/2010
|
$24.38
|
PP = $23.10
|
|
MB = $24.26
|
Most Recent Note - 5/17/2010 2:41:04 PM
G - Today's considerable weakness has it again slumping below its 50 DMA line, hurting its outlook. It may be forming a new base-on-base type pattern.
>>> The latest Featured Stock Update with an annotated graph appeared on 5/12/2010. Click here.
View all notes |
Alert me of new notes |
CANSLIM.net Company Profile
|
CRM
-
NYSE
Salesforce.Com Inc
INTERNET - Internet Software and Services
|
$85.24
|
+0.52
0.61% |
$86.78
|
1,677,458
95.43% of 50 DAV
50 DAV is 1,757,800
|
$89.84
-5.12%
|
3/5/2010
|
$72.28
|
PP = $75.53
|
|
MB = $79.31
|
Most Recent Note - 5/17/2010 4:13:32 PM
G - Holding its ground near all-time highs with no overhead supply to act as resistance. Its gap up on 5/10/10 promptly repaired a brief violation of its 50 DMA line, a sign of great institutional support.
>>> The latest Featured Stock Update with an annotated graph appeared on 5/17/2010. Click here.
View all notes |
Alert me of new notes |
CANSLIM.net Company Profile
|
Symbol/Exchange
Company Name
Industry Group |
PRICE |
CHANGE
(%Change) |
Day High |
Volume
(% DAV)
(% 50 day avg vol) |
52 Wk Hi
% From Hi |
Featured
Date |
Price
Featured |
Pivot Featured |
|
Max Buy |
LL
-
NYSE
Lumber Liquidators Hldgs
RETAIL - Home Improvement Stores
|
$29.80
|
+0.07
0.24% |
$30.26
|
329,857
87.17% of 50 DAV
50 DAV is 378,400
|
$33.41
-10.81%
|
4/22/2010
|
$29.87
|
PP = $29.03
|
|
MB = $30.48
|
Most Recent Note - 5/14/2010 2:22:47 PM
G - Gapped down today after a negative reversal with light volume on the prior session. Found support above its 50 DMA line and promptly rebounded back above its December 2009 highs.
>>> The latest Featured Stock Update with an annotated graph appeared on 4/26/2010. Click here.
View all notes |
Alert me of new notes |
CANSLIM.net Company Profile
|
LOPE
-
NASDAQ
Grand Canyon Education
DIVERSIFIED SERVICES - Education and; Training Services
|
$25.15
|
+0.89
3.67% |
$25.37
|
594,456
161.01% of 50 DAV
50 DAV is 369,200
|
$28.46
-11.63%
|
4/13/2010
|
$27.71
|
PP = $27.33
|
|
MB = $28.70
|
Most Recent Note - 5/17/2010 4:07:31 PM
G - Gain today with near average volume. Its 4/29/10 low of $23.66 is the next important chart support. Meanwhile, its 50 DMA line has recently been acting as resistance.
>>> The latest Featured Stock Update with an annotated graph appeared on 5/10/2010. Click here.
View all notes |
Alert me of new notes |
CANSLIM.net Company Profile
|
MELI
-
NASDAQ
Mercadolibre Inc
INTERNET - Internet Software and; Services
|
$49.91
|
-1.37
-2.67% |
$52.00
|
652,226
111.74% of 50 DAV
50 DAV is 583,700
|
$55.75
-10.48%
|
5/13/2010
|
$54.21
|
PP = $55.85
|
|
MB = $58.64
|
Most Recent Note - 5/17/2010 3:54:59 PM
G - Pulling back near its 50 DMA line today, its color code is changed to green with its 3rd consecutive loss following a recent negative reversal.
>>> The latest Featured Stock Update with an annotated graph appeared on 5/13/2010. Click here.
View all notes |
Alert me of new notes |
CANSLIM.net Company Profile
|
ROVI
-
NASDAQ
Rovi Corp
COMPUTER SOFTWARE andamp; SERVICES - Security Software andamp; Services
|
$38.65
|
-0.78
-1.98% |
$39.75
|
1,679,877
124.25% of 50 DAV
50 DAV is 1,352,000
|
$40.06
-3.52%
|
4/20/2010
|
$37.62
|
PP = $38.60
|
|
MB = $40.53
|
Most Recent Note - 5/17/2010 4:10:39 PM
G - Hovering near its 52-week high, clear of virtually all chart resistance while consolidating just above its 50 DMA line. Its recent chart low ($33.17) defines near-term chart support above its 200 DMA line.
>>> The latest Featured Stock Update with an annotated graph appeared on 5/5/2010. Click here.
View all notes |
Alert me of new notes |
CANSLIM.net Company Profile
|
SIRO
-
NASDAQ
Sirona Dental Systems
HEALTH SERVICES - Medical Instruments andamp; Supplies
|
$38.30
|
-0.24
-0.62% |
$39.13
|
685,668
109.30% of 50 DAV
50 DAV is 627,300
|
$43.45
-11.85%
|
2/16/2010
|
$36.43
|
PP = $36.15
|
|
MB = $37.96
|
Most Recent Note - 5/14/2010 3:08:12 PM
G - Gapped down for a small loss today on light volume while sinking below its 50 DMA line which is acting as resistance. On 5/05/10 it endured heavy distributional pressure after reporting +231% earnings on +15% sales revenues for the quarter ended March 31, 2010 versus the year ago period.
>>> The latest Featured Stock Update with an annotated graph appeared on 4/22/2010. Click here.
View all notes |
Alert me of new notes |
CANSLIM.net Company Profile
|
Symbol/Exchange
Company Name
Industry Group |
PRICE |
CHANGE
(%Change) |
Day High |
Volume
(% DAV)
(% 50 day avg vol) |
52 Wk Hi
% From Hi |
Featured
Date |
Price
Featured |
Pivot Featured |
|
Max Buy |
SUMR
-
NASDAQ
Summer Infant Inc
CONSUMER NON-DURABLES - Personal Products
|
$7.98
|
+0.55
7.40% |
$7.98
|
109,927
214.70% of 50 DAV
50 DAV is 51,200
|
$7.75
2.97%
|
5/4/2010
|
$6.85
|
PP = $7.09
|
|
MB = $7.44
|
Most Recent Note - 5/17/2010 1:01:30 PM
G - Hit a new 52-week high today, and its color code is changed to green after rallying well above its "max buy" level. Prior chart highs may now act as a support level. Considerable gain on 5/12/10 helped it rally above its pivot point for a new 52-week high with volume more than triple its average daily trading total triggering a technical buy signal. Disciplined investors will remain cautious until a follow-through-day confirms the market's (M criteria) new rally effort.
>>> The latest Featured Stock Update with an annotated graph appeared on 5/4/2010. Click here.
View all notes |
Alert me of new notes |
CANSLIM.net Company Profile
|
ULTA
-
NASDAQ
Ulta Salon Cosm & Frag
SPECIALTY RETAIL - Specialty Retail, Other
|
$23.76
|
+0.02
0.08% |
$24.75
|
693,890
160.70% of 50 DAV
50 DAV is 431,800
|
$25.76
-7.76%
|
3/12/2010
|
$22.81
|
PP = $21.72
|
|
MB = $22.81
|
Most Recent Note - 5/14/2010 3:14:07 PM
G - Down on lighter volume today following a negative reversal on 5/13/10 with higher volume. This week it rallied back above its 50 DMA line and January low, showing prompt and encouraging signs of support.
>>> The latest Featured Stock Update with an annotated graph appeared on 4/30/2010. Click here.
View all notes |
Alert me of new notes |
CANSLIM.net Company Profile
|
VIT
-
NYSE
Vanceinfo Tech Inc Ads
COMPUTER SOFTWARE and SERVICES - Business Software and Services
|
$21.70
|
-0.76
-3.38% |
$22.56
|
623,029
78.45% of 50 DAV
50 DAV is 794,200
|
$26.48
-18.05%
|
4/9/2010
|
$23.79
|
PP = $23.95
|
|
MB = $25.15
|
Most Recent Note - 5/17/2010 3:16:22 PM
G - Down again today, it has failed to find support since a gap down on 5/13/10 and violation of its 50 DMA line. Recent lows in the $20 area define near-term chart support above its 200 DMA line.
>>> The latest Featured Stock Update with an annotated graph appeared on 5/6/2010. Click here.
View all notes |
Alert me of new notes |
CANSLIM.net Company Profile
|
|
|
|
THESE ARE NOT BUY RECOMMENDATIONS!
Comments contained in the body of this report are technical
opinions only. The material herein has been obtained
from sources believed to be reliable and accurate, however,
its accuracy and completeness cannot be guaranteed.
This site is not an investment advisor, hence it does
not endorse or recommend any securities or other investments.
Any recommendation contained in this report may not
be suitable for all investors and it is not to be deemed
an offer or solicitation on our part with respect to
the purchase or sale of any securities. All trademarks,
service marks and trade names appearing in this report
are the property of their respective owners, and are
likewise used for identification purposes only.
This report is a service available
only to active Paid Premium Members.
You may opt-out of receiving report notifications
at any time. Questions or comments may be submitted
by writing to Premium Membership Services 665 S.E. 10 Street, Suite 201 Deerfield Beach, FL 33441-5634 or by calling 1-800-965-8307
or 954-785-1121.
|
|
|


