You are not logged in.
This means you
CAN ONLY VIEW reports that were published prior to Tuesday, July 9, 2024.
You
MUST UPGRADE YOUR MEMBERSHIP if you want to see any current reports.
AFTER MARKET UPDATE - THURSDAY, MAY 16TH, 2024
Previous After Market Report Next After Market Report >>>
|
|
|
|
DOW |
-38.62 |
39,869.38 |
-0.10% |
|
Volume |
945,561,526 |
-4% |
|
Volume |
12,506,873,900 |
+45% |
|
NASDAQ |
-44.07 |
16,698.32 |
-0.26% |
|
Advancers |
1,256 |
46% |
|
Advancers |
2,015 |
48% |
|
S&P 500 |
-11.05 |
5,297.10 |
-0.21% |
|
Decliners |
1,489 |
54% |
|
Decliners |
2,208 |
52% |
|
Russell 2000 |
-13.21 |
2,096.25 |
-0.63% |
|
52 Wk Highs |
186 |
|
|
52 Wk Highs |
184 |
|
|
S&P 600 |
-4.91 |
1,340.80 |
-0.36% |
|
52 Wk Lows |
18 |
|
|
52 Wk Lows |
59 |
|
|
 |
Indices Reverse to End Lower After Surge to New All-Time Highs
Kenneth J. Gruneisen - Passed the CAN SLIM® Master's Exam
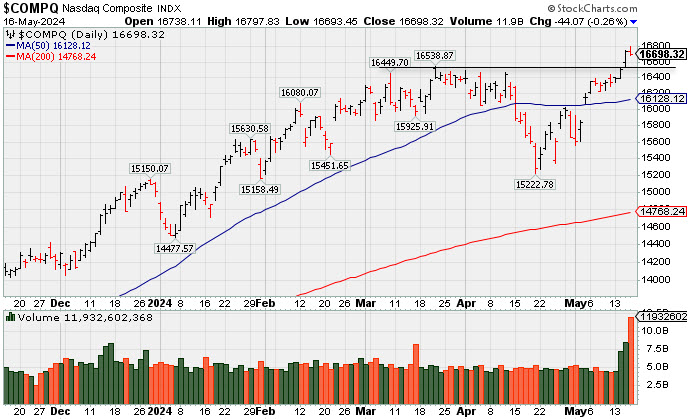
The major indices extended further into record territory on Thursday and the Dow Jones Industrial Average traded above 40,000 for the first time, but all indices closed with modest losses after early gains faded. Volume reported was mixed, lighter than the prior session total on the NYSE and higher on the Nasdaq exchange. Breadth had a slightly negative bias as decliners led advancers by a narrow margin on the NYSE and on the Nasdaq exchange. Leadership remained healthy as there were 89 high-ranked companies from the Leaders List that hit new 52-week highs and were listed on the BreakOuts Page versus 115 on the prior session. New 52-week highs totals contracted but still solidly outnumbered new 52-week lows on the NYSE and on the Nasdaq exchange. The major indices are in a confirmed uptrend (M criteria).
PICTURED: The Nasdaq Composite Index paused and churned heavier volume after hitting a new all-time highs with volume-driven gains.
Ten of the 11 S&P 500 sectors registered declines, but none fell more than -0.8%. The consumer discretionary sector was the worst performer, dropping 0.8%, followed by the materials sector, which closed 0.7% lower. The S&P 500 consumer staples sector was alone in positive territory at the close, showing a 1.5% gain. A sizable gain in shares of Walmart (WMT +6.99%) following impressive earnings results and outlook. Fellow Dow component Cisco (CSCO -2.68%) fell following its earnings news.
Thursday's economic data included weekly jobless claims below slowdown-like levels and housing starts weaker-than-expected April. April import-export prices, the May Philadelphia Fed Index, and April industrial production were reported without any drastic surprises. The 10-yr note yield settled two basis points higher at 4.38% and the 2-yr note yield settled five basis points higher at 4.79%.
|
 Kenneth J. Gruneisen started out as a licensed stockbroker in August 1987, a couple of months prior to the historic stock market crash that took the Dow Jones Industrial Average down -22.6% in a single day. He has published daily fact-based fundamental and technical analysis on high-ranked stocks online for two decades. Through FACTBASEDINVESTING.COM, Kenneth provides educational articles, news, market commentary, and other information regarding proven investment systems that work in good times and bad.
Comments contained in the body of this report are technical opinions only and are not necessarily those of Gruneisen Growth Corp. The material herein has been obtained from sources believed to be reliable and accurate, however, its accuracy and completeness cannot be guaranteed. Our firm, employees, and customers may effect transactions, including transactions contrary to any recommendation herein, or have positions in the securities mentioned herein or options with respect thereto. Any recommendation contained in this report may not be suitable for all investors and it is not to be deemed an offer or solicitation on our part with respect to the purchase or sale of any securities. |
|
 |
Retail, Commodity, and Financial Indexes Fell
Kenneth J. Gruneisen - Passed the CAN SLIM® Master's Exam
The Bank Index ($BKX -0.63%) and the Broker/Dealer Index ($XBD -0.59%) both were outpaced to the downside by the Retail Index ($RLX -1.17%). The Semiconductor Index ($SOX -0.55%) and the Biotech Index ($BTK -0.30%) both edged lower. Commodity-linked groups had a negative bias as the Gold & Silver Index ($XAU -0.59%), Oil Services ($OSX -0.21%), and the Integrated Oil Index ($XOI -0.59%) ended unanimously lower.
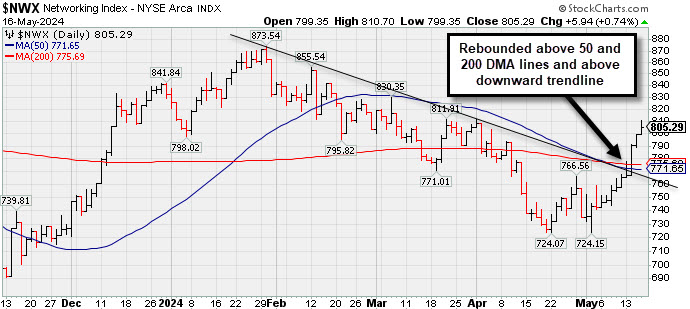
![]() PICTURED: The Networking Index ($NWX +0.74%) rebounded further above its 50-day and 200-day moving average (DMA) lines and above a multi-month downward trendline with an impressive spurt of 11 gains in the prior 12 sessions.
| Oil Services |
$OSX |
87.48 |
-0.19 |
-0.21% |
+4.30% |
| Integrated Oil |
$XOI |
2,088.00 |
-12.42 |
-0.59% |
+12.11% |
| Semiconductor |
$SOX |
5,017.54 |
-27.54 |
-0.55% |
+20.17% |
| Networking |
$NWX |
805.29 |
+5.94 |
+0.74% |
-3.30% |
| Broker/Dealer |
$XBD |
631.71 |
-3.73 |
-0.59% |
+13.35% |
| Retail |
$RLX |
4,416.26 |
-52.06 |
-1.17% |
+13.80% |
| Gold & Silver |
$XAU |
143.82 |
-0.86 |
-0.59% |
+14.42% |
| Bank |
$BKX |
106.96 |
-0.68 |
-0.63% |
+11.39% |
| Biotech |
$BTK |
5,263.04 |
-16.03 |
-0.30% |
-2.87% |
|
|
|
 |
Featured Stocks
Kenneth J. Gruneisen - Passed the CAN SLIM® Master's Exam
|
|
|
Color Codes Explained :
Y - Better candidates highlighted by our
staff of experts.
G - Previously featured
in past reports as yellow but may no longer be buyable under the
guidelines.
***Last / Change / Volume data in this table is the closing quote data***
Symbol/Exchange
Company Name
Industry Group |
PRICE |
CHANGE
(%Change) |
Day High |
Volume
(% DAV)
(% 50 day avg vol) |
52 Wk Hi
% From Hi |
Featured
Date |
Price
Featured |
Pivot Featured |
|
Max Buy |
 AXON
-
NASDAQ
AXON
-
NASDAQ
Axon Enterprise
Security/Sfty
|
$290.44
|
-3.51
-1.19% |
$294.16
|
536,283
107.69% of 50 DAV
50 DAV is 498,000
|
$329.87
-11.95%
|
4/5/2024
|
$309.90
|
PP = $325.73
|
|
MB = $342.02
|
 Most Recent Note - 5/16/2024 11:03:26 PM
It will be dropped today after 7 consecutive losses undercutting the prior low. A rebound above the 50 DMA line ($309) is needed for its outlook to improve. Reported Mar '24 quarterly earnings +31% on +34% sales revenues versus the year-ago period. Fundamentals remain strong.
>>> FEATURED STOCK ARTICLE : Found Support Near 50-Day Moving Average After Recent Stall - 4/29/2024 |
View all notes |
Set NEW NOTE alert |
Company Profile |
SEC
News |
Chart |
Request a new note
C
A
S
I |
TDG
-
NYSE
TransDigm Group
Aerospace/Defense
|
$1,286.32
|
-2.88
-0.22% |
$1,295.55
|
251,269
125.01% of 50 DAV
50 DAV is 201,000
|
$1,330.82
-3.34%
|
4/12/2024
|
$1,224.21
|
PP = $1,246.32
|
|
MB = $1,308.64
|
Most Recent Note - 5/16/2024 11:07:15 PM
G - It is extended from any sound base and its 50 DMA line ($1,233) defines near-term support to watch on pullbacks. Reported Mar '24 quarterly earnings +34% on +21% sales revenues versus the year-ago period.
>>> FEATURED STOCK ARTICLE : Found Support at 50-Day Moving Average Line and Hit New High - 4/30/2024 |
View all notes |
Set NEW NOTE alert |
Company Profile |
SEC
News |
Chart |
Request a new note
C
A
S
I |
USLM
-
NASDAQ
U.S. Lime & Minerals
Bldg-Cement/Concrt/Ag
|
$367.43
|
-5.66
-1.52% |
$374.92
|
20,161
74.67% of 50 DAV
50 DAV is 27,000
|
$378.78
-3.00%
|
2/9/2024
|
$254.68
|
PP = $265.09
|
|
MB = $278.34
|
Most Recent Note - 5/16/2024 11:01:10 PM
G - Pulled back today with lighter volume. Stubbornly holding its ground following noted volume-driven gains into new all-time high territory. Its 50 DMA line ($312) defines important near-term support to watch on pullbacks. Fundamentals remain strong.
>>> FEATURED STOCK ARTICLE : Stubbornly Held Ground and Posted Quiet Gain for Best-Ever Close - 5/14/2024 |
View all notes |
Set NEW NOTE alert |
Company Profile |
SEC
News |
Chart |
Request a new note
C
A
S
I |
CLS
-
NYSE
Celestica
Elec-Contract Mfg
|
$52.42
|
+0.36
0.69% |
$53.01
|
3,265,420
142.84% of 50 DAV
50 DAV is 2,286,000
|
$52.46
-0.08%
|
5/15/2024
|
$51.52
|
PP = $51.22
|
|
MB = $53.78
|
Most Recent Note - 5/16/2024 11:06:30 PM
Y - Hit another new all-time high with above average volume behind today's 3rd consecutive gain. Finished strong after highlighted in yellow in the 5/15/24 mid-day report with pivot point cited based on its 4/04/24 high plus 10 cents after a 6-week flat base. On pullbacks prior highs in the $51 area define initial support to watch above its 50 DMA line. See the latest FSU analysis for more details and an annotated graph.
>>> FEATURED STOCK ARTICLE : Strong Breakout After 6-Week Flat Base - 5/15/2024 |
View all notes |
Set NEW NOTE alert |
Company Profile |
SEC
News |
Chart |
Request a new note
C
A
S
I |
|
|
|
THESE ARE NOT BUY RECOMMENDATIONS!
Comments contained in the body of this report are technical
opinions only. The material herein has been obtained
from sources believed to be reliable and accurate, however,
its accuracy and completeness cannot be guaranteed.
This site is not an investment advisor, hence it does
not endorse or recommend any securities or other investments.
Any recommendation contained in this report may not
be suitable for all investors and it is not to be deemed
an offer or solicitation on our part with respect to
the purchase or sale of any securities. All trademarks,
service marks and trade names appearing in this report
are the property of their respective owners, and are
likewise used for identification purposes only.
This report is a service available
only to active Paid Premium Members.
You may opt-out of receiving report notifications
at any time. Questions or comments may be submitted
by writing to Premium Membership Services 665 S.E. 10 Street, Suite 201 Deerfield Beach, FL 33441-5634 or by calling 1-800-965-8307
or 954-785-1121.
|
|
|