You are not logged in.
This means you
CAN ONLY VIEW reports that were published prior to Monday, April 14, 2025.
You
MUST UPGRADE YOUR MEMBERSHIP if you want to see any current reports.
AFTER MARKET UPDATE - THURSDAY, MAY 16TH, 2013
Previous After Market Report Next After Market Report >>>
|
|
|
|
DOW |
-42.47 |
15,233.22 |
-0.28% |
|
Volume |
684,383,770 |
-8% |
|
Volume |
1,870,232,310 |
+6% |
|
NASDAQ |
-6.38 |
3,465.24 |
-0.18% |
|
Advancers |
1,191 |
38% |
|
Advancers |
1,065 |
41% |
|
S&P 500 |
-8.31 |
1,650.47 |
-0.50% |
|
Decliners |
1,827 |
58% |
|
Decliners |
1,418 |
55% |
|
Russell 2000 |
-3.20 |
985.34 |
-0.32% |
|
52 Wk Highs |
382 |
|
|
52 Wk Highs |
240 |
|
|
S&P 600 |
-2.39 |
553.62 |
-0.43% |
|
52 Wk Lows |
33 |
|
|
52 Wk Lows |
29 |
|
|
 |
Major Averages Pulled Back For Small Losses With Mixed Volume Totals
Kenneth J. Gruneisen - Passed the CAN SLIM® Master's Exam
On Thursday the major indices ended with small losses. The volume totals were reported mixed, lighter than the prior session total on the NYSE while slightly higher on the Nasdaq exchange. Decliners led advancers by a 3-2 margin on the NYSE and by 7-5 margin on the Nasdaq exchange. There were 104 high-ranked companies from the CANSLIM.net Leaders List making new 52-week highs and appearing on the CANSLIM.net BreakOuts Page, down from the prior session total of 149 stocks. The new 52-week highs totals contracted yet new highs still easily outnumbered new 52-week lows on both the NYSE and the Nasdaq exchange. There were gains for only 3 of the 15 high-ranked companies currently included on the Featured Stocks Page, a disconcertingly negative bias versus that of the broader market.
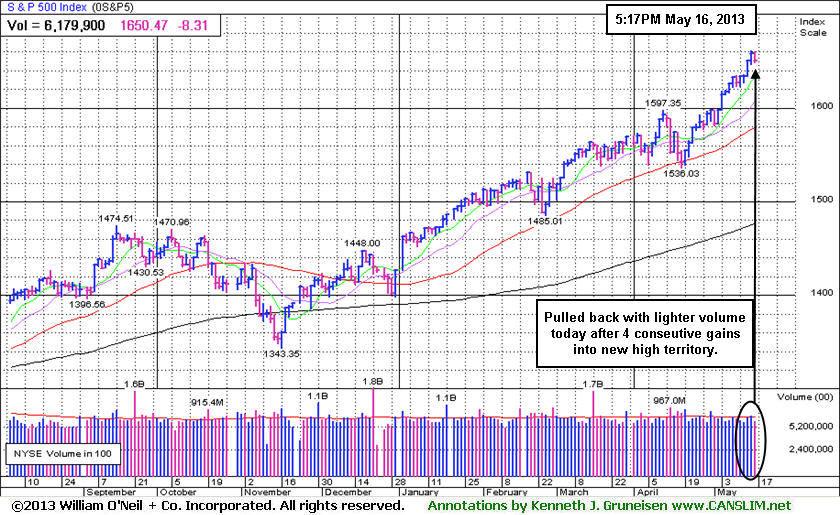
The major averages traded in a narrow range following this latest economic releases. Before the open, reports showed weekly jobless claims increased 32,000 to the highest level in over a month of 360,000 and housing starts fell -16.5% in April, down the most since February 2011. In addition, the Philly Fed Index turned negative in May for the first time since February. A reading on inflation remained tame as prices paid by consumers fell -0.4% last month due to a decline in gas prices.
Nine of the 10 S&P 500 sectors declined. Health Care was one of the worst performing groups, led by Celgene Corp's (CELG -4.74%) large loss. Consumer Staples were pressured by weakness in Wal-Mart Stores Inc (WMT -1.70%) after the company forecasted a disappointing second quarter profit. Technology was the sole group to finish higher thanks to Cisco Systems Inc (CSCO +12.62%) following its better-than-expected profit tally and encouraging outlook. Tech remained in focus after the closing bell with Dell Inc's (DELL -0.15%) first quarter earnings report.
In fixed-income, Treasuries were higher for the second time in six sessions. The 10-year note was up 17/32 to yield 1.88% and the 30-year bond gained over a full point to yield 3.09%.
The market (M criteria) saw an expansion in leadership (stocks hitting new 52-week highs) that reassured investors a confirmed uptrend is at hand. Watch for new stocks featured in the CANSLIM.net Mid-Day BreakOuts Report. Action-worthy leaders are covered on an ongoing basis with the latest notes and additional resource links included on the Featured Stocks Page. Watch for an announcement via email concerning the next WEBCAST. The webcast will also be available via an updated link highlighted at the top of the Premium Member Homepage.
PICTURED: The S&P 500 Index pulled back on lighter volume from its all-time high after 4 consecutive gains. The benchmark index is up +15.7% year-to-date. The indices' rally to new highs confirmed the market's uptrend which means odds are favorable for new buying efforts in stocks meeting all of the fact-based investment system's key criteria.
|
 Kenneth J. Gruneisen started out as a licensed stockbroker in August 1987, a couple of months prior to the historic stock market crash that took the Dow Jones Industrial Average down -22.6% in a single day. He has published daily fact-based fundamental and technical analysis on high-ranked stocks online for two decades. Through FACTBASEDINVESTING.COM, Kenneth provides educational articles, news, market commentary, and other information regarding proven investment systems that work in good times and bad.
Comments contained in the body of this report are technical opinions only and are not necessarily those of Gruneisen Growth Corp. The material herein has been obtained from sources believed to be reliable and accurate, however, its accuracy and completeness cannot be guaranteed. Our firm, employees, and customers may effect transactions, including transactions contrary to any recommendation herein, or have positions in the securities mentioned herein or options with respect thereto. Any recommendation contained in this report may not be suitable for all investors and it is not to be deemed an offer or solicitation on our part with respect to the purchase or sale of any securities. |
|
 |
Networking Index Boosted by Cisco's Big Gain on Mostly Negative Session
Kenneth J. Gruneisen - Passed the CAN SLIM® Master's Exam
Weakness in the Retail Index ($RLX -1.05%) finally ended a 10 session winning streak. Financial groups also weigned on the major averages as they backpedaled while the Broker/Dealer Index ($XBD -0.68%) and the Bank Index ($BKX -0.58%) ended modestly lower. The Healthcare Index ($HMO -0.62%) fell and energy-related shares also slumped as the Integrated Oil Index ($XOI -0.55%) and the Oil Services Index ($OSX -0.11%) ended with small losses. The Biotechnology Index ($BTK -1.98%) and Semiconductor Index ($SOX -0.76%) lost ground, meanwhile the Internet Index ($IIX +0.13%) and the Gold & Silver Index ($XAU +0.35%) eked out small gains.
Charts courtesy www.stockcharts.com
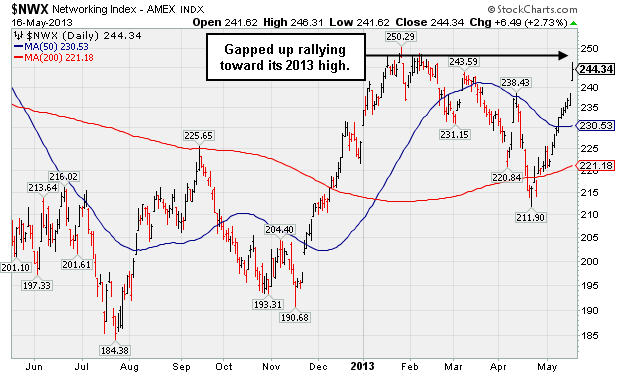
PICTURED: The Networking Index ($NWX +2.73%) was a standout gainer thanks to strength from Cisco Systems Inc (CSCO +12.62%) following its better-than-expected profit tally and encouraging outlook.
| Oil Services |
$OSX |
259.36 |
-0.28 |
-0.11% |
+17.81% |
| Healthcare |
$HMO |
3,104.28 |
-19.27 |
-0.62% |
+23.47% |
| Integrated Oil |
$XOI |
1,385.63 |
-7.71 |
-0.55% |
+11.58% |
| Semiconductor |
$SOX |
464.28 |
-3.54 |
-0.76% |
+20.89% |
| Networking |
$NWX |
244.34 |
+6.49 |
+2.73% |
+7.85% |
| Internet |
$IIX |
384.50 |
+0.48 |
+0.13% |
+17.58% |
| Broker/Dealer |
$XBD |
122.96 |
-0.84 |
-0.68% |
+30.36% |
| Retail |
$RLX |
785.83 |
-8.37 |
-1.05% |
+20.33% |
| Gold & Silver |
$XAU |
100.79 |
+0.35 |
+0.35% |
-39.14% |
| Bank |
$BKX |
60.16 |
-0.35 |
-0.58% |
+17.32% |
| Biotech |
$BTK |
1,995.75 |
-40.26 |
-1.98% |
+29.01% |
|
|
|
 |
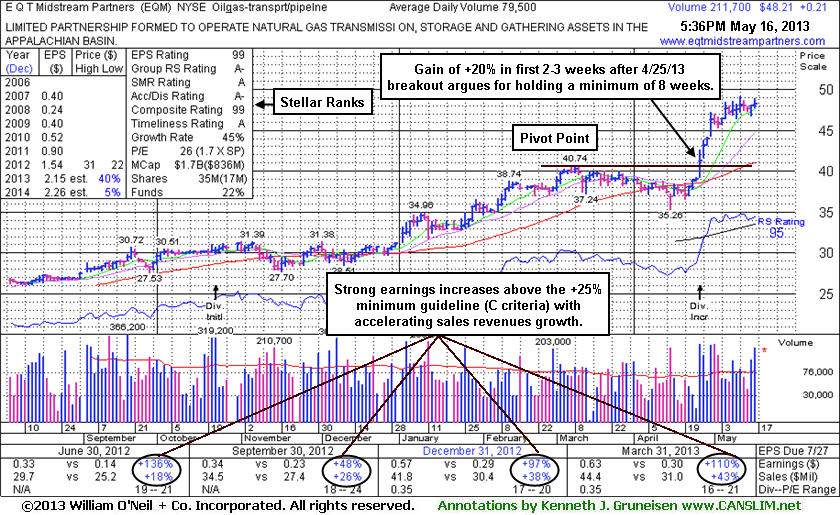
Big Gains in First Few Weeks After Breakout Bode Well
Kenneth J. Gruneisen - Passed the CAN SLIM® Master's Exam
E Q T Midstream Partners (EQM +$0.21 or +0.44% to $48.21) has been stubbornly holding its ground near its all-time high. It is extended from its latest base, but having rallied more than +20% in the first 2-3 weeks after its breakout, the investment system rules suggest holding such winners for a minimum of 8 weeks. This rule is because many of the investment system's biggest winners and best examples among the winning models were those companies that had tallied big gains shortly after their breakouts, then went on to produce dramatic gains.
This MLP in the Natural Gas business has prior highs which coincide with its 50-day moving average (DMA) line defining important near-term chart support to watch in the $41 area. It was last shown in this FSU section on 4/25/13 with an annotated graph under the headline, "Big Volume Behind Surge to New High Territory ", after highlighted in yellow with new pivot point based on its 3/08/13 high plus 10 cents in the earlier mid-day report (click here). A gain with volume +243% above average and strong close above the pivot point of its 8-week flat base triggered a technical buy signal. It was then noted - "That volume total was well above the +40% above average volume threshold which is the bare minimum needed to confirm a proper technical buy signal. Heavy volume with a big price increase and surge into new high territory is a bullish indication of institutional accumulation. It is very reassuring, but not a guarantee that any stock will go on to produce great gains."
EQM rebounded above its 50-day moving average (DMA) line after a bout of distributional pressure prior to its powerful breakout. It reported strong results for the Mar '13 quarter, and quarterly earnings increases above the +25% minimum guideline (C criteria). Accelerating sales revenues increases are very reassuring, as its sales revenues increased by +18%, +26%, +38%, and +43% in the Jun, Sep, Dec '12 and Mar '13 quarters versus the year-ago periods, respectively. The number of top-rated funds owning its shares rose from 20 in Jun '12 to 35 in Mar '13, a reassuring sign concerning the I criteria.
|
|
|
Color Codes Explained :
Y - Better candidates highlighted by our
staff of experts.
G - Previously featured
in past reports as yellow but may no longer be buyable under the
guidelines.
***Last / Change / Volume data in this table is the closing quote data***
Symbol/Exchange
Company Name
Industry Group |
PRICE |
CHANGE
(%Change) |
Day High |
Volume
(% DAV)
(% 50 day avg vol) |
52 Wk Hi
% From Hi |
Featured
Date |
Price
Featured |
Pivot Featured |
|
Max Buy |
AL
-
NYSE
Air Lease Corp Cl A
DIVERSIFIED SERVICES - Rental and Leasing Services
|
$29.52
|
-0.67
-2.22% |
$30.29
|
478,807
100.59% of 50 DAV
50 DAV is 476,000
|
$31.00
-4.77%
|
5/9/2013
|
$30.95
|
PP = $29.38
|
|
MB = $30.85
|
Most Recent Note - 5/15/2013 1:51:39 PM
Y - Rallying from support at its 50 DMA line and back above its pivot point with today's considerable gain backed by above average volume. Recently reported earnings +38% on +45% sales revenues for the Mar '13 quarter after highlighted in yellow in the 5/09/13 mid-day report (read here) with a pivot point cited based on its 4/09/13 high while rallying from a "double bottom" base.
>>> The latest Featured Stock Update with an annotated graph appeared on 5/9/2013. Click here.
View all notes |
Alert me of new notes |
CANSLIM.net Company Profile |
SEC |
Zacks Reports |
StockTalk |
News |
Chart |
Request a new note
C
A N
S L
I M


|
AMBA
-
NASDAQ
Ambarella Inc
ELECTRONICS - Semiconductor - Specialized
|
$15.19
|
-0.02
-0.13% |
$15.40
|
579,475
95.78% of 50 DAV
50 DAV is 605,000
|
$16.00
-5.06%
|
5/6/2013
|
$15.31
|
PP = $16.10
|
|
MB = $16.91
|
Most Recent Note - 5/15/2013 1:54:07 PM
Y - Rebounding today with a solid gain erasing the prior session's damaging loss on above average volume. Previous notes cautioned - "Volume-driven gains above the new pivot point are needed to trigger a new technical buy signal. Still basing, with near-term resistance due to overhead supply up through the $16 level. Found encouraging support at its 50 DMA line and flashed above average volume behind recent gains while building on a new base."
>>> The latest Featured Stock Update with an annotated graph appeared on 5/6/2013. Click here.
View all notes |
Alert me of new notes |
CANSLIM.net Company Profile |
SEC |
Zacks Reports |
StockTalk |
News |
Chart |
Request a new note
C
A N
S L
I M
|
CELG
-
NASDAQ
Celgene Corp
DRUGS - Drug Manufacturers - Major
|
$123.48
|
-6.15
-4.74% |
$128.83
|
4,942,053
159.26% of 50 DAV
50 DAV is 3,103,200
|
$131.82
-6.33%
|
3/27/2013
|
$113.24
|
PP = $115.54
|
|
MB = $121.32
|
 Most Recent Note - 5/16/2013 11:55:56 AM
G - Gapped down today retreating from all-time highs. It is extended from any sound base pattern, yet may go on to produce more climactic gains. Found support at its 50 DMA line during its recent consolidation and that short-term average defines important near-term support to watch.
>>> The latest Featured Stock Update with an annotated graph appeared on 5/13/2013. Click here.
View all notes |
Alert me of new notes |
CANSLIM.net Company Profile |
SEC |
Zacks Reports |
StockTalk |
News |
Chart |
Request a new note
C
A N
S L
I M
|
CMCSA
-
NASDAQ
Comcast Corp Cl A
MEDIA - CATV Systems
|
$42.87
|
-0.86
-1.96% |
$43.73
|
8,873,129
75.25% of 50 DAV
50 DAV is 11,791,100
|
$43.74
-1.99%
|
12/3/2012
|
$37.08
|
PP = $38.06
|
|
MB = $39.96
|
Most Recent Note - 5/13/2013 6:02:32 PM
G - Despite fundamental concerns repeatedly noted it remains perched at its 52-week high. Reported earnings +13% on +3% sales revenues for the Mar '13 quarter, the 2nd consecutive quarterly comparison with earnings well below the +25% minimum guideline (C criteria).
>>> The latest Featured Stock Update with an annotated graph appeared on 4/16/2013. Click here.
View all notes |
Alert me of new notes |
CANSLIM.net Company Profile |
SEC |
Zacks Reports |
StockTalk |
News |
Chart |
Request a new note
C
A N
S L
I M
|
EQM
-
NYSE
E Q T Midstream Partners
ENERGY - Oil and Gas Pipelines
|
$48.21
|
+0.21
0.44% |
$48.90
|
211,796
266.41% of 50 DAV
50 DAV is 79,500
|
$49.10
-1.81%
|
4/25/2013
|
$40.16
|
PP = $40.84
|
|
MB = $42.88
|
Most Recent Note - 5/16/2013 12:03:48 PM
G - Still stubbornly holding its ground near its all-time high, extended from its latest base. Prior highs coincide with its 50 DMA line defining important near-term chart support to watch in the $41 area.
>>> The latest Featured Stock Update with an annotated graph appeared on 5/16/2013. Click here.
View all notes |
Alert me of new notes |
CANSLIM.net Company Profile |
SEC |
Zacks Reports |
StockTalk |
News |
Chart |
Request a new note
C
A N
S L
I M
|
Symbol/Exchange
Company Name
Industry Group |
PRICE |
CHANGE
(%Change) |
Day High |
Volume
(% DAV)
(% 50 day avg vol) |
52 Wk Hi
% From Hi |
Featured
Date |
Price
Featured |
Pivot Featured |
|
Max Buy |
FLT
-
NYSE
Fleetcor Technologies
DIVERSIFIED SERVICES - Business/Management Services
|
$81.22
|
-0.68
-0.83% |
$81.50
|
1,838,800
203.20% of 50 DAV
50 DAV is 904,900
|
$85.56
-5.07%
|
3/21/2013
|
$71.14
|
PP = $73.00
|
|
MB = $76.65
|
Most Recent Note - 5/16/2013 12:09:14 PM
G - Enduring mild distributional pressure near its all-time high, extended from any sound base pattern. Its 50 DMA line and recent low ($70.09) define near-term support where violations would raise more serious concerns and trigger worrisome technical sell signals.
>>> The latest Featured Stock Update with an annotated graph appeared on 5/8/2013. Click here.
View all notes |
Alert me of new notes |
CANSLIM.net Company Profile |
SEC |
Zacks Reports |
StockTalk |
News |
Chart |
Request a new note
C
A N
S L
I M
|
LNKD
-
NYSE
Linkedin Corp Class A
INTERNET - Internet Information Providers
|
$181.36
|
-3.45
-1.87% |
$184.80
|
1,800,857
76.88% of 50 DAV
50 DAV is 2,342,500
|
$202.91
-10.62%
|
4/12/2013
|
$182.69
|
PP = $184.25
|
|
MB = $193.46
|
Most Recent Note - 5/15/2013 12:27:18 PM
Y - Rebounded above its 50 DMA line helping its technical stance improve, and on track for a 3rd consecutive gain with ever-increasing volume. Recent lows in the $171 area define important near-term support above the 4/03/13 low ($165), levels where subsequent violations may raise greater concerns and trigger more worrisome technical sell signals.
>>> The latest Featured Stock Update with an annotated graph appeared on 4/29/2013. Click here.
View all notes |
Alert me of new notes |
CANSLIM.net Company Profile |
SEC |
Zacks Reports |
StockTalk |
News |
Chart |
Request a new note
C
A N
S L
I M
|
LOPE
-
NASDAQ
Grand Canyon Education
DIVERSIFIED SERVICES - Education and; Training Services
|
$31.47
|
+0.14
0.45% |
$31.95
|
349,800
94.95% of 50 DAV
50 DAV is 368,400
|
$31.44
0.10%
|
5/10/2013
|
$29.03
|
PP = $27.28
|
|
MB = $28.64
|
Most Recent Note - 5/15/2013 4:34:04 PM
G - Added to its spurt of volume-driven gains today, getting very extended from prior highs. Stubbornly held its ground since featured in the 5/10/13 mid-day report and in greater detail in the Featured Stock Update (FSU) section following a recent "breakaway gap". Prior highs in the $27 area define initial support to watch on pullbacks.
>>> The latest Featured Stock Update with an annotated graph appeared on 5/10/2013. Click here.
View all notes |
Alert me of new notes |
CANSLIM.net Company Profile |
SEC |
Zacks Reports |
StockTalk |
News |
Chart |
Request a new note
C
A N
S L
I M
|
MRLN
-
NASDAQ
Marlin Business Services
DIVERSIFIED SERVICES - Rental and Leasing Services
|
$23.32
|
-0.58
-2.43% |
$24.00
|
29,597
119.34% of 50 DAV
50 DAV is 24,800
|
$25.97
-10.20%
|
3/15/2013
|
$22.29
|
PP = $23.18
|
|
MB = $24.34
|
Most Recent Note - 5/16/2013 6:07:43 PM
Y - Down again today with lighter but still above average volume, slumping near prior highs in the $23 area and its 50 DMA line defining important chart support to watch. Subsequent violations may raise concerns and trigger technical sell signals.
>>> The latest Featured Stock Update with an annotated graph appeared on 5/2/2013. Click here.
View all notes |
Alert me of new notes |
CANSLIM.net Company Profile |
SEC |
Zacks Reports |
StockTalk |
News |
Chart |
Request a new note
C
A N
S L
I M
|
N
-
NYSE
Netsuite Inc
DIVERSIFIED SERVICES - Business/Management Services
|
$94.44
|
+0.04
0.04% |
$95.76
|
428,499
123.42% of 50 DAV
50 DAV is 347,200
|
$95.00
-0.59%
|
12/12/2012
|
$64.75
|
PP = $67.12
|
|
MB = $70.48
|
Most Recent Note - 5/15/2013 6:16:26 PM
G - Perched at its all-time high, extended from any sound base while on track for its 6th straight weekly gain. Fundamentally, concerns were raised by 2 consecutive quarterly comparisons with earnings below the minimum guideline (C criteria). See the latest FSU analysis for more details and a new annotated weekly graph.
>>> The latest Featured Stock Update with an annotated graph appeared on 5/15/2013. Click here.
View all notes |
Alert me of new notes |
CANSLIM.net Company Profile |
SEC |
Zacks Reports |
StockTalk |
News |
Chart |
Request a new note
C
A N
S L
I M
|
Symbol/Exchange
Company Name
Industry Group |
PRICE |
CHANGE
(%Change) |
Day High |
Volume
(% DAV)
(% 50 day avg vol) |
52 Wk Hi
% From Hi |
Featured
Date |
Price
Featured |
Pivot Featured |
|
Max Buy |
NSM
-
NYSE
Nationstar Mtg Hldgs Inc
FINANCIAL SERVICES - Credit Services
|
$44.49
|
-0.31
-0.69% |
$44.84
|
1,721,949
141.40% of 50 DAV
50 DAV is 1,217,800
|
$46.91
-5.16%
|
5/7/2013
|
$39.71
|
PP = $42.34
|
|
MB = $44.46
|
Most Recent Note - 5/14/2013 2:19:00 PM
G - Color code is changed to green after rallying beyond its "max buy" level for another new all-time high with today's 7th consecutive volume-driven gain. Technically, the gain above its new pivot point on 5/09/13 triggered a technical buy signal. Highlighted in the 5/07/13 mid-day report with an annotated daily graph (read here) and covered in more detail in the latest FSU analysis with an annotated weekly graph.
>>> The latest Featured Stock Update with an annotated graph appeared on 5/7/2013. Click here.
View all notes |
Alert me of new notes |
CANSLIM.net Company Profile |
SEC |
Zacks Reports |
StockTalk |
News |
Chart |
Request a new note
C
A N
S L
I M
|
PRAA
-
NASDAQ
Portfolio Recovery Assoc
DIVERSIFIED SERVICES - Business/Management Services
|
$149.27
|
-0.73
-0.49% |
$151.51
|
103,096
148.34% of 50 DAV
50 DAV is 69,500
|
$151.00
-1.15%
|
5/1/2013
|
$130.77
|
PP = $127.88
|
|
MB = $134.27
|
Most Recent Note - 5/16/2013 6:09:29 PM
G - Small loss today ended an impressive streak of 13 consecutive gains into new high territory. Very extended from prior highs in the $127 area coinciding with its 50 DMA line defining important chart support.
>>> The latest Featured Stock Update with an annotated graph appeared on 5/1/2013. Click here.
View all notes |
Alert me of new notes |
CANSLIM.net Company Profile |
SEC |
Zacks Reports |
StockTalk |
News |
Chart |
Request a new note
C
A N
S L
I M
|
PRLB
-
NYSE
Proto Labs Inc
MANUFACTURING - Small Tools and Accessories
|
$54.35
|
-0.34
-0.62% |
$55.50
|
599,977
111.27% of 50 DAV
50 DAV is 539,200
|
$59.84
-9.17%
|
5/3/2013
|
$54.77
|
PP = $54.01
|
|
MB = $56.71
|
Most Recent Note - 5/15/2013 12:49:48 PM
Y - Gapped down today, retreating below its "max buy" level and its color code is changed to yellow. Prior highs in the $54-55 area define support to watch above its 50 DMA line.
>>> The latest Featured Stock Update with an annotated graph appeared on 5/3/2013. Click here.
View all notes |
Alert me of new notes |
CANSLIM.net Company Profile |
SEC |
Zacks Reports |
StockTalk |
News |
Chart |
Request a new note
C
A N
S L
I M
|
RRTS
-
NYSE
Roadrunner Trans Systems
TRANSPORTATION - Air Delivery and Freight Service
|
$26.89
|
-0.19
-0.70% |
$27.07
|
159,219
80.58% of 50 DAV
50 DAV is 197,600
|
$27.29
-1.46%
|
4/3/2013
|
$22.77
|
PP = $23.75
|
|
MB = $24.94
|
Most Recent Note - 5/14/2013 4:33:16 PM
G - Finished strong today with a gain on average volume for another new all-time high, getting more extended from its latest base. Prior highs in the $23 area define initial support to watch above its 50 DMA line.
>>> The latest Featured Stock Update with an annotated graph appeared on 5/14/2013. Click here.
View all notes |
Alert me of new notes |
CANSLIM.net Company Profile |
SEC |
Zacks Reports |
StockTalk |
News |
Chart |
Request a new note
C
A N
S L
I M
|
VRX
-
NYSE
Valeant Pharmaceuticals
DRUGS - Drug Manufacturers - Other
|
$75.75
|
-0.58
-0.76% |
$76.91
|
717,318
49.81% of 50 DAV
50 DAV is 1,440,100
|
$77.44
-2.18%
|
4/30/2013
|
$60.24
|
PP = $76.66
|
|
MB = $80.49
|
Most Recent Note - 5/16/2013 6:11:14 PM
Y- Quietly holding its ground perched at all-time highs, a sign that very few investors have been headed for the exit. The 50 DMA line and recent low ($69.87 on 4/04/13) define important support where subsequent violations may trigger technical sell signals. Prior reports cautioned - "Sub par earnings for the Mar '13 quarter below the +25% minimum guideline (C criteria) raised fundamental concerns."
>>> The latest Featured Stock Update with an annotated graph appeared on 4/30/2013. Click here.
View all notes |
Alert me of new notes |
CANSLIM.net Company Profile |
SEC |
Zacks Reports |
StockTalk |
News |
Chart |
Request a new note
C
A N
S L
I M
|
Symbol/Exchange
Company Name
Industry Group |
PRICE |
CHANGE
(%Change) |
Day High |
Volume
(% DAV)
(% 50 day avg vol) |
52 Wk Hi
% From Hi |
Featured
Date |
Price
Featured |
Pivot Featured |
|
Max Buy |
|
|
|
THESE ARE NOT BUY RECOMMENDATIONS!
Comments contained in the body of this report are technical
opinions only. The material herein has been obtained
from sources believed to be reliable and accurate, however,
its accuracy and completeness cannot be guaranteed.
This site is not an investment advisor, hence it does
not endorse or recommend any securities or other investments.
Any recommendation contained in this report may not
be suitable for all investors and it is not to be deemed
an offer or solicitation on our part with respect to
the purchase or sale of any securities. All trademarks,
service marks and trade names appearing in this report
are the property of their respective owners, and are
likewise used for identification purposes only.
This report is a service available
only to active Paid Premium Members.
You may opt-out of receiving report notifications
at any time. Questions or comments may be submitted
by writing to Premium Membership Services 665 S.E. 10 Street, Suite 201 Deerfield Beach, FL 33441-5634 or by calling 1-800-965-8307
or 954-785-1121.
|
|
|

