***Last / Change / Volume data in this table is the closing quote data***
Symbol/Exchange
Company Name
Industry Group |
PRICE |
CHANGE
(%Change) |
Day High |
Volume
(% DAV)
(% 50 day avg vol) |
52 Wk Hi
% From Hi |
Featured
Date |
Price
Featured |
Pivot Featured |
|
Max Buy |
ACN
-
NYSE
Accenture Plc
DIVERSIFIED SERVICES - Business/Management Services
|
$59.12
|
+0.19
0.32% |
$60.12
|
3,839,370
106.98% of 50 DAV
50 DAV is 3,589,000
|
$65.89
-10.27%
|
3/23/2012
|
$64.13
|
PP = $63.76
|
|
MB = $66.95
|
Most Recent Note - 5/15/2012 8:05:20 PM
G - Halted its slide above its 200 DMA line after triggering technical sell signals while slumping under prior highs in the $62-63 area and violating its 50 DMA line.
>>> The latest Featured Stock Update with an annotated graph appeared on 3/23/2012. Click here.
View all notes |
Alert me of new notes |
CANSLIM.net Company Profile |
SEC |
Zacks Reports |
StockTalk |
News |
Chart |
Request a new note
C
A N
S L
I M


|
ADS
-
NYSE
Alliance Data Sys Corp
COMPUTER SOFTWARE and SERVICES - Information and Delivery Service
|
$125.72
|
-0.55
-0.44% |
$128.05
|
516,927
91.51% of 50 DAV
50 DAV is 564,900
|
$130.66
-3.78%
|
1/17/2012
|
$108.24
|
PP = $107.43
|
|
MB = $112.80
|
Most Recent Note - 5/15/2012 8:34:03 PM
G - Holding its ground near its 50 DMA line. The recent low ($122.70 on 5/09/12) defines important support where a violation would complete a bearish head-and-shoulders pattern and trigger a worrisome technical sell signal. Sub par earnings increases in the 2 latest quarterly reports (Dec '11 and Mar '12) raised fundamental concerns.
>>> The latest Featured Stock Update with an annotated graph appeared on 4/24/2012. Click here.
View all notes |
Alert me of new notes |
CANSLIM.net Company Profile |
SEC |
Zacks Reports |
StockTalk |
News |
Chart |
Request a new note
C
A N
S L
I M
|
ALLT
-
NASDAQ
Allot Communications Ltd
COMPUTER SOFTWARE andamp; SERVICES - Technical andamp; System Software
|
$23.83
|
+0.43
1.84% |
$24.19
|
343,420
67.54% of 50 DAV
50 DAV is 508,500
|
$26.97
-11.64%
|
3/13/2012
|
$19.72
|
PP = $18.91
|
|
MB = $19.86
|
Most Recent Note - 5/11/2012 4:06:20 PM
G - Posted a gain with light volume and stayed above its 50 DMA line today after 3 losses with above average volume in the prior 4 sessions. It is extended from its prior base. The recent low ($22.46 on 4/23/12) define near-term support that coincides with its 50 DMA line.
>>> The latest Featured Stock Update with an annotated graph appeared on 3/19/2012. Click here.
View all notes |
Alert me of new notes |
CANSLIM.net Company Profile |
SEC |
Zacks Reports |
StockTalk |
News |
Chart |
Request a new note
C
A N
S L
I M
|
ALXN
-
NASDAQ
Alexion Pharmaceuticals
DRUGS - Drug Manufacturers - Other
|
$86.99
|
+0.26
0.30% |
$87.73
|
1,516,238
123.23% of 50 DAV
50 DAV is 1,230,400
|
$95.01
-8.44%
|
5/1/2012
|
$91.73
|
PP = $95.11
|
|
MB = $99.87
|
Most Recent Note - 5/15/2012 8:08:19 PM
G - Outlook remains questionable until it rebounds above its 50 DMA line. Meanwhile it is consolidating well above its 200 DMA line that defines the next important chart support level .
>>> The latest Featured Stock Update with an annotated graph appeared on 4/16/2012. Click here.
View all notes |
Alert me of new notes |
CANSLIM.net Company Profile |
SEC |
Zacks Reports |
StockTalk |
News |
Chart |
Request a new note
C
A N
S L
I M
|
ARBA
-
NASDAQ
Ariba Inc
INTERNET - Internet Software and Services
|
$38.10
|
+0.18
0.47% |
$38.46
|
1,033,599
104.54% of 50 DAV
50 DAV is 988,700
|
$40.45
-5.81%
|
4/27/2012
|
$38.53
|
PP = $37.24
|
|
MB = $39.10
|
Most Recent Note - 5/11/2012 1:22:25 PM
G - Trading above its "max buy" level today. Held its ground stubbornly since its technical breakout on 5 times average volume when highlighted in yellow in the 4/27/12 mid-day breakouts report (read here). Support to watch is at prior highs in the $35-37 area.
>>> The latest Featured Stock Update with an annotated graph appeared on 4/30/2012. Click here.
View all notes |
Alert me of new notes |
CANSLIM.net Company Profile |
SEC |
Zacks Reports |
StockTalk |
News |
Chart |
Request a new note
C
A N
S L
I M
|
Symbol/Exchange
Company Name
Industry Group |
PRICE |
CHANGE
(%Change) |
Day High |
Volume
(% DAV)
(% 50 day avg vol) |
52 Wk Hi
% From Hi |
Featured
Date |
Price
Featured |
Pivot Featured |
|
Max Buy |
CERN
-
NASDAQ
Cerner Corp
COMPUTER SOFTWARE and SERVICES - Healthcare Information Service
|
$79.22
|
-0.73
-0.91% |
$80.71
|
970,972
84.29% of 50 DAV
50 DAV is 1,151,900
|
$84.10
-5.80%
|
4/27/2012
|
$77.23
|
PP = $78.63
|
|
MB = $82.56
|
Most Recent Note - 5/15/2012 8:40:27 PM
Y - Color code is changed to yellow while holding its ground above its pivot point and staying near its all-time high after testing near prior chart highs that acted as support. Market weakness (M criteria) is an overriding concern that argues against new buying efforts until a new confirmed rally with a follow-through day by at least one of the major averages.
>>> The latest Featured Stock Update with an annotated graph appeared on 5/1/2012. Click here.
View all notes |
Alert me of new notes |
CANSLIM.net Company Profile |
SEC |
Zacks Reports |
StockTalk |
News |
Chart |
Request a new note
C
A N
S L
I M
|
CMCSA
-
NASDAQ
Comcast Corp Cl A
MEDIA - CATV Systems
|
$28.85
|
+0.00
0.00% |
$29.20
|
11,392,290
90.20% of 50 DAV
50 DAV is 12,630,300
|
$30.88
-6.56%
|
5/2/2012
|
$30.04
|
PP = $30.51
|
|
MB = $32.04
|
Most Recent Note - 5/15/2012 8:11:13 PM
G - Color code is changed to green after slumping under its 50 DMA line and negating its recent breakout. Prior low ($28.54 on 4/10/12) defines the next important chart support level to watch where a violation may trigger a more worrisome technical sell signal.
>>> The latest Featured Stock Update with an annotated graph appeared on 5/7/2012. Click here.
View all notes |
Alert me of new notes |
CANSLIM.net Company Profile |
SEC |
Zacks Reports |
StockTalk |
News |
Chart |
Request a new note
C
A N
S L
I M
|
COO
-
NYSE
Cooper Companies Inc
HEALTH SERVICES - Medical Instruments and Supplies
|
$86.65
|
-0.25
-0.29% |
$87.33
|
289,807
65.82% of 50 DAV
50 DAV is 440,300
|
$89.31
-2.98%
|
3/9/2012
|
$83.05
|
PP = $81.02
|
|
MB = $85.07
|
Most Recent Note - 5/10/2012 11:16:41 AM
G - Volume totals have been light this week while consolidating near its 52-week and all-time highs and staying above its "max buy" level. It is extended from its prior base. Prior highs in the $83-84 area define near-term support above its 50 DMA line.
>>> The latest Featured Stock Update with an annotated graph appeared on 3/9/2012. Click here.
View all notes |
Alert me of new notes |
CANSLIM.net Company Profile |
SEC |
Zacks Reports |
StockTalk |
News |
Chart |
Request a new note
C
A N
S L
I M
|
DG
-
NYSE
Dollar General Corp
RETAIL - Discount, Variety Stores
|
$47.61
|
+0.61
1.30% |
$47.73
|
2,330,023
91.48% of 50 DAV
50 DAV is 2,546,900
|
$48.76
-2.36%
|
5/7/2012
|
$48.51
|
PP = $47.69
|
|
MB = $50.07
|
Most Recent Note - 5/15/2012 8:42:32 PM
Y - Stubbornly holding its ground near its 52-week high and pivot point. It has encountered some distributional pressure while market conditions (M criteria) turned for the worse.
>>> The latest Featured Stock Update with an annotated graph appeared on 5/9/2012. Click here.
View all notes |
Alert me of new notes |
CANSLIM.net Company Profile |
SEC |
Zacks Reports |
StockTalk |
News |
Chart |
Request a new note
C
A N
S L
I M
|
EXPE
-
NASDAQ
Expedia Inc
INTERNET - Internet Information Providers
|
$43.01
|
+1.33
3.19% |
$43.22
|
5,665,321
128.89% of 50 DAV
50 DAV is 4,395,500
|
$43.92
-2.07%
|
4/27/2012
|
$41.80
|
PP = $35.57
|
|
MB = $37.35
|
 Most Recent Note - 5/16/2012 2:13:09 PM
G - Today's 4th consecutive gain has it poised for possibly its best close of 2012. Volume totals have been cooling while consolidating in a tight range after it quickly got extended from its prior base following a "breakaway gap".
>>> The latest Featured Stock Update with an annotated graph appeared on 5/3/2012. Click here.
View all notes |
Alert me of new notes |
CANSLIM.net Company Profile |
SEC |
Zacks Reports |
StockTalk |
News |
Chart |
Request a new note
C
A N
S L
I M
|
Symbol/Exchange
Company Name
Industry Group |
PRICE |
CHANGE
(%Change) |
Day High |
Volume
(% DAV)
(% 50 day avg vol) |
52 Wk Hi
% From Hi |
Featured
Date |
Price
Featured |
Pivot Featured |
|
Max Buy |
GNC
-
NYSE
G N C Holdings Inc
RETAIL - Drug Stores
|
$38.75
|
-0.24
-0.62% |
$39.23
|
1,076,667
51.53% of 50 DAV
50 DAV is 2,089,200
|
$41.95
-7.63%
|
1/19/2012
|
$28.99
|
PP = $29.60
|
|
MB = $31.08
|
Most Recent Note - 5/14/2012 5:48:58 PM
G - Down today on higher volume, finishing -8.0% off its all-time high today. Support to watch is at prior highs near $36 above its 50 DMA line. Reported earnings +82% on +23% sales revenues for the quarter ended March 31, 2012 versus the year ago period.
>>> The latest Featured Stock Update with an annotated graph appeared on 4/26/2012. Click here.
View all notes |
Alert me of new notes |
CANSLIM.net Company Profile |
SEC |
Zacks Reports |
StockTalk |
News |
Chart |
Request a new note
C
A N
S L
I M
|
ISRG
-
NASDAQ
Intuitive Surgical Inc
HEALTH SERVICES - Medical Appliances and Equipment
|
$537.18
|
-9.67
-1.77% |
$548.48
|
420,480
145.80% of 50 DAV
50 DAV is 288,400
|
$594.89
-9.70%
|
12/20/2011
|
$442.43
|
PP = $449.16
|
|
MB = $471.62
|
Most Recent Note - 5/15/2012 9:08:35 PM
G - Consolidating near its 50 DMA line that defines important support. See the latest FSU analysis for more details and a new annotated graph.
>>> The latest Featured Stock Update with an annotated graph appeared on 5/15/2012. Click here.
View all notes |
Alert me of new notes |
CANSLIM.net Company Profile |
SEC |
Zacks Reports |
StockTalk |
News |
Chart |
Request a new note
C
A N
S L
I M
|
LULU
-
NASDAQ
Lululemon Athletica
MANUFACTURING - Textile Manufacturing
|
$70.93
|
+0.28
0.40% |
$72.03
|
1,867,668
85.45% of 50 DAV
50 DAV is 2,185,700
|
$81.09
-12.53%
|
5/1/2012
|
$76.05
|
PP = $77.23
|
|
MB = $81.09
|
Most Recent Note - 5/15/2012 8:21:17 PM
G - Down today with higher volume indicative of distributional pressure. Raised concerns by violating its 50 DMA line, and now its prior low ($69.64 on 4/24/12) defines important near-term support where further deterioration would more serious concerns.
>>> The latest Featured Stock Update with an annotated graph appeared on 4/12/2012. Click here.
View all notes |
Alert me of new notes |
CANSLIM.net Company Profile |
SEC |
Zacks Reports |
StockTalk |
News |
Chart |
Request a new note
C
A N
S L
I M
|
MA
-
NYSE
Mastercard Inc Cl A
DIVERSIFIED SERVICES - Business/Management Services
|
$409.37
|
-5.10
-1.23% |
$420.50
|
1,295,017
142.95% of 50 DAV
50 DAV is 905,900
|
$466.98
-12.34%
|
3/12/2012
|
$419.86
|
PP = $428.67
|
|
MB = $450.10
|
Most Recent Note - 5/15/2012 8:23:40 PM
G - Ended in the lower third of its intra-day range today while posting a small gain on very light volume. Last week's 50 DMA line violation raised concerns, and its subsequent deterioration below its prior low ($420.75 on 4/23/12) raised even greater concerns.
>>> The latest Featured Stock Update with an annotated graph appeared on 4/11/2012. Click here.
View all notes |
Alert me of new notes |
CANSLIM.net Company Profile |
SEC |
Zacks Reports |
StockTalk |
News |
Chart |
Request a new note
C
A N
S L
I M
|
MG
-
NYSE
Mistras Group Inc
DIVERSIFIED SERVICES - Bulding and Faci;ity Management Services
|
$23.76
|
+0.06
0.25% |
$24.10
|
99,845
100.35% of 50 DAV
50 DAV is 99,500
|
$26.24
-9.45%
|
3/22/2012
|
$24.96
|
PP = $26.34
|
|
MB = $27.66
|
Most Recent Note - 5/15/2012 8:25:15 PM
G - Consolidating in a tight trading range near its 50 DMA line for more than a month, holding its ground above its 200 DMA line. Previously noted - "A volume-driven gain above its recent chart high ($25.49 on 3/21/12) may help trigger a proper technical buy signal after a new base formation, however no new (lower) pivot point is currently being cited, and it may continue encountering stubborn resistance."
>>> The latest Featured Stock Update with an annotated graph appeared on 4/2/2012. Click here.
View all notes |
Alert me of new notes |
CANSLIM.net Company Profile |
SEC |
Zacks Reports |
StockTalk |
News |
Chart |
Request a new note
C
A N
S L
I M
|
Symbol/Exchange
Company Name
Industry Group |
PRICE |
CHANGE
(%Change) |
Day High |
Volume
(% DAV)
(% 50 day avg vol) |
52 Wk Hi
% From Hi |
Featured
Date |
Price
Featured |
Pivot Featured |
|
Max Buy |
NTES
-
NASDAQ
Netease Inc Adr
INTERNET - Internet Information Providers
|
$57.69
|
+0.91
1.60% |
$58.46
|
633,182
95.62% of 50 DAV
50 DAV is 662,200
|
$61.45
-6.12%
|
3/19/2012
|
$56.18
|
PP = $55.10
|
|
MB = $57.86
|
Most Recent Note - 5/11/2012 1:30:30 PM
G - Up today without great volume, yet rebounding above its 50 DMA line. Prior low ($55.34 on 4/10/12) defines the next important chart support to watch.
>>> The latest Featured Stock Update with an annotated graph appeared on 3/27/2012. Click here.
View all notes |
Alert me of new notes |
CANSLIM.net Company Profile |
SEC |
Zacks Reports |
StockTalk |
News |
Chart |
Request a new note
C
A N
S L
I M
|
RRTS
-
NYSE
Roadrunner Trans Systems
TRANSPORTATION - Air Delivery and Freight Service
|
$17.92
|
-0.03
-0.17% |
$18.06
|
66,277
68.82% of 50 DAV
50 DAV is 96,300
|
$19.06
-5.98%
|
5/3/2012
|
$18.20
|
PP = $18.69
|
|
MB = $19.62
|
Most Recent Note - 5/10/2012 11:25:37 AM
Y - Holding its ground this week, not making meaningful price progress following its recent streak of volume-driven gains. It encountered resistance and still needs a strong finish above the pivot point cited to clinch a proper technical buy signal.
>>> The latest Featured Stock Update with an annotated graph appeared on 4/9/2012. Click here.
View all notes |
Alert me of new notes |
CANSLIM.net Company Profile |
SEC |
Zacks Reports |
StockTalk |
News |
Chart |
Request a new note
C
A N
S L
I M
|
SHOO
-
NASDAQ
Steven Madden Limited
CONSUMER NON-DURABLES - Textile - Apparel Footwear
|
$40.59
|
+0.08
0.20% |
$41.13
|
293,688
87.02% of 50 DAV
50 DAV is 337,500
|
$45.70
-11.18%
|
4/27/2012
|
$43.20
|
PP = $45.32
|
|
MB = $47.59
|
Most Recent Note - 5/10/2012 6:17:45 PM
G - Technical deterioration below the recent low ($40.91 on 4/24/12) has raised more serious concerns after earnings growth for the quarter ended March 31, 2012 versus the year ago period was below the +25% minimum guideline. See latest FSU analysis for more details and a new annotated graph.
>>> The latest Featured Stock Update with an annotated graph appeared on 5/10/2012. Click here.
View all notes |
Alert me of new notes |
CANSLIM.net Company Profile |
SEC |
Zacks Reports |
StockTalk |
News |
Chart |
Request a new note
C
A N
S L
I M
|
SWI
-
NYSE
Solarwinds Inc
COMPUTER SOFTWARE and SERVICES - Application Software
|
$45.00
|
+0.08
0.18% |
$46.20
|
824,342
73.49% of 50 DAV
50 DAV is 1,121,700
|
$47.66
-5.58%
|
4/26/2012
|
$45.15
|
PP = $42.32
|
|
MB = $44.44
|
Most Recent Note - 5/15/2012 12:45:23 PM
G - Rallying well above its "max buy" level with today's gain. It triggered a technical buy signal on 4/26/12 as it was featured in the mid-day report and noted - "Reported earnings +43% on +39% sales revenues for the quarter ended March 31, 2012 versus the year ago period. It held its ground stubbornly after violating its 50 DMA line when a damaging loss with above average volume triggered technical sell signals on 4/10/12 and it was dropped from the Featured Stocks list. Earnings below the +25% guideline for the Dec '11 quarter (+21%) had also raised fundamental concerns at that time, however the stock's resilience and impressive acceleration means that 3 of the past 4 quarterly comparisons are now above the minimum guideline concerning the C criteria. Its annual earnings (A criteria) history has been strong."
>>> The latest Featured Stock Update with an annotated graph appeared on 3/16/2012. Click here.
View all notes |
Alert me of new notes |
CANSLIM.net Company Profile |
SEC |
Zacks Reports |
StockTalk |
News |
Chart |
Request a new note
C
A N
S L
I M
|
SXCI
-
NASDAQ
S X C Health Solutions
COMPUTER SOFTWARE and SERVICES - Healthcare Information Service
|
$91.50
|
+0.37
0.41% |
$92.54
|
975,871
93.19% of 50 DAV
50 DAV is 1,047,200
|
$100.50
-8.96%
|
2/23/2012
|
$68.24
|
PP = $66.05
|
|
MB = $69.35
|
Most Recent Note - 5/11/2012 4:00:28 PM
G - Up today with heavier volume after pricing a new Public Offering. Consolidating in a tight range since it posted huge volume-driven gains on 4/18 and 4/19 while rallying on M&A news.
>>> The latest Featured Stock Update with an annotated graph appeared on 3/6/2012. Click here.
View all notes |
Alert me of new notes |
CANSLIM.net Company Profile |
SEC |
Zacks Reports |
StockTalk |
News |
Chart |
Request a new note
C
A N
S L
I M
|
Symbol/Exchange
Company Name
Industry Group |
PRICE |
CHANGE
(%Change) |
Day High |
Volume
(% DAV)
(% 50 day avg vol) |
52 Wk Hi
% From Hi |
Featured
Date |
Price
Featured |
Pivot Featured |
|
Max Buy |
TDC
-
NYSE
Teradata Corp
COMPUTER SOFTWARE and SERVICES - Technical and; System Software
|
$67.85
|
-1.76
-2.53% |
$70.04
|
2,194,262
139.52% of 50 DAV
50 DAV is 1,572,700
|
$79.89
-15.07%
|
5/3/2012
|
$79.06
|
PP = $70.73
|
|
MB = $74.27
|
Most Recent Note - 5/16/2012 2:09:05 PM
G - Color code is changed to green while slumping below its pivot point and below its 50 DMA line today, raising concerns. Prior lows in the $66 area define the next important chart support level to watch.
>>> The latest Featured Stock Update with an annotated graph appeared on 5/8/2012. Click here.
View all notes |
Alert me of new notes |
CANSLIM.net Company Profile |
SEC |
Zacks Reports |
StockTalk |
News |
Chart |
Request a new note
C
A N
S L
I M
|
TDG
-
NYSE
Transdigm Group Inc
AEROSPACE/DEFENSE - Aerospace/Defense Products and; Services
|
$124.01
|
+0.36
0.29% |
$125.90
|
561,216
122.11% of 50 DAV
50 DAV is 459,600
|
$132.69
-6.54%
|
2/29/2012
|
$120.10
|
PP = $118.93
|
|
MB = $124.88
|
Most Recent Note - 5/15/2012 8:29:39 PM
G - Consolidating since hitting a new all-time high with a volume-driven gain on 5/08/12. It has quietly pulled back below its "max buy" level, however poor market conditions (M criteria) argue against making any new buying efforts until a new confirmed rally by at least one of the major averages with a solid follow-through day. Prior highs in the $118-121 area define chart support to watch on pullbacks.
>>> The latest Featured Stock Update with an annotated graph appeared on 3/30/2012. Click here.
View all notes |
Alert me of new notes |
CANSLIM.net Company Profile |
SEC |
Zacks Reports |
StockTalk |
News |
Chart |
Request a new note
C
A N
S L
I M
|
TNGO
-
NASDAQ
Tangoe Inc
COMPUTER SOFTWARE and SERVICES - Technical and System Software
|
$20.51
|
-1.30
-5.96% |
$22.96
|
752,174
118.79% of 50 DAV
50 DAV is 633,200
|
$23.05
-11.02%
|
3/27/2012
|
$19.35
|
PP = $20.00
|
|
MB = $21.00
|
Most Recent Note - 5/16/2012 2:06:03 PM
G - Reversing for a considerable loss and slumping under its "max buy" level today after starting the session with a small gap up. Support to watch is at its 50 DMA line.
>>> The latest Featured Stock Update with an annotated graph appeared on 4/3/2012. Click here.
View all notes |
Alert me of new notes |
CANSLIM.net Company Profile |
SEC |
Zacks Reports |
StockTalk |
News |
Chart |
Request a new note
C
A N
S L
I M
|
TSCO
-
NASDAQ
Tractor Supply Co
SPECIALTY RETAIL - Specialty Retail, Other
|
$98.20
|
+1.02
1.05% |
$98.75
|
966,143
117.21% of 50 DAV
50 DAV is 824,300
|
$101.20
-2.96%
|
5/1/2012
|
$98.38
|
PP = $101.30
|
|
MB = $106.37
|
Most Recent Note - 5/16/2012 1:16:44 PM
Y - Still consolidating above its 50 DMA line which recently acted as support. Volume-driven gains to new highs did not trigger a new (or add-on) technical buy signal in recent weeks. Market conditions (M criteria) also argue against new buying efforts until a new confirmed rally with a solid follow-through day by at least one of the major averages.
>>> The latest Featured Stock Update with an annotated graph appeared on 4/17/2012. Click here.
View all notes |
Alert me of new notes |
CANSLIM.net Company Profile |
SEC |
Zacks Reports |
StockTalk |
News |
Chart |
Request a new note
C
A N
S L
I M
|
UA
-
NYSE
Under Armour Inc Cl A
CONSUMER NON-DURABLES - Textile - Apparel Clothing
|
$94.73
|
+0.13
0.14% |
$95.57
|
1,013,672
107.26% of 50 DAV
50 DAV is 945,100
|
$102.86
-7.90%
|
2/15/2012
|
$85.77
|
PP = $84.86
|
|
MB = $89.10
|
Most Recent Note - 5/15/2012 8:48:15 PM
G - The longer it lingers below its 50 DMA line the worse its outlook gets. That short-term average has acted as resistance following the violation on 5/08/12 which triggered technical sell signals. Concerns were raised by weaker fundamentals. Reported earnings +22% on +23% sales revenues for the quarter ended March 31, 2012 versus the year ago period, its first quarterly earnings increase below the +25% minimum guideline in more than 2 years.
>>> The latest Featured Stock Update with an annotated graph appeared on 4/4/2012. Click here.
View all notes |
Alert me of new notes |
CANSLIM.net Company Profile |
SEC |
Zacks Reports |
StockTalk |
News |
Chart |
Request a new note
C
A N
S L
I M
|
Symbol/Exchange
Company Name
Industry Group |
PRICE |
CHANGE
(%Change) |
Day High |
Volume
(% DAV)
(% 50 day avg vol) |
52 Wk Hi
% From Hi |
Featured
Date |
Price
Featured |
Pivot Featured |
|
Max Buy |
V
-
NYSE
Visa Inc Cl A
DIVERSIFIED SERVICES - Business/Management Services
|
$117.53
|
+1.14
0.98% |
$118.20
|
4,334,504
127.90% of 50 DAV
50 DAV is 3,389,100
|
$125.35
-6.24%
|
3/12/2012
|
$116.53
|
PP = $119.46
|
|
MB = $125.43
|
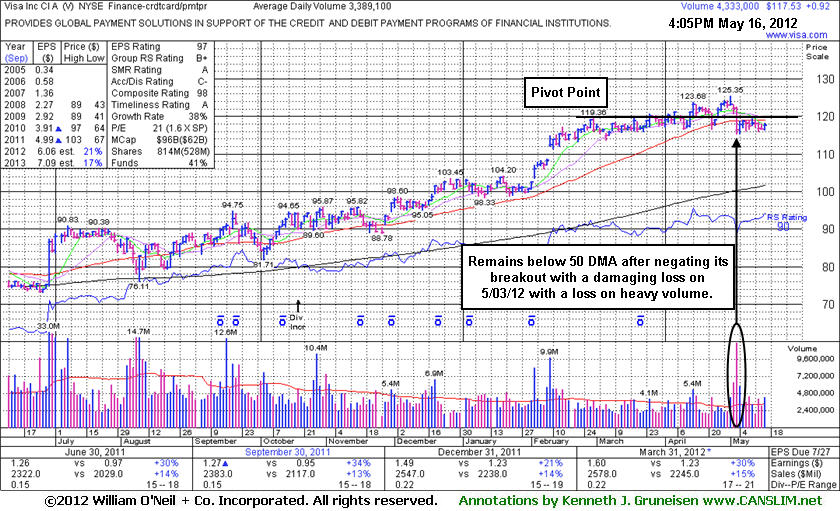
Most Recent Note - 5/16/2012 6:43:45 PM
G - Still consolidating below its 50 DMA line which has acted as a resistance level after the technical violation on 5/03/12. The longer it lingers below its 50 DMA line the worse its outlook becomes. See the latest FSU analysis for more details and a new annotated graph.
>>> The latest Featured Stock Update with an annotated graph appeared on 5/16/2012. Click here.
View all notes |
Alert me of new notes |
CANSLIM.net Company Profile |
SEC |
Zacks Reports |
StockTalk |
News |
Chart |
Request a new note
C
A N
S L
I M
|
VSI
-
NYSE
Vitamin Shoppe Inc
SPECIALTY RETAIL - Specialty Retail, Other
|
$52.84
|
-0.04
-0.08% |
$53.25
|
480,802
105.35% of 50 DAV
50 DAV is 456,400
|
$55.29
-4.43%
|
4/25/2012
|
$47.77
|
PP = $48.46
|
|
MB = $50.88
|
Most Recent Note - 5/16/2012 1:19:33 PM
G - Still hovering near its 52-week high today. Volume totals have been cooling while holding its ground following considerable volume-driven gains last week bucking a broadly negative market. It is extended from its prior base.
>>> The latest Featured Stock Update with an annotated graph appeared on 4/25/2012. Click here.
View all notes |
Alert me of new notes |
CANSLIM.net Company Profile |
SEC |
Zacks Reports |
StockTalk |
News |
Chart |
Request a new note
C
A N
S L
I M
|
WFM
-
NASDAQ
Whole Foods Market Inc
RETAIL - Grocery Stores
|
$86.47
|
-0.76
-0.87% |
$87.91
|
1,279,793
82.90% of 50 DAV
50 DAV is 1,543,700
|
$91.50
-5.50%
|
5/3/2012
|
$90.28
|
PP = $86.45
|
|
MB = $90.77
|
Most Recent Note - 5/11/2012 7:07:48 PM
Y - Consolidating above prior highs since its considerable "breakaway gap" on 5/03/12 that cleared an orderly flat base pattern. The is no resistance remaining due to overhead supply. See the latest FSU analysis for more details and a new annotated graph.
>>> The latest Featured Stock Update with an annotated graph appeared on 5/11/2012. Click here.
View all notes |
Alert me of new notes |
CANSLIM.net Company Profile |
SEC |
Zacks Reports |
StockTalk |
News |
Chart |
Request a new note
C
A N
S L
I M
|