You are not logged in.
This means you
CAN ONLY VIEW reports that were published prior to Monday, February 26, 2024.
You
MUST UPGRADE YOUR MEMBERSHIP if you want to see any current reports.
AFTER MARKET UPDATE - TUESDAY, MAY 14TH, 2019
Previous After Market Report Next After Market Report >>>
|
|
|
|
DOW |
+207.06 |
25,532.05 |
+0.82% |
|
Volume |
768,940,700 |
-17% |
|
Volume |
2,067,800,187 |
-16% |
|
NASDAQ |
+87.47 |
7,734.49 |
+1.14% |
|
Advancers |
2,175 |
76% |
|
Advancers |
2,263 |
73% |
|
S&P 500 |
+22.54 |
2,834.41 |
+0.80% |
|
Decliners |
687 |
24% |
|
Decliners |
822 |
27% |
|
Russell 2000 |
+20.06 |
1,543.06 |
+1.32% |
|
52 Wk Highs |
69 |
|
|
52 Wk Highs |
59 |
|
|
S&P 600 |
+10.09 |
944.77 |
+1.08% |
|
52 Wk Lows |
53 |
|
|
52 Wk Lows |
84 |
|
|
 |
Major Indices Rose With Lighter Volume Totals Behind Gains
Kenneth J. Gruneisen - Passed the CAN SLIM® Master's Exam
Stocks rebounded from recent weakness Tuesday as investors kept a watchful eye on trade relations between the U.S. and China. The Dow jumped 207 points, while the S&P 500 is climbed 0.8%. The Nasdaq Composite advanced 1.1%. The volume totals reported were lighter on the NYSE and on the Nasdaq exchange, indicative of lackluster institutional buying demand. Breadth was clearly positive as advancers led decliners by a 3-1 margin on the NYSE and nearly 3-1 on the Nasdaq exchange. There were 22 high-ranked companies from the Leaders List that hit new 52-week highs and were listed on the BreakOuts Page, versus the total of 8 on the prior session. New 52-week highs outnumbered new 52-week lows on the NYSE but new lows outnumbered new highs on the Nasdaq exchange. The major indices (M criteria) came under greater pressure on Monday and were noted for action indicative of a more worrisome "correction" while leadership (stocks hitting new highs) thinned. The Featured Stocks Page provides the most timely analysis on high-ranked leaders. Charts used courtesy of www.stockcharts.com
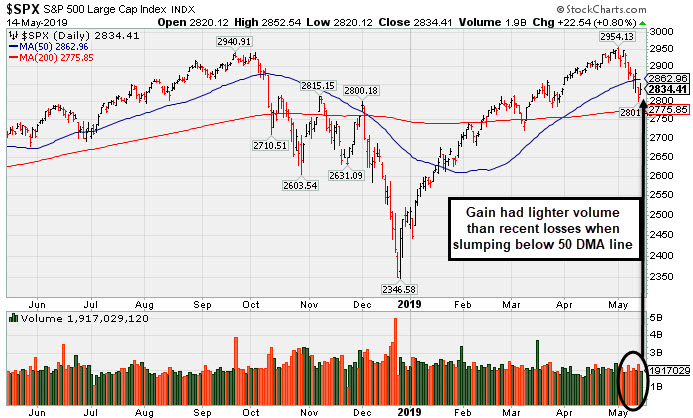
PICTURED: The S&P 500 Index posted a gain with lighter volume. Recently it slumped below its 50-day moving average (DMA) line with higher volume behind the damaging losses.
Positive commentary from President Trump provided a tailwind to stocks, as he suggested trade discussions with China will be “very successful.” President Trump also announced plans to meet with Chinese President Xi Jinping at the upcoming G-20 summit. Today’s strong gains followed Monday’s session in which the Dow and S&P 500 both suffered their worst daily decline since January 3, sliding 2.4% each.
The Technology sector, which suffered sharp losses in the prior session, paced the gains as the group added roughly 1.6%. Industrials also rebounded as Caterpillar (CAT +1.73%) and Boeing (BA +1.68%) rose. In corporate news, shares of Walt Disney (DIS +1.42%) rose on news the media giant will assume full operational control of online streaming service Hulu.
On the data front, an update showed small business optimism improved last month. Separately, import and export prices both edged 0.2% higher in April, below consensus expectations. Treasuries were modestly lower, with the yield on the 10-year note adding one basis points to 2.41%. In commodities, WTI crude gained 1.1% to $61.71/barrel amid reports of drone attacks on Saudi pipelines. COMEX gold was off 0.3% to $1,297.70/ounce amid a stronger dollar. |
 Kenneth J. Gruneisen started out as a licensed stockbroker in August 1987, a couple of months prior to the historic stock market crash that took the Dow Jones Industrial Average down -22.6% in a single day. He has published daily fact-based fundamental and technical analysis on high-ranked stocks online for two decades. Through FACTBASEDINVESTING.COM, Kenneth provides educational articles, news, market commentary, and other information regarding proven investment systems that work in good times and bad.
Comments contained in the body of this report are technical opinions only and are not necessarily those of Gruneisen Growth Corp. The material herein has been obtained from sources believed to be reliable and accurate, however, its accuracy and completeness cannot be guaranteed. Our firm, employees, and customers may effect transactions, including transactions contrary to any recommendation herein, or have positions in the securities mentioned herein or options with respect thereto. Any recommendation contained in this report may not be suitable for all investors and it is not to be deemed an offer or solicitation on our part with respect to the purchase or sale of any securities. |
|
 |
Retail Financial, Tech, and Energy-Linked Groups Rose
Kenneth J. Gruneisen - Passed the CAN SLIM® Master's Exam
The Retail Index ($RLX +0.80%), Bank Index ($BKX +0.90%) and Broker/Dealer Index ($XBD +1.01%) each ended higher on Tuesday. The tech sector also had a positive bias as the Semiconductor Index ($SOX +2.40%), Networking Index ($NWX +0.73%), and the Biotech Index ($BTK +1.67%) each rose. Commodity-linked groups were mixed as the Gold & Silver Index ($XAU -0.61%) fell while the Oil Services Index ($OSX +3.08%) and the Integrated Oil Index ($XOI +1.18%) both finished higher.
Charts courtesy of www.stockcharts.com
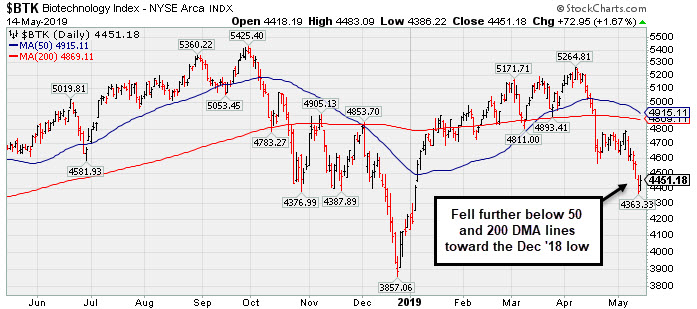 PICTURED: The Biotech Index ($BTK +1.67%) graph shows it recently slumping well below its 50-day and 200-day moving average (DMA) lines toward the Dec '18 low.
| Oil Services |
$OSX |
86.97 |
+2.59 |
+3.07% |
+7.90% |
| Integrated Oil |
$XOI |
1,269.96 |
+14.79 |
+1.18% |
+9.56% |
| Semiconductor |
$SOX |
1,442.83 |
+33.88 |
+2.40% |
+24.90% |
| Networking |
$NWX |
568.17 |
+4.11 |
+0.73% |
+16.27% |
| Broker/Dealer |
$XBD |
266.23 |
+2.66 |
+1.01% |
+12.17% |
| Retail |
$RLX |
2,270.35 |
+18.11 |
+0.80% |
+16.34% |
| Gold & Silver |
$XAU |
68.39 |
-0.42 |
-0.61% |
-3.21% |
| Bank |
$BKX |
96.90 |
+0.87 |
+0.91% |
+12.95% |
| Biotech |
$BTK |
4,451.18 |
+72.95 |
+1.67% |
+5.46% |
|
|
|
 |
Long-Term Care Firm Hovering Near All-Time High
Kenneth J. Gruneisen - Passed the CAN SLIM® Master's Exam
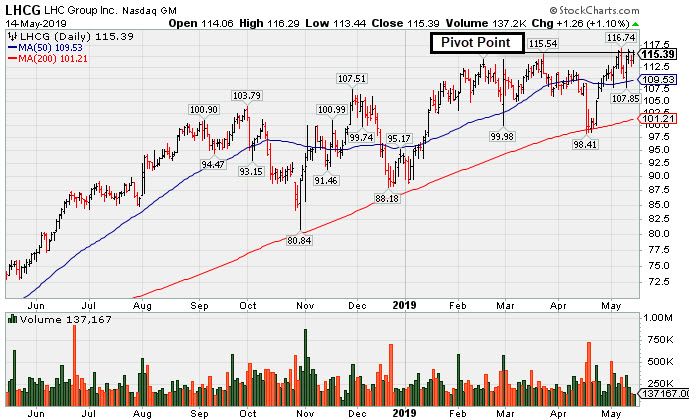
L H C Group Inc (LHCG +$1.26 or +1.10% to $115.39) reported earnings +56% on +73% sales revenues for the Mar '19 quarter, continuing its strong earnings track record above the +25% minimum guideline (C criteria). It finished near the pivot point cited based on its 3/22/19 high plus 10 cents. Subsequent gains above the pivot point backed by at least +40% above average volume may trigger a new (or add-on) technical buy signal.
It found support near its 50-day moving average (DMA) line and has been challenging its all-time high. In recent months it tested support at its 200 DMA line. LHCG was highlighted in yellow with pivot point cited based on its 11/29/18 high plus 10 cents in the 1/23/19 mid-day report (read here). It was last shown in this FSU section on 4/01/19 with an annotated graph under the headline, "Sputtering Near 50-Day Moving Average Line".
Its annual earnings growth (A criteria) has been strong, and it has a current Earnings Per Share Rating of 99. The number of top-rated funds owning its shares rose from 350 in Mar '18 to 511 in Mar '19, a reassuring sign concerning the I criteria. It has earned an A Timeliness Rating and a C Sponsorship Rating. It has a small supply of only 31.4 million shares (S criteria) outstanding, which can contribute to greater volatility in the event of institutional buying or selling.
Charts courtesy of www.stockcharts.com
 |
|
|
Color Codes Explained :
Y - Better candidates highlighted by our
staff of experts.
G - Previously featured
in past reports as yellow but may no longer be buyable under the
guidelines.
***Last / Change / Volume data in this table is the closing quote data***
Symbol/Exchange
Company Name
Industry Group |
PRICE |
CHANGE
(%Change) |
Day High |
Volume
(% DAV)
(% 50 day avg vol) |
52 Wk Hi
% From Hi |
Featured
Date |
Price
Featured |
Pivot Featured |
|
Max Buy |
MLR
-
NYSE
Miller Industries Inc
AUTOMOTIVE - Auto Parts
|
$31.83
|
-0.17
-0.53% |
$32.21
|
28,227
67.21% of 50 DAV
50 DAV is 42,000
|
$35.26
-9.73%
|
11/30/2018
|
$28.35
|
PP = $29.50
|
|
MB = $30.98
|
Most Recent Note - 5/13/2019 12:39:20 PM
G - Slumping below its 50 DMA line ($32.77). Prior low ($30.38 on 3/27/19) defines the next near-term support to watch. Reported March '19 quarterly earnings +29% on +24% sales revenues versus the year ago period, above the +25% minimum earnings guideline (C criteria).
>>> FEATURED STOCK ARTICLE : Below 50-Day Average After Damaging Losses - 4/8/2019 |
View all notes |
Set NEW NOTE alert |
Company Profile |
SEC
News |
Chart |
Request a new note
C
A
S
I |
SPSC
-
NASDAQ
S P S Commerce Inc
COMPUTER SOFTWARE and SERVICES - Application Software
|
$103.60
|
+1.45
1.42% |
$104.44
|
104,293
71.43% of 50 DAV
50 DAV is 146,000
|
$115.00
-9.91%
|
3/26/2019
|
$107.12
|
PP = $113.41
|
|
MB = $119.08
|
 Most Recent Note - 5/14/2019 5:12:13 PM
G - Still needs a rebound above its 50 DMA line ($105.17) for its outlook to improve. Recent low ($98.59 on 4/18/19) defines important near-term support to watch. Reported earnings +54% on +13% sales revenues for the quarter ended March 31, 2019 versus the year ago period.
>>> FEATURED STOCK ARTICLE : Sputtering Near 50-Day Average Line Building Base-On-Base - 5/1/2019 |
View all notes |
Set NEW NOTE alert |
Company Profile |
SEC
News |
Chart |
Request a new note
C
A
S
I |
EPAM
-
NYSE
Epam Systems Inc
COMPUTER SOFTWARE and SERVICES - Information Technology Service
|
$168.30
|
+4.33
2.64% |
$169.42
|
564,637
162.25% of 50 DAV
50 DAV is 348,000
|
$180.55
-6.78%
|
5/9/2019
|
$169.25
|
PP = $180.55
|
|
MB = $189.58
|
Most Recent Note - 5/14/2019 5:22:56 PM
Y - Posted a solid gain with higher volume today. A rebound above its 50 DMA line ($170) is needed for its outlook to improve. Reported earnings +34% on +23% sales revenues for the Mar '19 quarter, continuing its strong earnings track record.
>>> FEATURED STOCK ARTICLE : Found Support and Closed in Upper Third of Day's Range - 5/9/2019 |
View all notes |
Set NEW NOTE alert |
Company Profile |
SEC
News |
Chart |
Request a new note
C
A
S
I |
ENV
-
NYSE
Envestnet Inc
FINANCIAL SERVICES - Diversified Investments
|
$67.32
|
+0.70
1.05% |
$68.01
|
237,525
73.54% of 50 DAV
50 DAV is 323,000
|
$72.67
-7.36%
|
3/15/2019
|
$66.05
|
PP = $64.90
|
|
MB = $68.15
|
Most Recent Note - 5/14/2019 5:30:21 PM
G - Holding its ground near its 50 DMA line ($67.13) since a damaging gap down on on 5/09/19. Weak action came after reporting earnings +5% on +1% sales revenues for the Mar '19 quarter, below the +25% minimum earnings guideline (C criteria). The prior high ($64.80 on 9/14/18) defines near-term support to watch on pullbacks.
>>> FEATURED STOCK ARTICLE : Negative Reversal After Another New High - 4/24/2019 |
View all notes |
Set NEW NOTE alert |
Company Profile |
SEC
News |
Chart |
Request a new note
C
A
S
I |
LHCG
-
NASDAQ
L H C Group Inc
HEALTH SERVICES - Home Health Care
|
$115.39
|
+1.26
1.10% |
$116.29
|
137,344
53.23% of 50 DAV
50 DAV is 258,000
|
$116.74
-1.16%
|
4/29/2019
|
$110.94
|
PP = $115.64
|
|
MB = $121.42
|
Most Recent Note - 5/14/2019 5:20:19 PM
Y - Found support near its 50 DMA line and it remains perched near its all-time high. Subsequent gains above the pivot point backed by at least +40% above average volume may trigger a new (or add-on) technical buy signal. Reported earnings +56% on +73% sales revenues for the Mar '19 quarter, continuing its strong earnings track record. See the latest FSU analysis for more details and a new annotated graph.
>>> FEATURED STOCK ARTICLE : Long-Term Care Firm Hovering Near All-Time High - 5/14/2019 |
View all notes |
Set NEW NOTE alert |
Company Profile |
SEC
News |
Chart |
Request a new note
C
A
S
I |
Symbol/Exchange
Company Name
Industry Group |
PRICE |
CHANGE
(%Change) |
Day High |
Volume
(% DAV)
(% 50 day avg vol) |
52 Wk Hi
% From Hi |
Featured
Date |
Price
Featured |
Pivot Featured |
|
Max Buy |
ENSG
-
NASDAQ
Ensign Group Inc
HEALTH SERVICES - Long-Term Care Facilities
|
$55.63
|
-0.41
-0.73% |
$56.99
|
527,126
184.96% of 50 DAV
50 DAV is 285,000
|
$56.35
-1.28%
|
4/30/2019
|
$51.46
|
PP = $53.30
|
|
MB = $55.97
|
Most Recent Note - 5/14/2019 5:26:10 PM
Y - There was a "negative reversal" today after hitting new all-time highs. Gain above the pivot on the prior session was backed by +131% above average volume triggering a technical buy signal. Reported earnings +22% on +12% sales revenues for the Mar '19 quarter, below the +25% minimum earnings guideline (C criteria), raising fundamental concerns.
>>> FEATURED STOCK ARTICLE : Two Damaging Losses Hurt Outlook - 4/17/2019 |
View all notes |
Set NEW NOTE alert |
Company Profile |
SEC
News |
Chart |
Request a new note
C
A
S
I |
LULU
-
NASDAQ
Lululemon Athletica
MANUFACTURING - Textile Manufacturing
|
$170.68
|
+3.11
1.86% |
$171.51
|
1,671,949
73.82% of 50 DAV
50 DAV is 2,265,000
|
$179.50
-4.91%
|
3/28/2019
|
$169.20
|
PP = $164.89
|
|
MB = $173.13
|
Most Recent Note - 5/14/2019 5:33:02 PM
Y - Color code is changed to yellow while consolidating below its "max buy" level. Near-term support is defined by prior highs in the $164 area and its 50 DMA line ($163).
>>> FEATURED STOCK ARTICLE : Volume Light While Hovering Near High - 5/10/2019 |
View all notes |
Set NEW NOTE alert |
Company Profile |
SEC
News |
Chart |
Request a new note
C
A
S
I |
NXST
-
NASDAQ
Nexstar Media Group Cl A
MEDIA - Broadcasting - TV
|
$105.01
|
-1.29
-1.21% |
$107.11
|
575,698
109.66% of 50 DAV
50 DAV is 525,000
|
$119.93
-12.44%
|
5/1/2019
|
$115.33
|
PP = $120.03
|
|
MB = $126.03
|
Most Recent Note - 5/13/2019 5:40:20 PM
G - Color code is changed to green after slumping below its 50 DMA line ($110) raising greater concerns. Reported earnings +14% on +2% sales revenues for the Mar '19 quarter. A rebound above the 50 DMA line is needed for its outlook to improve. Subsequent gains above the pivot point backed by at least +40% above average volume may trigger a new (or add-on) technical buy signal.
>>> FEATURED STOCK ARTICLE : Hitting New High and Very Extended From Prior Base - 4/4/2019 |
View all notes |
Set NEW NOTE alert |
Company Profile |
SEC
News |
Chart |
Request a new note
C
A
S
I |
ULTA
-
NASDAQ
Ulta Beauty Inc
SPECIALTY RETAIL - Specialty Retail, Other
|
$335.32
|
+5.09
1.54% |
$336.80
|
946,822
122.65% of 50 DAV
50 DAV is 772,000
|
$359.69
-6.78%
|
3/15/2019
|
$341.27
|
PP = $322.59
|
|
MB = $338.72
|
Most Recent Note - 5/14/2019 5:16:52 PM
G - Managed a "positive reversal" today after slumping near the prior high ($322). A rebound above the 50 DMA line ($340) still is needed for its outlook to improve.
>>> FEATURED STOCK ARTICLE : Volume Totals Cooling in Recent Weeks While Hovering Near High - 4/26/2019 |
View all notes |
Set NEW NOTE alert |
Company Profile |
SEC
News |
Chart |
Request a new note
C
A
S
I |
ESNT
-
NYSE
Essent Group Ltd
Finance-MrtgandRel Svc
|
$46.76
|
+1.07
2.34% |
$46.97
|
517,370
80.59% of 50 DAV
50 DAV is 642,000
|
$48.88
-4.34%
|
3/18/2019
|
$45.84
|
PP = $45.06
|
|
MB = $47.31
|
Most Recent Note - 5/14/2019 5:13:39 PM
Y - Recently reported earnings +15% on +20% sales revenues for the Mar '19 quarter, below the +25% minimum earnings guideline (C criteria), raising fundamental concerns. Its 50 DMA line ($45.40 defines near term support to watch. Faces very little resistance due to overhead supply up to the $50 level.
>>> FEATURED STOCK ARTICLE : Perched Above Pivot Point With Earnings News Due May 3rd - 4/25/2019 |
View all notes |
Set NEW NOTE alert |
Company Profile |
SEC
News |
Chart |
Request a new note
C
A
S
I |
Symbol/Exchange
Company Name
Industry Group |
PRICE |
CHANGE
(%Change) |
Day High |
Volume
(% DAV)
(% 50 day avg vol) |
52 Wk Hi
% From Hi |
Featured
Date |
Price
Featured |
Pivot Featured |
|
Max Buy |
FIVE
-
NASDAQ
Five Below Inc
Retail-DiscountandVariety
|
$127.54
|
-0.25
-0.20% |
$129.21
|
730,945
64.86% of 50 DAV
50 DAV is 1,127,000
|
$148.22
-13.95%
|
4/11/2019
|
$132.05
|
PP = $133.75
|
|
MB = $140.44
|
Most Recent Note - 5/13/2019 5:37:52 PM
G - Pulled back today for a 6th consecutive loss and closed below its 50 DMA line ($128.83) raising greater concerns while also undercutting prior highs in the $133-136 area.
>>> FEATURED STOCK ARTICLE : Finished Strong After Featured Again in Mid-Day Report - 4/11/2019 |
View all notes |
Set NEW NOTE alert |
Company Profile |
SEC
News |
Chart |
Request a new note
C
A
S
I |
NOW
-
NYSE
Servicenow Inc
Computer Sftwr-Enterprse
|
$272.07
|
+11.95
4.59% |
$272.93
|
2,036,023
110.29% of 50 DAV
50 DAV is 1,846,000
|
$275.20
-1.14%
|
4/22/2019
|
$242.64
|
PP = $251.75
|
|
MB = $264.34
|
Most Recent Note - 5/14/2019 5:18:28 PM
G - Posted a gain today for its second best ever close. Bullish action was noted after it reported earnings +20% on +34% sales revenues for the Mar '19 quarter, below the +25% minimum earnings guideline (C criteria), raising concerns, fundamentally. Prior high ($251.65 on 3/21/19) and its 50 DMA line ($248.73) define near-term support to watch.
>>> FEATURED STOCK ARTICLE : Found Recent Support at 50-Day Moving Average - 4/15/2019 |
View all notes |
Set NEW NOTE alert |
Company Profile |
SEC
News |
Chart |
Request a new note
C
A
S
I |
PAYC
-
NYSE
Paycom Software Inc
COMPUTER SOFTWARE and SERVICES - Application Software
|
$203.28
|
+6.03
3.06% |
$204.17
|
717,570
112.83% of 50 DAV
50 DAV is 636,000
|
$210.55
-3.45%
|
2/6/2019
|
$171.66
|
PP = $164.18
|
|
MB = $172.39
|
Most Recent Note - 5/14/2019 5:27:41 PM
G - Its 50 DMA line ($190) defines important near-term support to watch. Hovering near its all-time high, extended from any sound base. Reported earnings +25% on +30% sales revenues for the Mar '19 quarter.
>>> FEATURED STOCK ARTICLE : Paycom Software Quietly Hovering Near All-Time High - 4/16/2019 |
View all notes |
Set NEW NOTE alert |
Company Profile |
SEC
News |
Chart |
Request a new note
C
A
S
I |
PYPL
-
NASDAQ
Paypal Holdings Inc
Finance-CrdtCard/PmtPr
|
$109.09
|
+2.26
2.12% |
$110.40
|
4,521,276
70.80% of 50 DAV
50 DAV is 6,386,000
|
$113.69
-4.05%
|
1/24/2019
|
$92.56
|
PP = $93.80
|
|
MB = $98.49
|
Most Recent Note - 5/14/2019 5:09:04 PM
G - Posted a gain today with light volume. Well above its 50 DMA line ($105.25) which defines near-term support to watch. Recently reported earnings +37% on +12% sales revenues for the Mar '19 quarter, continuing its strong earnings track record.
>>> FEATURED STOCK ARTICLE : Extended From Base After Gains in Recent Weeks Lacking Volume - 4/2/2019 |
View all notes |
Set NEW NOTE alert |
Company Profile |
SEC
News |
Chart |
Request a new note
C
A
S
I |
PLNT
-
NYSE
Planet Fitness Inc Cl A
Leisure-Services
|
$78.45
|
+2.87
3.80% |
$78.73
|
984,304
67.10% of 50 DAV
50 DAV is 1,467,000
|
$78.99
-0.68%
|
11/7/2018
|
$57.10
|
PP = $55.45
|
|
MB = $58.22
|
Most Recent Note - 5/14/2019 5:07:34 PM
G - Posted a gain today with below average volume for its second best close. It remains very extended from any sound base. Found prompt support at its 50 DMA line ($71) when a big volume-driven loss came after reporting earnings +30% on +23% sales revenues for its first quarter ended March 31, 2019.
>>> FEATURED STOCK ARTICLE : Perched Near High Very Extended From Prior Base - 4/5/2019 |
View all notes |
Set NEW NOTE alert |
Company Profile |
SEC
News |
Chart |
Request a new note
C
A
S
I |
Symbol/Exchange
Company Name
Industry Group |
PRICE |
CHANGE
(%Change) |
Day High |
Volume
(% DAV)
(% 50 day avg vol) |
52 Wk Hi
% From Hi |
Featured
Date |
Price
Featured |
Pivot Featured |
|
Max Buy |
TEAM
-
NASDAQ
Atlassian Corp Plc Cl A
Comp Sftwr-Spec Enterprs
|
$123.77
|
+2.99
2.48% |
$124.62
|
1,433,905
76.23% of 50 DAV
50 DAV is 1,881,000
|
$129.97
-4.77%
|
4/16/2019
|
$114.77
|
PP = $116.80
|
|
MB = $122.64
|
Most Recent Note - 5/13/2019 5:46:08 PM
Y - Today's big loss broke a streak of 7 consecutive gains into new all-time high territory and its color code is changed to yellow after closing below its "max buy" level. Reported earnings +133% on +38% sales revenues for the Mar '19 quarter, continuing its strong earnings track record.
>>> FEATURED STOCK ARTICLE : Perched Near High Enduring Distributional Pressure - 4/9/2019 |
View all notes |
Set NEW NOTE alert |
Company Profile |
SEC
News |
Chart |
Request a new note
C
A
S
I |
GLOB
-
NYSE
Globant SA
Computer-Tech Services
|
$81.16
|
+1.55
1.95% |
$83.05
|
298,017
141.24% of 50 DAV
50 DAV is 211,000
|
$85.70
-5.30%
|
2/15/2019
|
$69.35
|
PP = $70.00
|
|
MB = $73.50
|
Most Recent Note - 5/13/2019 5:43:44 PM
G - Reported earnings +32% on +22% sales revenues for the quarter ended March 31st, 2019 versus the year ago period, continuing its strong earning track record. Extended from any sound base, it pulled back abruptly today and erased the prior session's gain. Its 50 DMA line ($76.10) defines important support above the prior high ($74). Violations would raise concerns and trigger technical sell signals.
>>> FEATURED STOCK ARTICLE : Earnings News Due While Perched Near All-Time High - 5/7/2019 |
View all notes |
Set NEW NOTE alert |
Company Profile |
SEC
News |
Chart |
Request a new note
C
A
S
I |
|
|
|
THESE ARE NOT BUY RECOMMENDATIONS!
Comments contained in the body of this report are technical
opinions only. The material herein has been obtained
from sources believed to be reliable and accurate, however,
its accuracy and completeness cannot be guaranteed.
This site is not an investment advisor, hence it does
not endorse or recommend any securities or other investments.
Any recommendation contained in this report may not
be suitable for all investors and it is not to be deemed
an offer or solicitation on our part with respect to
the purchase or sale of any securities. All trademarks,
service marks and trade names appearing in this report
are the property of their respective owners, and are
likewise used for identification purposes only.
This report is a service available
only to active Paid Premium Members.
You may opt-out of receiving report notifications
at any time. Questions or comments may be submitted
by writing to Premium Membership Services 665 S.E. 10 Street, Suite 201 Deerfield Beach, FL 33441-5634 or by calling 1-800-965-8307
or 954-785-1121.
|
|
|

