You are not logged in.
This means you
CAN ONLY VIEW reports that were published prior to Monday, April 14, 2025.
You
MUST UPGRADE YOUR MEMBERSHIP if you want to see any current reports.
AFTER MARKET UPDATE - FRIDAY, MAY 14TH, 2010
Previous After Market Report Next After Market Report >>>
|
|
|
|
DOW |
-162.79 |
10,620.16 |
-1.51% |
|
Volume |
1,524,436,280 |
+27% |
|
Volume |
2,527,511,110 |
+13% |
|
NASDAQ |
-47.51 |
2,346.85 |
-1.98% |
|
Advancers |
381 |
12% |
|
Advancers |
425 |
15% |
|
S&P 500 |
-21.76 |
1,135.68 |
-1.88% |
|
Decliners |
2,730 |
86% |
|
Decliners |
2,313 |
82% |
|
Russell 2000 |
-15.87 |
693.98 |
-2.24% |
|
52 Wk Highs |
19 |
|
|
52 Wk Highs |
27 |
|
|
S&P 600 |
-7.57 |
372.00 |
-1.99% |
|
52 Wk Lows |
22 |
|
|
52 Wk Lows |
29 |
|
|
 |
Stocks Fall As Volume Expands
Adam Sarhan, Contributing Writer,
Continuing the recent trend, the major averages rallied during the first half of the week only to fall hard during the latter half. Volume totals were reported higher on the Nasdaq and the NYSE compared to Thursday's total. Decliners led advancers by nearly a 6-to-1 ratio on the NYSE and the Nasdaq exchange. New 52-week highs outnumbered new 52-week lows on the NYSE but trailed new lows on the Nasdaq exchange. There were only 3 high-ranked companies from the CANSLIM.net Leaders List that made a new 52-week high and appeared on the CANSLIM.net BreakOuts Page, lower than the 25 issues that appeared on the prior session.
Stocks surged around the world after European policy makers announced a $1 trillion bailout package designed to end the region's sovereign-debt crisis, curb contagion woes, and save the euro. Initially, the euro opened higher but negatively reversed after the bears showed up and quickly sent the euro lower. The fact that the euro could not rally on bullish news begs the question, when will it rally? By Friday, the euro fell a whopping 7 handles (from 1.30-1.23) and closed near its lows for the week.
Stocks closed mixed on Tuesday after encountering resistance near their respective 50 DMA lines. Again, it was a bit disconcerting to see volume recede as the major averages advanced. In a surprising turn of events, David Cameron was named the new Prime Minister of the United Kingdom after Gordon Brown unexpectedly resigned. Cameron's new role helped the conservative movement regain power after a 13-year hiatus. David Cameron is believed to be nearing an agreement on forming a coalition government with Nick Clegg’s Liberal Democrats. Negotiators for both their parties met after talks broke down between Brown's Labour Party and the Liberal Democrats.
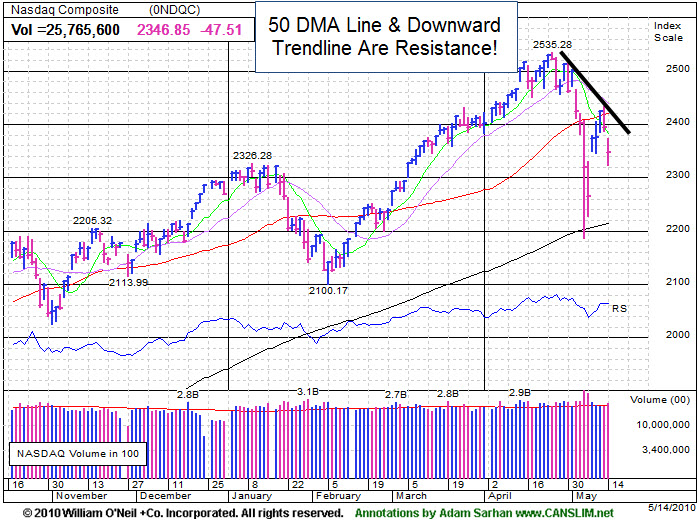
The major averages posted unanimous gains on Wednesday, extending their new rally effort after a flurry of healthy headlines from Europe were released. The Dow Jones Industrial Average and the tech-heavy Nasdaq Composite Index both closed above their respective 50-day moving average (DMA) lines leaving the benchmark S&P 500 Index and the NYSE composite below that important level. The fact that all the major averages did not close above their short term averages suggested a negative divergence was occurring and the fact that volume receded for a third straight day was also a worrisome sign.
The bears returned from a three day hiatus on Thursday afternoon and erased Wednesday's gains, sending the DJIA and the Nasdaq composite back below their respective 50 DMA lines. In addition, volume was heavy on the Nasdaq composite which was not a healthy sign. The highly influential financial group (Broker/Dealer Index) continues to lag its peers, evidenced by the lackluster action in several key names. Most of the major financial firms are now trading below both their respective 50 DMA and 200 DMA lines, which is another ominous sign. Stocks got smacked on Friday after news spread that French President Nicolas Sarkozy threatened to leave the EU if the trillion dollar bailout was not passed. What does all this mean for investors? Simple, the market is in a correction which reiterates the importance of adopting a defense stance until a new rally is confirmed. Trade accordingly.
Professional Money Management Services - Free Portfolio Review:
If your portfolio is greater than $100,000 and you would like a free portfolio review, click here to get connected with one of our portfolio managers. ** Serious inquires only, please.
PICTURED: The Nasdaq Composite pulled back on heavy volume after encountering resistance near its downward trendline & 50 DMA line.
|
|
|
 |
Gold & Silver Group Advances As Other Groups Fall
Adam Sarhan, Contributing Writer,
The Gold & Silver Index ($XAU +0.57%) edged higher on an otherwise negative day. Financial and technology groups dragged the major averages lower as the Bank Index ($BKX -3.18%), Semiconductor Index ($SOX -3.04%), Networking Index ($NWX -2.50%), Internet Index ($IIX -1.92%), the Broker/Dealer Index ($XBD -1.92%), and the Biotechnology Index ($BTK -1.81%) ended unanimously lower. Most defensive groups were also included among the widespread losses on Friday as the Healthcare Index ($HMO -0.18%), Oil Services Index ($OSX -2.25%), and Integrated Oil Index ($XOI -2.16%) fell. The influential Retail Index ($RLX -1.17%) rounded out a clearly negative session and a disappointing week of trading.
Charts courtesy www.stockcharts.com
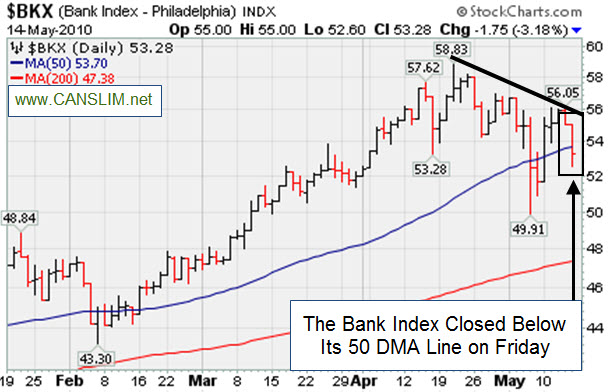
PICTURED: The Bank Index ($BKX -3.18%) violated, and closed below, its 50-day moving average (DMA) line on Friday.
| Oil Services |
$OSX |
193.33 |
-4.44 |
-2.25% |
-0.82% |
| Healthcare |
$HMO |
1,503.53 |
-2.69 |
-0.18% |
+2.08% |
| Integrated Oil |
$XOI |
1,007.76 |
-22.23 |
-2.16% |
-5.66% |
| Semiconductor |
$SOX |
353.86 |
-11.10 |
-3.04% |
-1.68% |
| Networking |
$NWX |
248.92 |
-6.37 |
-2.50% |
+7.73% |
| Internet |
$IIX |
243.55 |
-4.77 |
-1.92% |
+4.14% |
| Broker/Dealer |
$XBD |
112.94 |
-2.21 |
-1.92% |
-1.83% |
| Retail |
$RLX |
454.87 |
-5.37 |
-1.17% |
+10.64% |
| Gold & Silver |
$XAU |
183.80 |
+1.04 |
+0.57% |
+9.24% |
| Bank |
$BKX |
53.28 |
-1.75 |
-3.18% |
+24.75% |
| Biotech |
$BTK |
1,085.62 |
-20.06 |
-1.81% |
+15.23% |
|
|
|
 |
Negative Reversal Following Great Run and 10:1 Split
Kenneth J. Gruneisen - Passed the CAN SLIM® Master's Exam
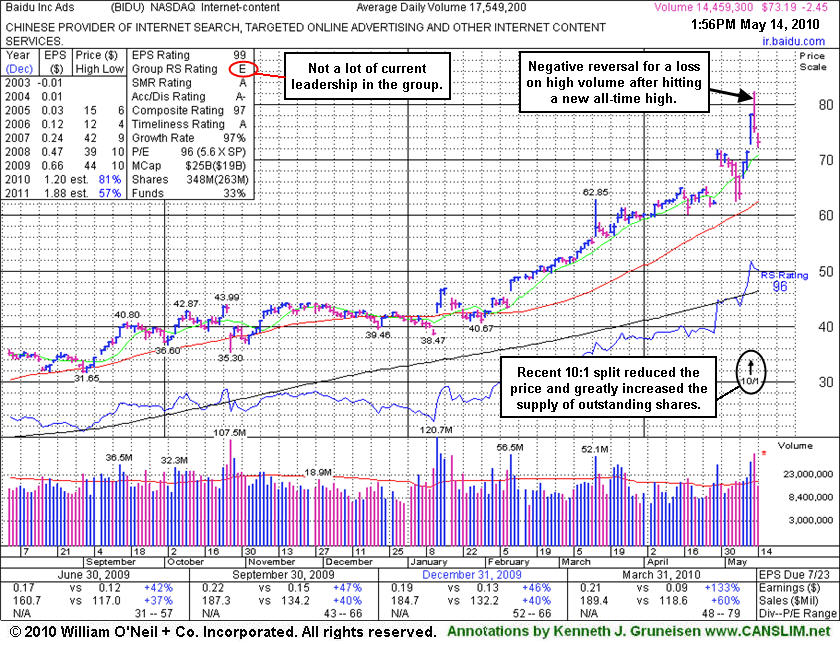
Baidu.com, Inc. (BIDU -$1.66 or -2.19% to $73.98) gapped down today after a worrisome negative reversal from its all-time high on the prior session. It is extended from any sound base following a big gap up gain on 5/12/10 as a 10:1 stock split occurred. Last week's loss broke a 13-week winning streak. Its last FSU section appearance on 4/20/10 under the headline "Higher Volume Totals Would Be More Telling" recognized that it was - "Repeatedly noted as extended from any sound base after 10 consecutive weekly gains, however it could produce more climactic gains, especially due to the small supply (S criteria) of shares outstanding.
The recent split reduced the share price and greatly increased the supply of shares outstanding. The high-ranked Internet- Content firm saw a slight decline in the number of top-rated funds owning shares from 204 in Dec '09 to 198 in Mar '10. It still has a stellar sales and earnings history that satisfies the C & A criteria, in fact, the quarter ended March 31, 2010 showed sales revenues and earnings growth accelerating impressively. The current market (M criteria) conditions have been calling for investors to lock in gains and raise cash. Until a follow-through-day from one of the major indices confirms a new rally great caution is advised, as the current market correction could last longer and cause more technical damage.
BIDU has traded up more than 8-fold, but it has not been a smooth ride since it first featured on Monday, October 30, 2006 in the CANSLIM.net Mid Day Breakouts Report (read here). After making great progress it went through a multi-month consolidation under its 50 and 20 DMA lines, then later returned as a noteworthy leader featured in CANSLIM.net reports. An annotated graph showed a vivid picture at the beginning of the stock's period of greatest weakness back on January 11, 2008 under the headline, "Weakness Hurting Chances For Featured Favorite" (read here). Take a look back at that now! Remember that a dropped stock can be featured again in a future CANSLIM.net report if it repairs its technical damage and forms a new pivot point.
|
|
|
Color Codes Explained :
Y - Better candidates highlighted by our
staff of experts.
G - Previously featured
in past reports as yellow but may no longer be buyable under the
guidelines.
***Last / Change / Volume data in this table is the closing quote data***
Symbol/Exchange
Company Name
Industry Group |
PRICE |
CHANGE
(%Change) |
Day High |
Volume
(% DAV)
(% 50 day avg vol) |
52 Wk Hi
% From Hi |
Featured
Date |
Price
Featured |
Pivot Featured |
|
Max Buy |
BIDU
-
NASDAQ
Baidu Inc Ads
INTERNET - Internet Information Providers
|
$73.98
|
-1.66
-2.19% |
$74.81
|
19,529,970
111.29% of 50 DAV
50 DAV is 17,549,200
|
$82.29
-10.10%
|
1/13/2010
|
$431.25
|
PP = $426.75
|
|
MB = $448.09
|
 Most Recent Note - 5/14/2010 2:04:24 PM
G - Gapped down today after a worrisome negative reversal from its all-time high on the prior session. It is extended from any sound base following a big gap up gain on 5/12/10 as a 10:1 stock split occurred. Last week's loss broke a 13 week winning streak. Prior notes mentioned its small supply of shares as a factor that might contribute to more climactic gains. It is clear of resistance due to overhead supply.
 >>> The latest Featured Stock Update with an annotated graph appeared on 4/20/2010. Click here. >>> The latest Featured Stock Update with an annotated graph appeared on 4/20/2010. Click here.
View all notes |
Alert me of new notes |
CANSLIM.net Company Profile
|
BPI
-
NYSE
Bridgepoint Education
DIVERSIFIED SERVICES - Education and; Training Services
|
$23.92
|
-1.17
-4.66% |
$25.00
|
282,403
57.07% of 50 DAV
50 DAV is 494,800
|
$27.50
-13.02%
|
4/13/2010
|
$25.59
|
PP = $25.76
|
|
MB = $27.05
|
Most Recent Note - 5/14/2010 2:08:22 PM
G - Quiet consolidation all week near its 50 DMA line. Recent chart low ($22.75) defines near-term chart support.
>>> The latest Featured Stock Update with an annotated graph appeared on 5/7/2010. Click here.
View all notes |
Alert me of new notes |
CANSLIM.net Company Profile
|
BRLI
-
NASDAQ
Bio Reference Labs Inc
HEALTH SERVICES - Medical Laboratories and Researc
|
$24.02
|
-0.24
-0.99% |
$24.62
|
293,587
154.93% of 50 DAV
50 DAV is 189,500
|
$24.67
-2.65%
|
2/12/2010
|
$39.02
|
PP = $20.49
|
|
MB = $21.51
|
Most Recent Note - 5/14/2010 2:16:20 PM
G - Perched near all-time highs today after rallying steadily since a gap up on 5/10/10. Promptly rallied back after violations of its 50 DMA line and 3/26/10 low triggered technical sell signals.
>>> The latest Featured Stock Update with an annotated graph appeared on 5/11/2010. Click here.
View all notes |
Alert me of new notes |
CANSLIM.net Company Profile
|
CISG
-
NASDAQ
Cninsure Inc Ads
INSURANCE - Insurance Brokers
|
$27.03
|
-0.02
-0.07% |
$27.47
|
252,417
99.57% of 50 DAV
50 DAV is 253,500
|
$28.62
-5.56%
|
3/3/2010
|
$24.38
|
PP = $23.10
|
|
MB = $24.26
|
Most Recent Note - 5/14/2010 2:18:54 PM
G - This week's rebound above its 50 DMA line helped its outlook improve, and it is now forming a new base-on-base type pattern.
>>> The latest Featured Stock Update with an annotated graph appeared on 5/12/2010. Click here.
View all notes |
Alert me of new notes |
CANSLIM.net Company Profile
|
CRM
-
NYSE
Salesforce.Com Inc
INTERNET - Internet Software and Services
|
$84.72
|
-1.96
-2.26% |
$86.14
|
1,976,231
113.19% of 50 DAV
50 DAV is 1,745,900
|
$89.84
-5.70%
|
3/5/2010
|
$72.28
|
PP = $75.53
|
|
MB = $79.31
|
Most Recent Note - 5/14/2010 2:20:33 PM
G - Gapped down today following a negative reversal after reaching a new all-time high on the prior session. Its gap up on 5/10/10 promptly repaired a brief violation of its 50 DMA line, a sign of great institutional support.
>>> The latest Featured Stock Update with an annotated graph appeared on 4/21/2010. Click here.
View all notes |
Alert me of new notes |
CANSLIM.net Company Profile
|
Symbol/Exchange
Company Name
Industry Group |
PRICE |
CHANGE
(%Change) |
Day High |
Volume
(% DAV)
(% 50 day avg vol) |
52 Wk Hi
% From Hi |
Featured
Date |
Price
Featured |
Pivot Featured |
|
Max Buy |
LL
-
NYSE
Lumber Liquidators Hldgs
RETAIL - Home Improvement Stores
|
$29.73
|
-0.65
-2.14% |
$30.16
|
297,776
77.61% of 50 DAV
50 DAV is 383,700
|
$33.41
-11.01%
|
4/22/2010
|
$29.87
|
PP = $29.03
|
|
MB = $30.48
|
Most Recent Note - 5/14/2010 2:22:47 PM
G - Gapped down today after a negative reversal with light volume on the prior session. Found support above its 50 DMA line and promptly rebounded back above its December 2009 highs.
>>> The latest Featured Stock Update with an annotated graph appeared on 4/26/2010. Click here.
View all notes |
Alert me of new notes |
CANSLIM.net Company Profile
|
LOPE
-
NASDAQ
Grand Canyon Education
DIVERSIFIED SERVICES - Education and; Training Services
|
$24.26
|
-0.75
-3.00% |
$25.33
|
165,106
44.53% of 50 DAV
50 DAV is 370,800
|
$28.46
-14.76%
|
4/13/2010
|
$27.71
|
PP = $27.33
|
|
MB = $28.70
|
Most Recent Note - 5/14/2010 2:25:53 PM
G - Down again today, its 4/29/10 low of $23.66 is the next important chart support. Meanwhile, its 50 DMA line has recently been acting as resistance.
>>> The latest Featured Stock Update with an annotated graph appeared on 5/10/2010. Click here.
View all notes |
Alert me of new notes |
CANSLIM.net Company Profile
|
MELI
-
NASDAQ
Mercadolibre Inc
INTERNET - Internet Software and; Services
|
$51.28
|
-1.77
-3.34% |
$52.64
|
562,729
96.94% of 50 DAV
50 DAV is 580,500
|
$55.75
-8.02%
|
5/13/2010
|
$54.21
|
PP = $55.85
|
|
MB = $58.64
|
Most Recent Note - 5/14/2010 3:05:32 PM
Y - Gapped down today following a negative reversal after trading up to within 5 cents of its 52-week high. It was featured in the 5/13/10 mid-day report (read here) in yellow with pivot point based upon its 12/28/09 high plus ten cents. The Latin American Internet - eCommerce firm had top-rated funds owning an interest rise from 62 in Dec '08 to 102 in Mar '10, which is encouraging concerning the I criteria. Its strong quarterly earnings and annual earnings history satisfy the C and A criteria.
>>> The latest Featured Stock Update with an annotated graph appeared on 5/13/2010. Click here.
View all notes |
Alert me of new notes |
CANSLIM.net Company Profile
|
ROVI
-
NASDAQ
Rovi Corp
COMPUTER SOFTWARE andamp; SERVICES - Security Software andamp; Services
|
$39.43
|
-0.10
-0.25% |
$39.90
|
2,657,909
201.54% of 50 DAV
50 DAV is 1,318,800
|
$40.06
-1.57%
|
4/20/2010
|
$37.62
|
PP = $38.60
|
|
MB = $40.53
|
Most Recent Note - 5/14/2010 12:47:01 PM
G - Hovering near its 52-week high, clear of virtually all chart resistance. Its rebound above its 50 DMA line was noted as an encouraging technical improvement. Last week's low ($33.17) defines near-term chart support above its 200 DMA line.
>>> The latest Featured Stock Update with an annotated graph appeared on 5/5/2010. Click here.
View all notes |
Alert me of new notes |
CANSLIM.net Company Profile
|
SIRO
-
NASDAQ
Sirona Dental Systems
HEALTH SERVICES - Medical Instruments andamp; Supplies
|
$38.54
|
-0.41
-1.05% |
$38.69
|
517,290
83.18% of 50 DAV
50 DAV is 621,900
|
$43.45
-11.30%
|
2/16/2010
|
$36.43
|
PP = $36.15
|
|
MB = $37.96
|
Most Recent Note - 5/14/2010 3:08:12 PM
G - Gapped down for a small loss today on light volume while sinking below its 50 DMA line which is acting as resistance. On 5/05/10 it endured heavy distributional pressure after reporting +231% earnings on +15% sales revenues for the quarter ended March 31, 2010 versus the year ago period.
>>> The latest Featured Stock Update with an annotated graph appeared on 4/22/2010. Click here.
View all notes |
Alert me of new notes |
CANSLIM.net Company Profile
|
Symbol/Exchange
Company Name
Industry Group |
PRICE |
CHANGE
(%Change) |
Day High |
Volume
(% DAV)
(% 50 day avg vol) |
52 Wk Hi
% From Hi |
Featured
Date |
Price
Featured |
Pivot Featured |
|
Max Buy |
SUMR
-
NASDAQ
Summer Infant Inc
CONSUMER NON-DURABLES - Personal Products
|
$7.43
|
+0.09
1.23% |
$7.58
|
89,477
166.31% of 50 DAV
50 DAV is 53,800
|
$7.75
-4.13%
|
5/4/2010
|
$6.85
|
PP = $7.09
|
|
MB = $7.44
|
Most Recent Note - 5/14/2010 3:11:11 PM
Y - Pulling back toward prior chart highs which may now act as a support level. Considerable gain on 5/12/10 helped it rally above its pivot point for a new 52-week high with volume more than triple its average daily trading total triggering a technical buy signal. Disciplined investors will remain cautious until a follow-through-day confirms the market's (M criteria) new rally effort.
>>> The latest Featured Stock Update with an annotated graph appeared on 5/4/2010. Click here.
View all notes |
Alert me of new notes |
CANSLIM.net Company Profile
|
ULTA
-
NASDAQ
Ulta Salon Cosm & Frag
SPECIALTY RETAIL - Specialty Retail, Other
|
$23.74
|
-0.44
-1.82% |
$24.23
|
240,672
54.96% of 50 DAV
50 DAV is 437,900
|
$25.76
-7.84%
|
3/12/2010
|
$22.81
|
PP = $21.72
|
|
MB = $22.81
|
Most Recent Note - 5/14/2010 3:14:07 PM
G - Down on lighter volume today following a negative reversal on 5/13/10 with higher volume. This week it rallied back above its 50 DMA line and January low, showing prompt and encouraging signs of support.
>>> The latest Featured Stock Update with an annotated graph appeared on 4/30/2010. Click here.
View all notes |
Alert me of new notes |
CANSLIM.net Company Profile
|
VIT
-
NYSE
Vanceinfo Tech Inc Ads
COMPUTER SOFTWARE and SERVICES - Business Software and Services
|
$22.46
|
-0.38
-1.66% |
$22.69
|
740,288
93.92% of 50 DAV
50 DAV is 788,200
|
$26.48
-15.18%
|
4/9/2010
|
$23.79
|
PP = $23.95
|
|
MB = $25.15
|
Most Recent Note - 5/14/2010 3:15:47 PM
G - Weak today following a gap down on 5/13/10 and violation of its 50 DMA line with a considerable loss on 3 times average volume after reporting strong sales and earnings increases for the quarter ended March 31, 2010. Recent lows in the $20 area define the next near term chart support above its 200 DMA line.
>>> The latest Featured Stock Update with an annotated graph appeared on 5/6/2010. Click here.
View all notes |
Alert me of new notes |
CANSLIM.net Company Profile
|
|
|
|
THESE ARE NOT BUY RECOMMENDATIONS!
Comments contained in the body of this report are technical
opinions only. The material herein has been obtained
from sources believed to be reliable and accurate, however,
its accuracy and completeness cannot be guaranteed.
This site is not an investment advisor, hence it does
not endorse or recommend any securities or other investments.
Any recommendation contained in this report may not
be suitable for all investors and it is not to be deemed
an offer or solicitation on our part with respect to
the purchase or sale of any securities. All trademarks,
service marks and trade names appearing in this report
are the property of their respective owners, and are
likewise used for identification purposes only.
This report is a service available
only to active Paid Premium Members.
You may opt-out of receiving report notifications
at any time. Questions or comments may be submitted
by writing to Premium Membership Services 665 S.E. 10 Street, Suite 201 Deerfield Beach, FL 33441-5634 or by calling 1-800-965-8307
or 954-785-1121.
|
|
|


