You are not logged in.
This means you
CAN ONLY VIEW reports that were published prior to Monday, April 14, 2025.
You
MUST UPGRADE YOUR MEMBERSHIP if you want to see any current reports.
AFTER MARKET UPDATE - THURSDAY, MAY 13TH, 2010
Previous After Market Report Next After Market Report >>>
|
|
|
|
DOW |
-113.96 |
10,782.95 |
-1.05% |
|
Volume |
1,203,813,400 |
-6% |
|
Volume |
2,238,145,140 |
+1% |
|
NASDAQ |
-30.66 |
2,394.36 |
-1.26% |
|
Advancers |
1,077 |
34% |
|
Advancers |
987 |
35% |
|
S&P 500 |
-14.23 |
1,157.44 |
-1.21% |
|
Decliners |
2,001 |
63% |
|
Decliners |
1,734 |
61% |
|
Russell 2000 |
-6.26 |
709.85 |
-0.87% |
|
52 Wk Highs |
96 |
|
|
52 Wk Highs |
118 |
|
|
S&P 600 |
-2.87 |
379.57 |
-0.75% |
|
52 Wk Lows |
6 |
|
|
52 Wk Lows |
14 |
|
|
 |
Decliners Outnumber Advancers As Financial Industry Faces Scrutiny
Adam Sarhan, Contributing Writer,
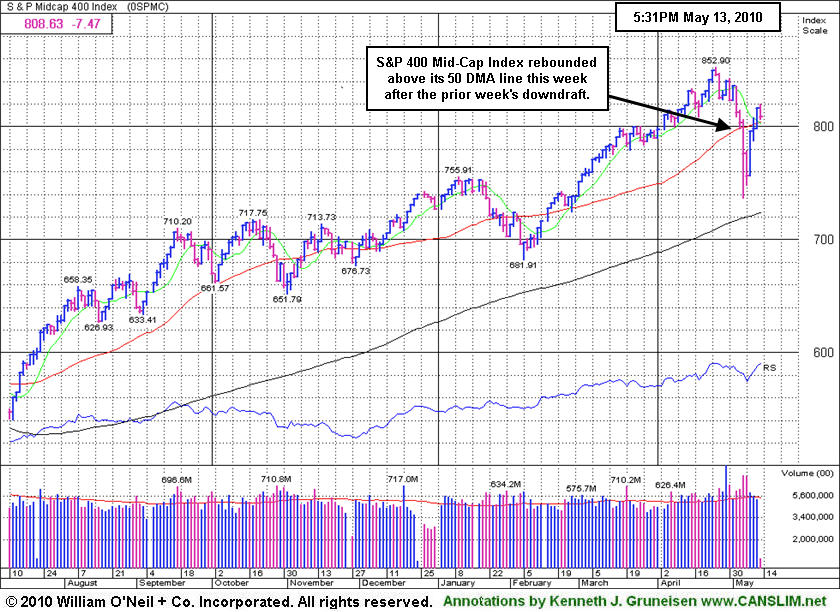
The major averages traded in positive territory early but slumped in the late afternoon Thursday as the Nasdaq Composite Index and Dow Jones Industrial Average both encountered resistance and slumped back below their respective 50-day moving average (DMA) lines. Volume totals were reported slightly lower on the Nasdaq and very near the but just above the NYSE's Wednesday total. Decliners led advancers by about a 2-to-1 ratio on the NYSE and on the Nasdaq exchange. New 52-week highs outnumbered new 52-week lows on the NYSE and on the Nasdaq exchange. There were 25 high-ranked companies from the CANSLIM.net Leaders List that made a new 52-week high and appeared on the CANSLIM.net BreakOuts Page, matching the 25 issues that appeared on the prior session. New leadership is a critical part of any rally effort, and while disciplined investors are awaiting a follow-through-day from at least one of the major averages it is somewhat reassuring to see the new highs list expanding.
Financial stocks faced pressure after a report showed a Federal investigation into mortgage-related bond deals. New York prosecutors are probing eight major Wall Street firms over whether they misled rating companies about mortgage-backed securities. In recent weeks, rating agencies have suffered tremendous criticism over their role in the financial crisis. It is disconcerting to see the highly influential financial group (Broker/Dealer Index) continue to lag its peers, evidenced by the lackluster action in several key names. Most of the major financial firms are now trading below both their respective 50 DMA and 200 DMA lines, which is not an healthy sign.
So far, +77% of S&P 500 companies beat analyst profit estimates during the first quarter. This is one of the strongest quarterly results in the past decade and bodes well for the ongoing economic recovery. Remember that in late 2009, the S&P 500 snapped a record nine-quarter losing streak in earnings which illustrated how weak the economy was since 2007. However, the fact that earnings have turned higher bodes well for the current recovery.
Thursday marked Day 4 of the current rally attempt which means that as long as Monday's lows are not breached the window is now open for a proper follow-through-day (FTD) to emerge. In order for a proper FTD to emerge one would have to see at least one of the major averages rally at least +1.7% on higher volume than the prior session as a new batch of high ranked leaders trigger fresh technical buy signals. Once that occurs, then the current rally attempt will be confirmed and the ideal window for accumulating high-ranked stocks will be open again. However, if Monday's lows are breached, then the day count will be reset. Trade accordingly.
Professional Money Management Services - Free Portfolio Review:
If your portfolio is greater than $100,000 and you would like a free portfolio review, click here to get connected with one of our portfolio managers. ** Serious inquires only, please.
PICTURED: The S&P 400 Mid-Cap Index fell today, but it remains above its 50 DMA line after this week's gains helped it rally back above that important short-term average.
|
|
|
 |
Healthcare Group Meandering Since New Legislation Passed
Kenneth J. Gruneisen - Passed the CAN SLIM® Master's Exam
Weak action in the Retail Index ($RLX -2.98%) and big losses from the tech sector's Semiconductor Index ($SOX -2.70%) and Networking Index ($NWX -2.64%) put the most pressure on the major averages on Thursday. There were modest losses in the Internet Index ($IIX -0.93%) and Biotechnology Index ($BTK -0.53%). The Bank Index ($BKX -1.54%) was the weaker of the financial indexes regularly followed in this IGW section, while the Broker/Dealer Index ($XBD -0.38%) ended with a small loss. Defensive groups also fell as the Gold & Silver Index ($XAU -1.77%), Healthcare Index ($HMO -0.55%), and energy-related Oil Services Index ($OSX -1.04%) and Integrated Oil Index ($XOI -0.88%) finished unanimously lower.
Charts courtesy www.stockcharts.com
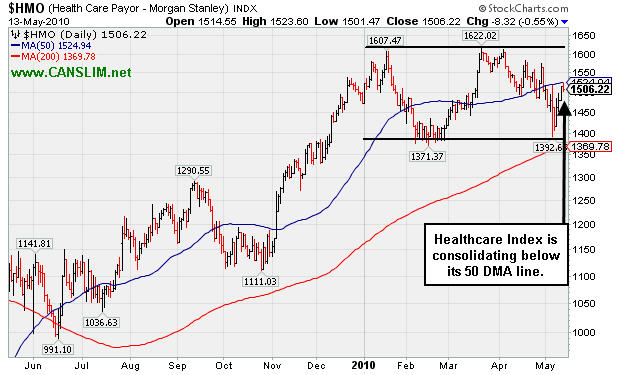
PICTURED: The Healthcare Index ($HMO -0.55%) is consolidating below its 50-day moving average (DMA) line and meandering in the middle of this year's trading range, not showing particularly decisive action since President Obama signed new healthcare legislation.
| Oil Services |
$OSX |
197.77 |
-2.07 |
-1.04% |
+1.46% |
| Healthcare |
$HMO |
1,506.22 |
-8.32 |
-0.55% |
+2.26% |
| Integrated Oil |
$XOI |
1,029.99 |
-9.16 |
-0.88% |
-3.58% |
| Semiconductor |
$SOX |
364.96 |
-10.12 |
-2.70% |
+1.40% |
| Networking |
$NWX |
255.29 |
-6.93 |
-2.64% |
+10.48% |
| Internet |
$IIX |
248.31 |
-2.33 |
-0.93% |
+6.18% |
| Broker/Dealer |
$XBD |
115.15 |
-0.44 |
-0.38% |
+0.09% |
| Retail |
$RLX |
460.24 |
-14.15 |
-2.98% |
+11.95% |
| Gold & Silver |
$XAU |
182.76 |
-3.30 |
-1.77% |
+8.62% |
| Bank |
$BKX |
55.03 |
-0.86 |
-1.54% |
+28.85% |
| Biotech |
$BTK |
1,105.68 |
-5.89 |
-0.53% |
+17.36% |
|
|
|
 |
Put Latin-American Internet - eCommerce Firm On Watch List
Kenneth J. Gruneisen - Passed the CAN SLIM® Master's Exam
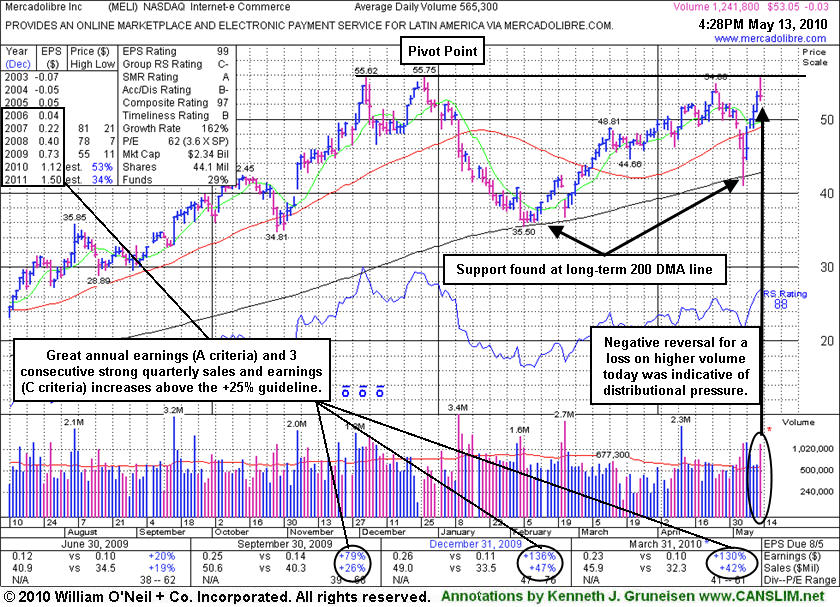
Mercadolibre Inc. (MELI -$0.03 or -0.06% to $53.05) negatively reversed for a loss on higher volume today, an indication it was encountering more distributional pressure while challenging previously stubborn resistance. The Latin American Internet - eCommerce firm was featured in yellow in today's mid-day report (read here) and noted as it traded within 5 cents of its 52-week high. It rallied back impressively from last week's test of support at its long-term 200-day moving average (DMA) line. That long-time average acted as a firm support level in the early part of the year. The high-ranked leader's pivot point is based upon its 12/28/09 high plus ten cents. Top-rated funds owning an interest rose from 62 in Dec '08 to 102 in Mar '10, which is encouraging concerning the I criteria. Its strong quarterly earnings and annual earnings history satisfy the C and A criteria. Disciplined investors will watch for a proper technical buy signal. It is an ideal candidate for one's watch list while awaiting the new rally effort's confirmation in the form of a sound follow-through day of gains from at least one of the major averages on higher volume.
|
|
|
Color Codes Explained :
Y - Better candidates highlighted by our
staff of experts.
G - Previously featured
in past reports as yellow but may no longer be buyable under the
guidelines.
***Last / Change / Volume data in this table is the closing quote data***
Symbol/Exchange
Company Name
Industry Group |
PRICE |
CHANGE
(%Change) |
Day High |
Volume
(% DAV)
(% 50 day avg vol) |
52 Wk Hi
% From Hi |
Featured
Date |
Price
Featured |
Pivot Featured |
|
Max Buy |
BIDU
-
NASDAQ
Baidu Inc Ads
INTERNET - Internet Information Providers
|
$75.64
|
-2.57
-3.28% |
$82.29
|
58,783,777
355.85% of 50 DAV
50 DAV is 16,519,200
|
$78.36
-3.47%
|
1/13/2010
|
$431.25
|
PP = $426.75
|
|
MB = $448.09
|
 Most Recent Note - 5/13/2010 5:58:45 PM
G - Negative reversal today for a loss on high volume after early gains for a new all-time high. It is extended from any sound base following a big gap up gain on 5/12/10 as a 10:1 stock split occurred. Last week's loss broke a 13 week winning streak. Prior notes mentioned its small supply of shares as a factor that might contribute to more climactic gains. It is clear of resistance due to overhead supply.
 >>> The latest Featured Stock Update with an annotated graph appeared on 4/20/2010. Click here. >>> The latest Featured Stock Update with an annotated graph appeared on 4/20/2010. Click here.
View all notes |
Alert me of new notes |
CANSLIM.net Company Profile
|
BPI
-
NYSE
Bridgepoint Education
DIVERSIFIED SERVICES - Education and; Training Services
|
$25.09
|
+0.29
1.17% |
$25.72
|
240,145
47.45% of 50 DAV
50 DAV is 506,100
|
$27.50
-8.76%
|
4/13/2010
|
$25.59
|
PP = $25.76
|
|
MB = $27.05
|
Most Recent Note - 5/11/2010 4:12:37 PM
G - Consolidating above its 50 DMA line, its recent chart low ($22.75) defines near-term chart support. The Commercial Services - Schools firm was featured in yellow in the 4/13/10 mid-day report (read here) as rose from a cup-with-high-handle.
>>> The latest Featured Stock Update with an annotated graph appeared on 5/7/2010. Click here.
View all notes |
Alert me of new notes |
CANSLIM.net Company Profile
|
BRLI
-
NASDAQ
Bio Reference Labs Inc
HEALTH SERVICES - Medical Laboratories and Researc
|
$24.26
|
+1.15
4.98% |
$24.29
|
295,276
154.27% of 50 DAV
50 DAV is 191,400
|
$24.67
-1.68%
|
2/12/2010
|
$39.02
|
PP = $20.49
|
|
MB = $21.51
|
Most Recent Note - 5/13/2010 6:00:47 PM
G - Considerable gain today with above average volume for its 2nd best close ever. Gapped up on 5/10/10 and promptly rallied back above its 3/26/10 low.
>>> The latest Featured Stock Update with an annotated graph appeared on 5/11/2010. Click here.
View all notes |
Alert me of new notes |
CANSLIM.net Company Profile
|
CISG
-
NASDAQ
Cninsure Inc Ads
INSURANCE - Insurance Brokers
|
$27.05
|
-0.11
-0.41% |
$27.75
|
272,758
99.04% of 50 DAV
50 DAV is 275,400
|
$28.62
-5.49%
|
3/3/2010
|
$24.38
|
PP = $23.10
|
|
MB = $24.26
|
Most Recent Note - 5/13/2010 6:02:15 PM
G - Held up above its 50 DMA line today after a rebound above that short-term average helped its outlook improve.
>>> The latest Featured Stock Update with an annotated graph appeared on 5/12/2010. Click here.
View all notes |
Alert me of new notes |
CANSLIM.net Company Profile
|
CRM
-
NYSE
Salesforce.Com Inc
INTERNET - Internet Software and Services
|
$86.68
|
-1.72
-1.95% |
$89.84
|
2,831,409
164.70% of 50 DAV
50 DAV is 1,719,100
|
$89.50
-3.15%
|
3/5/2010
|
$72.28
|
PP = $75.53
|
|
MB = $79.31
|
Most Recent Note - 5/13/2010 6:03:07 PM
G - Reversed into the red after touching a new all-time high earlier today. Its gap up on 5/10/10 promptly repaired a brief violation of its 50 DMA line, a sign of great institutional support.
>>> The latest Featured Stock Update with an annotated graph appeared on 4/21/2010. Click here.
View all notes |
Alert me of new notes |
CANSLIM.net Company Profile
|
Symbol/Exchange
Company Name
Industry Group |
PRICE |
CHANGE
(%Change) |
Day High |
Volume
(% DAV)
(% 50 day avg vol) |
52 Wk Hi
% From Hi |
Featured
Date |
Price
Featured |
Pivot Featured |
|
Max Buy |
LL
-
NYSE
Lumber Liquidators Hldgs
RETAIL - Home Improvement Stores
|
$30.38
|
-0.87
-2.78% |
$31.99
|
228,315
58.11% of 50 DAV
50 DAV is 392,900
|
$33.41
-9.07%
|
4/22/2010
|
$29.87
|
PP = $29.03
|
|
MB = $30.48
|
Most Recent Note - 5/13/2010 6:04:56 PM
G - Reversed into the red today after early gains. It found support above its 50 DMA line las week and promptly rebounded back above its December 2009 highs. First featured in yellow at $29.87 in the 4/22/10 the mid-day report (read here).
>>> The latest Featured Stock Update with an annotated graph appeared on 4/26/2010. Click here.
View all notes |
Alert me of new notes |
CANSLIM.net Company Profile
|
LOPE
-
NASDAQ
Grand Canyon Education
DIVERSIFIED SERVICES - Education and; Training Services
|
$25.01
|
-0.21
-0.83% |
$25.68
|
193,210
51.76% of 50 DAV
50 DAV is 373,300
|
$28.46
-12.12%
|
4/13/2010
|
$27.71
|
PP = $27.33
|
|
MB = $28.70
|
Most Recent Note - 5/13/2010 6:06:12 PM
G - Its 50 DMA line has recently been acting as resistance. Many for-profit schools have encountered distributional pressure in the wake of recently proposed regulatory changes.
>>> The latest Featured Stock Update with an annotated graph appeared on 5/10/2010. Click here.
View all notes |
Alert me of new notes |
CANSLIM.net Company Profile
|
MELI
-
NASDAQ
Mercadolibre Inc
INTERNET - Internet Software and; Services
|
$53.05
|
-0.03
-0.06% |
$55.70
|
1,242,790
219.85% of 50 DAV
50 DAV is 565,300
|
$55.75
-4.84%
|
5/13/2010
|
$54.21
|
PP = $55.85
|
|
MB = $58.64
|
Most Recent Note - 5/13/2010 6:31:29 PM
Y - Today it negatively reversed after trading up to within 5 cents of its 52-week high. It was featured in the mid-day report (read here) in yellow with pivot point based upon its 12/28/09 high plus ten cents. The Latin American Internet - eCommerce firm had top-rated funds owning an interest rise from 62 in Dec '08 to 102 in Mar '10, which is encouraging concerning the I criteria. Its strong quarterly earnings and annual earnings history satisfy the C and A criteria.
>>> The latest Featured Stock Update with an annotated graph appeared on 5/13/2010. Click here.
View all notes |
Alert me of new notes |
CANSLIM.net Company Profile
|
ROVI
-
NASDAQ
Rovi Corp
COMPUTER SOFTWARE andamp; SERVICES - Security Software andamp; Services
|
$39.53
|
+1.34
3.51% |
$39.85
|
2,167,455
167.95% of 50 DAV
50 DAV is 1,290,500
|
$40.06
-1.32%
|
4/20/2010
|
$37.62
|
PP = $38.60
|
|
MB = $40.53
|
Most Recent Note - 5/13/2010 6:40:23 PM
G - Today's second consecutive gain on above above average volume has it near its 52-week high and clear of virtually all chart resistance. Its rebound above its 50 DMA line was noted as an encouraging technical improvement. Last week's low ($33.17) defines near-term chart support above its 200 DMA line.
>>> The latest Featured Stock Update with an annotated graph appeared on 5/5/2010. Click here.
View all notes |
Alert me of new notes |
CANSLIM.net Company Profile
|
SIRO
-
NASDAQ
Sirona Dental Systems
HEALTH SERVICES - Medical Instruments andamp; Supplies
|
$38.95
|
+0.79
2.07% |
$39.78
|
703,302
113.64% of 50 DAV
50 DAV is 618,900
|
$43.45
-10.36%
|
2/16/2010
|
$36.43
|
PP = $36.15
|
|
MB = $37.96
|
Most Recent Note - 5/13/2010 6:41:17 PM
G - Gain today helped it close just above its 50 DMA line. On 5/05/10 it endured heavy distributional pressure after reporting +231% earnings on +15% sales revenues for the quarter ended March 31, 2010 versus the year ago period.
>>> The latest Featured Stock Update with an annotated graph appeared on 4/22/2010. Click here.
View all notes |
Alert me of new notes |
CANSLIM.net Company Profile
|
Symbol/Exchange
Company Name
Industry Group |
PRICE |
CHANGE
(%Change) |
Day High |
Volume
(% DAV)
(% 50 day avg vol) |
52 Wk Hi
% From Hi |
Featured
Date |
Price
Featured |
Pivot Featured |
|
Max Buy |
SUMR
-
NASDAQ
Summer Infant Inc
CONSUMER NON-DURABLES - Personal Products
|
$7.34
|
-0.25
-3.29% |
$7.73
|
74,867
141.53% of 50 DAV
50 DAV is 52,900
|
$7.75
-5.29%
|
5/4/2010
|
$6.85
|
PP = $7.09
|
|
MB = $7.44
|
Most Recent Note - 5/13/2010 6:43:52 PM
Y - Pulled back today, closing just below its max buy level. Considerable gain on 5/12/10 helped it rally above its pivot point for a new 52-week high with volume more than triple its average daily trading total triggering a technical buy signal. Disciplined investors will remain cautious until a follow-through-day confirms the market's (M criteria) new rally effort.
>>> The latest Featured Stock Update with an annotated graph appeared on 5/4/2010. Click here.
View all notes |
Alert me of new notes |
CANSLIM.net Company Profile
|
ULTA
-
NASDAQ
Ulta Salon Cosm & Frag
SPECIALTY RETAIL - Specialty Retail, Other
|
$24.18
|
-0.52
-2.11% |
$25.40
|
476,231
109.10% of 50 DAV
50 DAV is 436,500
|
$25.76
-6.13%
|
3/12/2010
|
$22.81
|
PP = $21.72
|
|
MB = $22.81
|
Most Recent Note - 5/13/2010 6:46:31 PM
G - Negatively reversed for a loss today on higher volume after early gains. On 5/10/10 it rallied back above its 50 DMA line and January low, showing prompt and encouraging signs of support.
>>> The latest Featured Stock Update with an annotated graph appeared on 4/30/2010. Click here.
View all notes |
Alert me of new notes |
CANSLIM.net Company Profile
|
VIT
-
NYSE
Vanceinfo Tech Inc Ads
COMPUTER SOFTWARE and SERVICES - Business Software and Services
|
$22.84
|
-2.15
-8.60% |
$24.00
|
2,353,372
312.37% of 50 DAV
50 DAV is 753,400
|
$26.48
-13.75%
|
4/9/2010
|
$23.79
|
PP = $23.95
|
|
MB = $25.15
|
Most Recent Note - 5/13/2010 6:47:23 PM
G - Gapped down today and violated its 50 DMA line with a considerable loss on 3 times average volume after reporting strong sales and earnings increases for the quarter ended March 31, 2010. Recent lows in the $20 area define the next near term chart support above its 200 DMA line.
>>> The latest Featured Stock Update with an annotated graph appeared on 5/6/2010. Click here.
View all notes |
Alert me of new notes |
CANSLIM.net Company Profile
|
|
|
|
THESE ARE NOT BUY RECOMMENDATIONS!
Comments contained in the body of this report are technical
opinions only. The material herein has been obtained
from sources believed to be reliable and accurate, however,
its accuracy and completeness cannot be guaranteed.
This site is not an investment advisor, hence it does
not endorse or recommend any securities or other investments.
Any recommendation contained in this report may not
be suitable for all investors and it is not to be deemed
an offer or solicitation on our part with respect to
the purchase or sale of any securities. All trademarks,
service marks and trade names appearing in this report
are the property of their respective owners, and are
likewise used for identification purposes only.
This report is a service available
only to active Paid Premium Members.
You may opt-out of receiving report notifications
at any time. Questions or comments may be submitted
by writing to Premium Membership Services 665 S.E. 10 Street, Suite 201 Deerfield Beach, FL 33441-5634 or by calling 1-800-965-8307
or 954-785-1121.
|
|
|


