You are not logged in.
This means you
CAN ONLY VIEW reports that were published prior to Monday, February 26, 2024.
You
MUST UPGRADE YOUR MEMBERSHIP if you want to see any current reports.
AFTER MARKET UPDATE - TUESDAY, MAY 12TH, 2020
Previous After Market Report Next After Market Report >>>
|
|
|
|
DOW |
-457.21 |
23,764.78 |
-1.89% |
|
Volume |
939,508,509 |
-6% |
|
Volume |
4,310,530,800 |
+12% |
|
NASDAQ |
-189.79 |
9,002.55 |
-2.06% |
|
Advancers |
691 |
24% |
|
Advancers |
921 |
28% |
|
S&P 500 |
-60.20 |
2,870.12 |
-2.05% |
|
Decliners |
2,177 |
76% |
|
Decliners |
2,317 |
72% |
|
Russell 2000 |
-45.70 |
1,275.54 |
-3.46% |
|
52 Wk Highs |
36 |
|
|
52 Wk Highs |
116 |
|
|
S&P 600 |
-28.02 |
728.74 |
-3.70% |
|
52 Wk Lows |
25 |
|
|
52 Wk Lows |
43 |
|
|
 |
Major Indices Slumped in Late Afternoon
Kenneth J. Gruneisen - Passed the CAN SLIM® Master's Exam
The Dow lost 457 points, while the S&P 500 declined 2.1%. The Nasdaq Composite was also down 2.1%, snapping a six-session winning streak which had been its longest stretch of gains this year. Breadth was negative as decliners led advancers by a 3-1 margin on the NYSE and 11-4 on the Nasdaq exchange. The reported volume totals were mixed, lighter than the prior session on the NYSE and higher on the Nasdaq exchange. There were 39 high-ranked companies from the Leaders List that hit new 52-week highs and were listed on the BreakOuts Page, versus 49 on the prior session. New 52-week highs outnumbered new lows totals on the NYSE and on the Nasdaq exchange. The major indices are in a confirmed uptrend (M criteria). Any sustainable rally requires a healthy crop of new leaders, so the latest improvement is a reassuring sign. Charts used courtesy of www.stockcharts.com
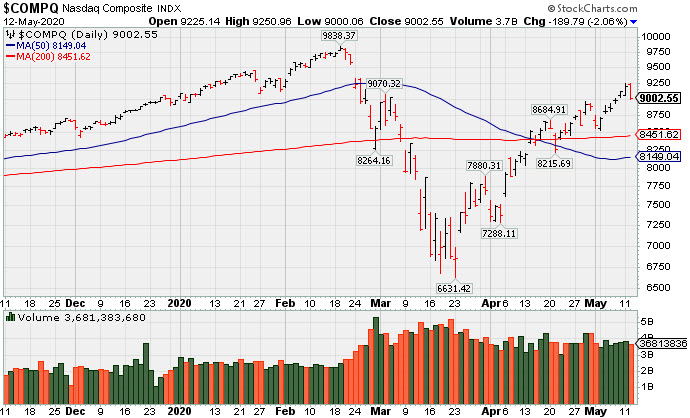
PICTURED: The Nasdaq Composite Index rebounded above its 50-day and 200-day moving average (DMA) lines from the March low. The pullback on Tuesday leaves it -8.5% off its record high hit on 2/19/20.
Stocks finished lower in choppy trading Tuesday as investors digested downbeat COVID-19 rhetoric and weighed the possibility of a resurgence in infections as more American states eased lockdown measures. Top U.S. infectious disease official, Dr. Anthony Fauci, warned the Senate Health Committee against reopening prematurely, cautioning that acting too quickly could further delay an economic rebound.
On the data front, an update showed core CPI (ex-food and energy) fell 0.4% in April, the largest monthly drop on record. The headline figure declined the most since 2008, though the 0.8% slide matched consensus forecasts. In central bank news, the New York Fed announced plans to purchase corporate bond ETFs, expanding efforts to support the economy. Treasuries ended higher, with the yield on the 10-year note down four basis points to 0.67%. In commodities, WTI crude climbed 6.9% to $25.81/barrel after Saudi Arabia committed to further production cuts starting next month.
All 11 S&P 500 sectors closed in negative territory, with Real Estate shares shedding more than 4%. Financials also lagged, with BlackRock (BLK -7.84%) fell after PNC Financial (PNC -2.08%) announced plans to sell its 22% stake in the world’s largest asset manager. In other corporate news, GrubHub (GRUB +29.1%) surged on reports that ride-hailing service Uber (UBER +2.40%) had offered to purchase the food delivery company in an all-stock deal. |
 Kenneth J. Gruneisen started out as a licensed stockbroker in August 1987, a couple of months prior to the historic stock market crash that took the Dow Jones Industrial Average down -22.6% in a single day. He has published daily fact-based fundamental and technical analysis on high-ranked stocks online for two decades. Through FACTBASEDINVESTING.COM, Kenneth provides educational articles, news, market commentary, and other information regarding proven investment systems that work in good times and bad.
Comments contained in the body of this report are technical opinions only and are not necessarily those of Gruneisen Growth Corp. The material herein has been obtained from sources believed to be reliable and accurate, however, its accuracy and completeness cannot be guaranteed. Our firm, employees, and customers may effect transactions, including transactions contrary to any recommendation herein, or have positions in the securities mentioned herein or options with respect thereto. Any recommendation contained in this report may not be suitable for all investors and it is not to be deemed an offer or solicitation on our part with respect to the purchase or sale of any securities. |
|
 |
Financial, Tech, Retail, and Integrated Oil Indexes Fell
Kenneth J. Gruneisen - Passed the CAN SLIM® Master's Exam
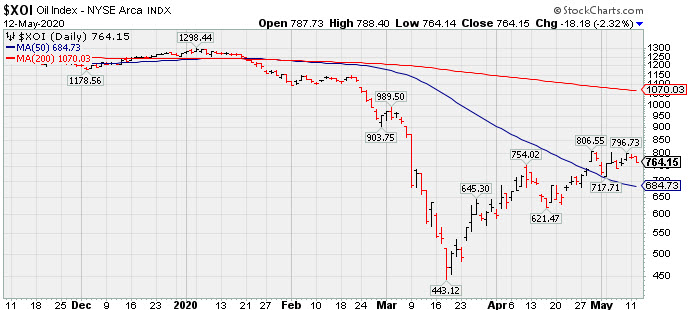
The Bank Index ($BKX -3.92%) and the Broker/Dealer Index ($XBD -3.35%) both lost ground and outpaced the Retail Index ($RLX -2.06%) to the downside. The tech sector had a negative bias as the Biotech Index ($BTK -1.69%), Networking Index ($NWX -2.11%), and the Semiconductor Index ($SOX -2.77%) finished unanimously lower. The Gold & Silver Index ($XAU -0.30%) edged lower and the Oil Services Index ($OSX -0.00%) was unchanged while the Integrated Oil Index ($XOI -2.32%) fell. PICTURED: The Integrated Oil Index ($XOI -2.32%) has recently been consolidating above its 50-day moving average (DMA) line after rebounding impressively from the March low.
| Oil Services |
$OSX |
29.91 |
+0.00 |
+0.00% |
-61.80% |
| Integrated Oil |
$XOI |
764.15 |
-18.18 |
-2.32% |
-39.86% |
| Semiconductor |
$SOX |
1,725.24 |
-49.07 |
-2.77% |
-6.72% |
| Networking |
$NWX |
521.76 |
-11.27 |
-2.11% |
-10.57% |
| Broker/Dealer |
$XBD |
233.78 |
-8.11 |
-3.35% |
-19.49% |
| Retail |
$RLX |
2,628.43 |
-55.21 |
-2.06% |
+7.31% |
| Gold & Silver |
$XAU |
117.74 |
-0.35 |
-0.30% |
+10.12% |
| Bank |
$BKX |
65.83 |
-2.68 |
-3.91% |
-41.93% |
| Biotech |
$BTK |
5,475.46 |
-94.02 |
-1.69% |
+8.05% |
|
|
|
 |
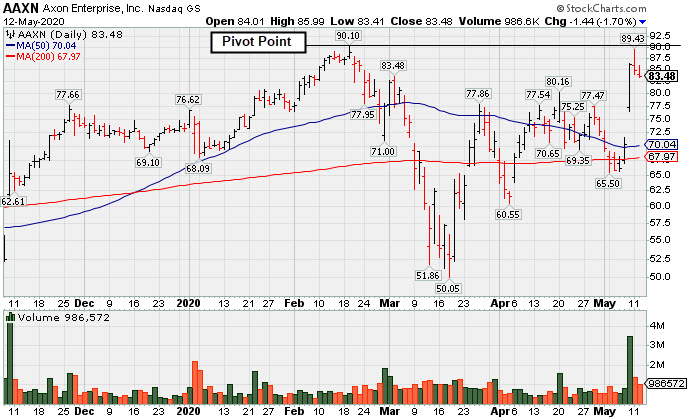
Security/Safety Firm Perched Near 52-Week High After Gap Up
Kenneth J. Gruneisen - Passed the CAN SLIM® Master's Exam
Axon Enterprise Inc (AAXN -$1.44 or -1.70% to $83.48) remains perched near its 52-week high with volume totals cooling. It finished strong after highlighted in yellow in the 5/08/20 mid-day report with pivot point cited based upon its 2/19/20 high plus 10 cents (read here). Subsequent volume-driven gains above the pivot point are needed to trigger a technical buy signal.
The company has a small supply of only 59.5 million shares outstanding (S criteria) which can contribute to greater price volatility in the event of institutional buying or selling. The number of top-rated funds owning its shares rose from 400 in Sep '19 to 437 in Mar '20, a reassuring sign concerning the I criteria. AAXN has a Timelines Rating of A and an Accumulation/Distribution Rating of B-. The Security/Safety industry group currently has a Group Relative Strength Rating of B+ (74).
The Sep, Dec '19 and Mar '20 quarterly comparisons versus the year ago periods showed earnings increases above the +25% minimum guideline (C criteria) with strong underlying sales revenues increases. Its annual earnings (A criteria) history has also been strong, helping it get a 98 Earnings Per Share Rating.
|
|
|
Color Codes Explained :
Y - Better candidates highlighted by our
staff of experts.
G - Previously featured
in past reports as yellow but may no longer be buyable under the
guidelines.
***Last / Change / Volume data in this table is the closing quote data***
Symbol/Exchange
Company Name
Industry Group |
PRICE |
CHANGE
(%Change) |
Day High |
Volume
(% DAV)
(% 50 day avg vol) |
52 Wk Hi
% From Hi |
Featured
Date |
Price
Featured |
Pivot Featured |
|
Max Buy |
 FTNT
-
NASDAQ
FTNT
-
NASDAQ
Fortinet Inc
Computer Sftwr-Security
|
$138.39
|
-2.07
-1.47% |
$143.41
|
1,909,773
75.43% of 50 DAV
50 DAV is 2,532,000
|
$142.36
-2.79%
|
5/7/2020
|
$134.40
|
PP = $121.92
|
|
MB = $128.02
|
Most Recent Note - 5/11/2020 5:28:24 PM
G - Color code was changed to green after quickly rallying well above its "max buy" level and getting extended from the prior base. Prior highs in the $121 area define initial support to watch on pullbacks. Finished strong after highlighted in yellow in the 5/07/20 mid-day report. Fundamentals remain strong. See the latest FSU analysis for more details and an annotated graph.
>>> FEATURED STOCK ARTICLE : Gap Up and Big Volume-Driven Gain for Computer Security Firm - 5/7/2020 |
View all notes |
Set NEW NOTE alert |
Company Profile |
SEC
News |
Chart |
Request a new note
C
A
S
I |
SPNS
-
NASDAQ
Sapiens Intl Corp
COMPUTER SOFTWARE and SERVICES - Technical and System Software
|
$25.80
|
-0.23
-0.88% |
$27.50
|
373,867
274.90% of 50 DAV
50 DAV is 136,000
|
$29.24
-11.76%
|
5/11/2020
|
$27.80
|
PP = $26.96
|
|
MB = $28.31
|
 Most Recent Note - 5/12/2020 6:32:18 PM
Y - Erased early gains today to finish with a loss on above average volume indicative of distributional pressure. Finished weak on the prior session after highlighted in yellow in the mid-day report with pivot point cited based on its 1/24/20 high plus 10 cents. Due to report Mar '20 quarterly earnings news on 5/14/20. Volume and volatility often increase near earnings news. See the latest FSU analysis for more details and an annotated graph.
>>> FEATURED STOCK ARTICLE : Encountered Distributional Pressure After Hitting New High - 5/11/2020 |
View all notes |
Set NEW NOTE alert |
Company Profile |
SEC
News |
Chart |
Request a new note
C
A
S
I |
EBS
-
NYSE
Emergent Biosolutions
DRUGS - Biotechnology
|
$81.47
|
-3.08
-3.64% |
$90.00
|
760,320
131.77% of 50 DAV
50 DAV is 577,000
|
$85.59
-4.81%
|
4/24/2020
|
$72.10
|
PP = $73.99
|
|
MB = $77.69
|
Most Recent Note - 5/12/2020 6:26:57 PM
G - There was a "negative reversal" after early gains today for a new all-time high, ending with a loss on above average volume indicative of distributional pressure. It is extended from the previously noted base. Prior highs in the $71-73 area define initial support to watch on pullbacks. Fundamentals remain strong.
>>> FEATURED STOCK ARTICLE : Light Volume Gain for New High Close Caps 7th Straight Weekly Gain - 5/8/2020 |
View all notes |
Set NEW NOTE alert |
Company Profile |
SEC
News |
Chart |
Request a new note
C
A
S
I |
TREX
-
NYSE
Trex Company Inc
MATERIALS and CONSTRUCTION - General Building Materials
|
$113.40
|
-4.02
-3.42% |
$118.72
|
893,021
82.38% of 50 DAV
50 DAV is 1,084,000
|
$118.38
-4.21%
|
5/5/2020
|
$109.05
|
PP = $111.95
|
|
MB = $117.55
|
Most Recent Note - 5/12/2020 6:30:01 PM
Y - Pulled back today for a loss with below average volume after touching a new all-time high. Prior highs in the $111 area define initial support to watch. Has a new CEO as of 4/29/20. Fundamentals remain strong.
>>> FEATURED STOCK ARTICLE : Gapped Up for Volume-Driven Gain and Hit a New All-Time High - 5/5/2020 |
View all notes |
Set NEW NOTE alert |
Company Profile |
SEC
News |
Chart |
Request a new note
C
A
S
I |
NFLX
-
NASDAQ
Netflix Inc
SPECIALTY RETAIL - Music and Video Stores
|
$431.82
|
-8.70
-1.97% |
$444.17
|
4,582,391
48.51% of 50 DAV
50 DAV is 9,446,000
|
$449.52
-3.94%
|
4/13/2020
|
$393.60
|
PP = $393.62
|
|
MB = $413.30
|
Most Recent Note - 5/11/2020 5:23:59 PM
G - Posted another small gain today with light volume for a best-ever close. Prior highs in the $393 area acted as support following the recent breakout. Fundamentals remain strong after it reported earnings +107% on +28% sales revenues for the Mar '20 quarter versus the year ago period.
>>> FEATURED STOCK ARTICLE : Prior Highs Acted as Support Following Recent Breakout - 5/6/2020 |
View all notes |
Set NEW NOTE alert |
Company Profile |
SEC
News |
Chart |
Request a new note
C
A
S
I |
Symbol/Exchange
Company Name
Industry Group |
PRICE |
CHANGE
(%Change) |
Day High |
Volume
(% DAV)
(% 50 day avg vol) |
52 Wk Hi
% From Hi |
Featured
Date |
Price
Featured |
Pivot Featured |
|
Max Buy |
NOW
-
NYSE
Servicenow Inc
Computer Sftwr-Enterprse
|
$365.60
|
-18.05
-4.70% |
$384.99
|
3,387,191
121.06% of 50 DAV
50 DAV is 2,798,000
|
$388.50
-5.89%
|
4/30/2020
|
$343.05
|
PP = $363.05
|
|
MB = $381.20
|
Most Recent Note - 5/12/2020 6:24:24 PM
Y - Pulled back from near its all-time high with higher volume behind today's big loss following gains backed by near average volume. Gains above the pivot point should be backed by at least +40% above average volume to clinch a proper technical buy signal.
>>> FEATURED STOCK ARTICLE : Fundamental Strength Continues; Volume Heavy Behind Big Gain - 4/30/2020 |
View all notes |
Set NEW NOTE alert |
Company Profile |
SEC
News |
Chart |
Request a new note
C
A
S
I |
QLYS
-
NASDAQ
Qualys Inc
Computer Sftwr-Security
|
$104.81
|
-1.71
-1.61% |
$108.34
|
445,168
78.10% of 50 DAV
50 DAV is 570,000
|
$111.79
-6.24%
|
4/9/2020
|
$100.44
|
PP = $97.22
|
|
MB = $102.08
|
Most Recent Note - 5/12/2020 6:34:40 PM
G - Color code was changed to green after rising above its "max buy" level. Pulled back after reporting Mar '20 quarterly earnings +33% on +14% sales revenues versus the year ago period, continuing its strong earnings track record. Prior highs in the $97 area recently acted as support.
>>> FEATURED STOCK ARTICLE : Volume Totals Cooling While Stubbornly Holding Ground Near High - 4/27/2020 |
View all notes |
Set NEW NOTE alert |
Company Profile |
SEC
News |
Chart |
Request a new note
C
A
S
I |
TEAM
-
NASDAQ
Atlassian Corp Plc Cl A
Comp Sftwr-Spec Enterprs
|
$176.00
|
-0.60
-0.34% |
$181.18
|
1,549,682
74.43% of 50 DAV
50 DAV is 2,082,000
|
$182.60
-3.61%
|
5/4/2020
|
$159.70
|
PP = $156.22
|
|
MB = $164.03
|
Most Recent Note - 5/7/2020 6:45:57 PM
G - Posted a 4th consecutive gain today, getting more extended from the previously noted base. Prior highs in the $156 area define initial support to watch on pullbacks.
>>> FEATURED STOCK ARTICLE : Volume-Driven Gain For New All-Time High - 5/4/2020 |
View all notes |
Set NEW NOTE alert |
Company Profile |
SEC
News |
Chart |
Request a new note
C
A
S
I |
AAXN
-
NASDAQ
Axon Enterprise Inc
Security/Sfty
|
$83.48
|
-1.44
-1.70% |
$85.99
|
986,573
113.92% of 50 DAV
50 DAV is 866,000
|
$90.10
-7.35%
|
5/8/2020
|
$84.86
|
PP = $90.20
|
|
MB = $94.71
|
Most Recent Note - 5/11/2020 12:32:55 PM
Y - Challenged its 52-week high with today's early gain. Finished strong after highlighted in yellow in the 5/08/20 mid-day report with pivot point cited based upon its 2/19/20 high plus 10 cents. Subsequent volume-driven gains above the pivot point may trigger a technical buy signal.
>>> FEATURED STOCK ARTICLE : Security/Safety Firm Perched Near 52-Week High After Gap Up - 5/12/2020 |
View all notes |
Set NEW NOTE alert |
Company Profile |
SEC
News |
Chart |
Request a new note
C
A
S
I |
|
|
|
THESE ARE NOT BUY RECOMMENDATIONS!
Comments contained in the body of this report are technical
opinions only. The material herein has been obtained
from sources believed to be reliable and accurate, however,
its accuracy and completeness cannot be guaranteed.
This site is not an investment advisor, hence it does
not endorse or recommend any securities or other investments.
Any recommendation contained in this report may not
be suitable for all investors and it is not to be deemed
an offer or solicitation on our part with respect to
the purchase or sale of any securities. All trademarks,
service marks and trade names appearing in this report
are the property of their respective owners, and are
likewise used for identification purposes only.
This report is a service available
only to active Paid Premium Members.
You may opt-out of receiving report notifications
at any time. Questions or comments may be submitted
by writing to Premium Membership Services 665 S.E. 10 Street, Suite 201 Deerfield Beach, FL 33441-5634 or by calling 1-800-965-8307
or 954-785-1121.
|
|
|