You are not logged in.
This means you
CAN ONLY VIEW reports that were published prior to Monday, April 14, 2025.
You
MUST UPGRADE YOUR MEMBERSHIP if you want to see any current reports.
AFTER MARKET UPDATE - WEDNESDAY, MAY 12TH, 2010
Previous After Market Report Next After Market Report >>>
|
|
|
|
DOW |
+148.65 |
10,896.91 |
+1.38% |
|
Volume |
1,276,445,170 |
-12% |
|
Volume |
2,225,766,200 |
-14% |
|
NASDAQ |
+49.71 |
2,425.02 |
+2.09% |
|
Advancers |
2,508 |
79% |
|
Advancers |
2,223 |
79% |
|
S&P 500 |
+15.88 |
1,171.67 |
+1.37% |
|
Decliners |
603 |
19% |
|
Decliners |
522 |
18% |
|
Russell 2000 |
+20.63 |
716.11 |
+2.97% |
|
52 Wk Highs |
99 |
|
|
52 Wk Highs |
132 |
|
|
S&P 600 |
+10.79 |
382.44 |
+2.90% |
|
52 Wk Lows |
10 |
|
|
52 Wk Lows |
17 |
|
|
 |
Major Averages Are Rebounding Above Short-Term Average Lines
Adam Sarhan, Contributing Writer,
The major averages posted unanimous gains on Wednesday, extending their new rally effort after a flurry of healthy headlines from Europe were released. Volume totals were reported lower on the Nasdaq and on the NYSE compared to Tuesday's totals, which was a bit disconcerting while advancers led decliners by a 4-to-1 ratio on the NYSE and on the Nasdaq exchange. New 52-week highs outnumbered new 52-week lows on the NYSE and on the Nasdaq exchange. There were 25 high-ranked companies from the CANSLIM.net Leaders List that made a new 52-week high and appeared on the CANSLIM.net BreakOuts Page, higher than the 19 issues that appeared on the prior session. New leadership is a critical part of any rally effort, and while disciplined investors are awaiting a follow-through-day from at least one of the major averages it is somewhat reassuring to see the new highs list expanding again.
Several positive headlines were released from Europe which helped ease contagion woes. The Portuguese bond sale went better than expected, planned budget cuts in Spain and the U.K. went well and EU GDP topped estimates. The EU’s statistics office in Luxembourg said that gross domestic product in the 16 euro nations climbed +0.2% from the fourth quarter, when it remained unchanged. In addition, Germany’s economy unexpectedly grew in the first quarter, helped by rising exports. Interestingly, the news sent US Treasuries and the euro lower as gold and the dollar rose. Gold surged to a fresh record high even as the dollar rallied and the euro flirted with a fresh 2010 low.
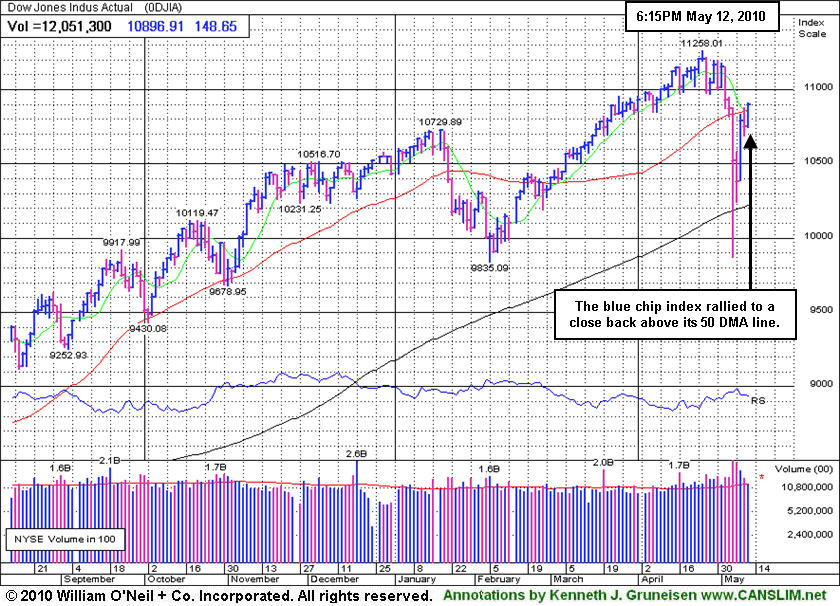
Technically, it was encouraging to see the Dow Jones Industrial Average and the tech-heavy Nasdaq Composite Index both rallying to closes above their respective 50-day moving average (DMA) lines after violating those levels late last week. The S&P 600 Small Cap and S&P 400 Mid-Cap indexes have also rebounded back above their respective 50 DMA lines. The benchmark S&P 500 Index closed near its intra-day high but just shy of its 50 DMA line, and the NYSE Composite Index still remains below its short-term average. The primary concern at this point is that volume continues to recede compared to last week's levels which is not ideal. Normally, one would like to see volume recede as the market declines and expand as the market rallies, which is the opposite of what is happening thus far into the new rally attempt. Only time will tell if this was a short-lived correction, or the start of a more ominous decline in equities.
Wednesday marked Day 3 of the current rally attempt which means that as long as Monday's lows are not breached the earliest a proper follow-through-day (FTD) could emerge will be this Thursday. In order for a proper FTD to emerge one would have to see at least one of the major averages rally at least +1.7% on higher volume than the prior session as a new batch of high ranked leaders trigger fresh technical buy signals. Once that occurs, then the current rally attempt will be confirmed and the ideal window for accumulating high-ranked stocks will be open again. However, if Monday's lows are breached, then the day count will be reset. Trade accordingly.
Professional Money Management Services - Free Portfolio Review:
If your portfolio is greater than $100,000 and you would like a free portfolio review, click here to get connected with one of our portfolio managers. ** Serious inquires only, please.
PICTURED: The blue chip Dow Jones Industrial Average rallied to a close back above its 50 DMA line. The technical improvement helps the market outlook.
|
|
|
 |
Tech Strength Helped Nasdaq Composite Rebound Above 50-Day Average
Kenneth J. Gruneisen - Passed the CAN SLIM® Master's Exam
Strength in the tech sector helped the Nasdaq Composite Index rally above its 50 DMA line on Wednesday as the Internet Index ($IIX +2.42%), Networking Index ($NWX +2.84%), Semiconductor Index ($SOX +2.84%), and Biotechnology Index ($BTK +1.92%) posted unanimous gains. Strength in the influential Retail Index ($RLX +1.40%) and financial shares also helped underpin the major averages' rally effort as the Bank Index ($BKX +1.47%) and Broker/Dealer Index ($XBD +0.89%) rose. The Gold & Silver Index ($XAU +0.98%) lagged other defensive groups as the Healthcare Index ($HMO +2.30%) charged higher and gain in energy-related shares boosted the Integrated Oil Index ($XOI +1.16%) and Oil Services Index ($OSX +1.67%).
Charts courtesy www.stockcharts.com
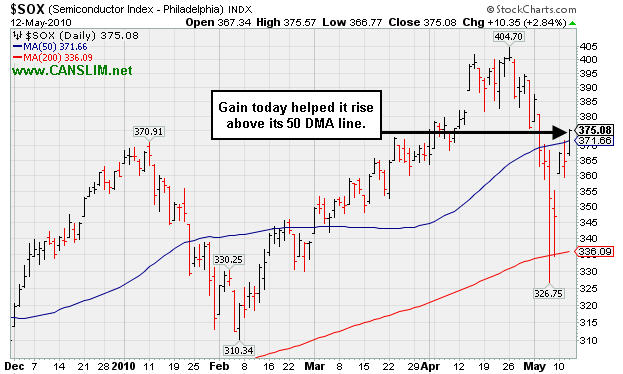
PICTURED: The Semiconductor Index ($SOX +2.84%) posted a solid gain on Wednesday and rallied above its 50 DMA line.
| Oil Services |
$OSX |
199.84 |
+3.29 |
+1.67% |
+2.52% |
| Healthcare |
$HMO |
1,514.55 |
+34.01 |
+2.30% |
+2.82% |
| Integrated Oil |
$XOI |
1,039.15 |
+11.88 |
+1.16% |
-2.72% |
| Semiconductor |
$SOX |
375.08 |
+10.35 |
+2.84% |
+4.21% |
| Networking |
$NWX |
262.22 |
+7.23 |
+2.84% |
+13.49% |
| Internet |
$IIX |
250.64 |
+5.91 |
+2.42% |
+7.18% |
| Broker/Dealer |
$XBD |
115.59 |
+1.02 |
+0.89% |
+0.47% |
| Retail |
$RLX |
474.39 |
+6.53 |
+1.40% |
+15.39% |
| Gold & Silver |
$XAU |
186.06 |
+1.81 |
+0.98% |
+10.59% |
| Bank |
$BKX |
55.89 |
+0.81 |
+1.47% |
+30.86% |
| Biotech |
$BTK |
1,111.57 |
+20.98 |
+1.92% |
+17.98% |
|
|
|
 |
Rebound Above 50 DMA After Finding Support Above Old Chart Highs
Kenneth J. Gruneisen - Passed the CAN SLIM® Master's Exam
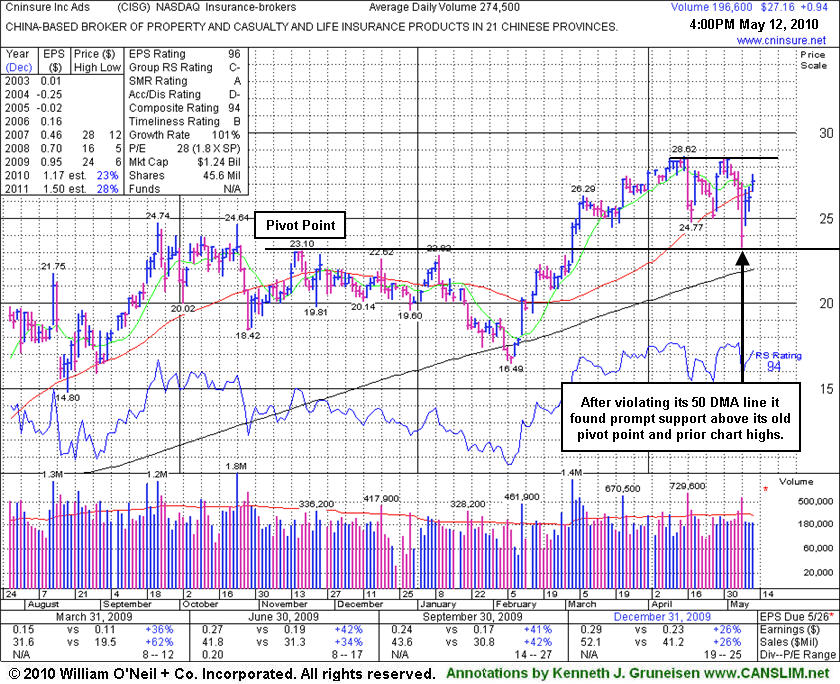
Cninsure Inc (CISG +$0.94 or +3.59% to $27.16) posted a third consecutive gain on lighter than average volume, yet today's rebound above its 50-day moving average (DMA) line has been an encouraging sign of support following last week's technical violation and sell signal. After violating its 50 DMA line it found prompt support above its old pivot point and prior chart highs. Disciplined investors may be wise to continue waiting for another ideal entry point. Meanwhile, it is currently working on the 5th week of a choppy new base, the and the questionable outlook for the broader market (M criteria) would only improve if a solid follow-through-day of gains from at least one of the major averages provides confirmation that the new rally attempt has sufficient buying conviction coming from the institutional crowd.
CISG traded up as much as +17.4% since featured in yellow as it rose from a 20-week double bottom base with 8 times average volume and was featured in the 3/03/10 mid-day report (read here) color coded yellow with pivot point cited based on its 11/18/09 high. This China-based insurance broker has shown strong earnings and sales growth above the +25% guideline but generally decelerating over the course of recent years. The lack of leadership in the Insurance-Brokers industry group also remains a concern with respect to the investment system's L criteria.
|
|
|
Color Codes Explained :
Y - Better candidates highlighted by our
staff of experts.
G - Previously featured
in past reports as yellow but may no longer be buyable under the
guidelines.
***Last / Change / Volume data in this table is the closing quote data***
Symbol/Exchange
Company Name
Industry Group |
PRICE |
CHANGE
(%Change) |
Day High |
Volume
(% DAV)
(% 50 day avg vol) |
52 Wk Hi
% From Hi |
Featured
Date |
Price
Featured |
Pivot Featured |
|
Max Buy |
BIDU
-
NASDAQ
Baidu Inc Ads
INTERNET - Internet Information Providers
|
$78.21
|
+6.79
9.50% |
$78.36
|
41,747,435
262.86% of 50 DAV
50 DAV is 15,881,900
|
$718.00
-89.11%
|
1/13/2010
|
$431.25
|
PP = $426.75
|
|
MB = $448.09
|
 Most Recent Note - 5/12/2010 4:40:01 PM
G - Considerable gain today with heavy volume for a new all-time high following a 10:1 stock split. Last week's loss broke a 13 week winning streak. Prior notes mentioned its small supply of shares as a factor that might contribute to more climactic gains. It is clear of resistance due to overhead supply.
 >>> The latest Featured Stock Update with an annotated graph appeared on 4/20/2010. Click here. >>> The latest Featured Stock Update with an annotated graph appeared on 4/20/2010. Click here.
View all notes |
Alert me of new notes |
CANSLIM.net Company Profile
|
BPI
-
NYSE
Bridgepoint Education
DIVERSIFIED SERVICES - Education and; Training Services
|
$24.80
|
+0.57
2.35% |
$25.05
|
231,879
43.34% of 50 DAV
50 DAV is 535,000
|
$27.50
-9.82%
|
4/13/2010
|
$25.59
|
PP = $25.76
|
|
MB = $27.05
|
Most Recent Note - 5/11/2010 4:12:37 PM
G - Consolidating above its 50 DMA line, its recent chart low ($22.75) defines near-term chart support. The Commercial Services - Schools firm was featured in yellow in the 4/13/10 mid-day report (read here) as rose from a cup-with-high-handle.
>>> The latest Featured Stock Update with an annotated graph appeared on 5/7/2010. Click here.
View all notes |
Alert me of new notes |
CANSLIM.net Company Profile
|
BRLI
-
NASDAQ
Bio Reference Labs Inc
HEALTH SERVICES - Medical Laboratories and Researc
|
$23.11
|
+0.66
2.94% |
$23.18
|
120,988
62.53% of 50 DAV
50 DAV is 193,500
|
$24.67
-6.34%
|
2/12/2010
|
$39.02
|
PP = $20.49
|
|
MB = $21.51
|
Most Recent Note - 5/12/2010 4:43:12 PM
G - Gains this week on lighter volume have helped it rally back above its 50 DMA line, helping its outlook improve. Gapped up on 5/10/10 and promptly rallied back above its 3/26/10 low.
>>> The latest Featured Stock Update with an annotated graph appeared on 5/11/2010. Click here.
View all notes |
Alert me of new notes |
CANSLIM.net Company Profile
|
CISG
-
NASDAQ
Cninsure Inc Ads
INSURANCE - Insurance Brokers
|
$27.16
|
+0.94
3.59% |
$27.55
|
199,417
72.65% of 50 DAV
50 DAV is 274,500
|
$28.62
-5.10%
|
3/3/2010
|
$24.38
|
PP = $23.10
|
|
MB = $24.26
|
Most Recent Note - 5/12/2010 4:44:54 PM
G - Posted a third consecutive gain today on lighter than average volume as it rallied back above its 50 DMA line, helping its outlook improve.
>>> The latest Featured Stock Update with an annotated graph appeared on 5/12/2010. Click here.
View all notes |
Alert me of new notes |
CANSLIM.net Company Profile
|
CRM
-
NYSE
Salesforce.Com Inc
INTERNET - Internet Software and Services
|
$88.40
|
+2.20
2.55% |
$88.56
|
2,456,162
143.60% of 50 DAV
50 DAV is 1,710,400
|
$89.50
-1.23%
|
3/5/2010
|
$72.28
|
PP = $75.53
|
|
MB = $79.31
|
Most Recent Note - 5/12/2010 4:46:42 PM
G - Closed the session just 30 cents off its best ever close while posting a 3rd consecutive gain with above average volume. Its gap up on 5/10/10 promptly repaired a brief violation of its 50 DMA line, a sign of great institutional support.
>>> The latest Featured Stock Update with an annotated graph appeared on 4/21/2010. Click here.
View all notes |
Alert me of new notes |
CANSLIM.net Company Profile
|
Symbol/Exchange
Company Name
Industry Group |
PRICE |
CHANGE
(%Change) |
Day High |
Volume
(% DAV)
(% 50 day avg vol) |
52 Wk Hi
% From Hi |
Featured
Date |
Price
Featured |
Pivot Featured |
|
Max Buy |
LL
-
NYSE
Lumber Liquidators Hldgs
RETAIL - Home Improvement Stores
|
$31.25
|
+1.11
3.68% |
$31.40
|
312,971
78.77% of 50 DAV
50 DAV is 397,300
|
$33.41
-6.47%
|
4/22/2010
|
$29.87
|
PP = $29.03
|
|
MB = $30.48
|
Most Recent Note - 5/12/2010 5:18:20 PM
G - Posted a 3rd consecutive gain today on lighter than average volume. It found support above its 50 DMA line and promptly rebounded back above its December 2009 highs. First featured in yellow at $29.87 in the 4/22/10 the mid-day report (read here).
>>> The latest Featured Stock Update with an annotated graph appeared on 4/26/2010. Click here.
View all notes |
Alert me of new notes |
CANSLIM.net Company Profile
|
LOPE
-
NASDAQ
Grand Canyon Education
DIVERSIFIED SERVICES - Education and; Training Services
|
$25.22
|
+0.37
1.49% |
$25.33
|
300,024
79.58% of 50 DAV
50 DAV is 377,000
|
$28.46
-11.38%
|
4/13/2010
|
$27.71
|
PP = $27.33
|
|
MB = $28.70
|
Most Recent Note - 5/11/2010 4:22:05 PM
G - Its outlook is increasingly questionable the longer it remains below its 50 DMA line. Many for-profit schools have encountered distributional pressure in the wake of recently proposed regulatory changes.
>>> The latest Featured Stock Update with an annotated graph appeared on 5/10/2010. Click here.
View all notes |
Alert me of new notes |
CANSLIM.net Company Profile
|
ROVI
-
NASDAQ
Rovi Corp
COMPUTER SOFTWARE andamp; SERVICES - Security Software andamp; Services
|
$38.19
|
+1.98
5.47% |
$38.66
|
2,018,790
153.85% of 50 DAV
50 DAV is 1,312,200
|
$40.06
-4.67%
|
4/20/2010
|
$37.62
|
PP = $38.60
|
|
MB = $40.53
|
Most Recent Note - 5/12/2010 5:20:35 PM
G - Gain today with above average volume helped it rally above its 50 DMA line, an encouraging technical improvement. It recently avoided deterioration leading to closes under its October 2009 highs which would raise more serious concerns.
>>> The latest Featured Stock Update with an annotated graph appeared on 5/5/2010. Click here.
View all notes |
Alert me of new notes |
CANSLIM.net Company Profile
|
SIRO
-
NASDAQ
Sirona Dental Systems
HEALTH SERVICES - Medical Instruments andamp; Supplies
|
$38.16
|
-0.29
-0.75% |
$38.86
|
751,818
120.06% of 50 DAV
50 DAV is 626,200
|
$43.45
-12.17%
|
2/16/2010
|
$36.43
|
PP = $36.15
|
|
MB = $37.96
|
Most Recent Note - 5/10/2010 4:18:39 PM
G - Small gain today remaining below its 50 DMA line which may now act as resistance. On 5/05/10 it endured heavy distributional pressure after reporting +231% earnings on +15% sales revenues for the quarter ended March 31, 2010 versus the year ago period.
>>> The latest Featured Stock Update with an annotated graph appeared on 4/22/2010. Click here.
View all notes |
Alert me of new notes |
CANSLIM.net Company Profile
|
SUMR
-
NASDAQ
Summer Infant Inc
CONSUMER NON-DURABLES - Personal Products
|
$7.59
|
+0.58
8.27% |
$7.75
|
166,476
330.31% of 50 DAV
50 DAV is 50,400
|
$7.24
4.83%
|
5/4/2010
|
$6.85
|
PP = $7.09
|
|
MB = $7.44
|
Most Recent Note - 5/12/2010 5:56:02 PM
Y - Considerable gain today helped it rally above its pivot point for a new 52-week high with volume more than triple its average daily trading total triggering a technical buy signal. Disciplined investors will remain cautious until a follow-through-day confirms the market's (M criteria) new rally effort.
>>> The latest Featured Stock Update with an annotated graph appeared on 5/4/2010. Click here.
View all notes |
Alert me of new notes |
CANSLIM.net Company Profile
|
Symbol/Exchange
Company Name
Industry Group |
PRICE |
CHANGE
(%Change) |
Day High |
Volume
(% DAV)
(% 50 day avg vol) |
52 Wk Hi
% From Hi |
Featured
Date |
Price
Featured |
Pivot Featured |
|
Max Buy |
ULTA
-
NASDAQ
Ulta Salon Cosm & Frag
SPECIALTY RETAIL - Specialty Retail, Other
|
$24.70
|
+1.30
5.56% |
$25.04
|
299,341
68.58% of 50 DAV
50 DAV is 436,500
|
$25.76
-4.11%
|
3/12/2010
|
$22.81
|
PP = $21.72
|
|
MB = $22.81
|
Most Recent Note - 5/12/2010 2:38:23 PM
G - Considerable gain today on lighter volume, rallying toward its 52-week high. On 5/10/10 it rallied back above its 50 DMA line and January low, showing prompt and encouraging signs of support.
>>> The latest Featured Stock Update with an annotated graph appeared on 4/30/2010. Click here.
View all notes |
Alert me of new notes |
CANSLIM.net Company Profile
|
VIT
-
NYSE
Vanceinfo Tech Inc Ads
COMPUTER SOFTWARE and SERVICES - Business Software and Services
|
$24.99
|
+1.51
6.43% |
$25.03
|
487,966
63.87% of 50 DAV
50 DAV is 764,000
|
$26.48
-5.63%
|
4/9/2010
|
$23.79
|
PP = $23.95
|
|
MB = $25.15
|
Most Recent Note - 5/12/2010 6:28:54 PM
G - Closed near the session high as it posted a 4th consecutive gain today with below average volume. Recently found support near its 50 DMA line.
>>> The latest Featured Stock Update with an annotated graph appeared on 5/6/2010. Click here.
View all notes |
Alert me of new notes |
CANSLIM.net Company Profile
|
|
|
|
THESE ARE NOT BUY RECOMMENDATIONS!
Comments contained in the body of this report are technical
opinions only. The material herein has been obtained
from sources believed to be reliable and accurate, however,
its accuracy and completeness cannot be guaranteed.
This site is not an investment advisor, hence it does
not endorse or recommend any securities or other investments.
Any recommendation contained in this report may not
be suitable for all investors and it is not to be deemed
an offer or solicitation on our part with respect to
the purchase or sale of any securities. All trademarks,
service marks and trade names appearing in this report
are the property of their respective owners, and are
likewise used for identification purposes only.
This report is a service available
only to active Paid Premium Members.
You may opt-out of receiving report notifications
at any time. Questions or comments may be submitted
by writing to Premium Membership Services 665 S.E. 10 Street, Suite 201 Deerfield Beach, FL 33441-5634 or by calling 1-800-965-8307
or 954-785-1121.
|
|
|


