You are not logged in.
This means you
CAN ONLY VIEW reports that were published prior to Monday, April 14, 2025.
You
MUST UPGRADE YOUR MEMBERSHIP if you want to see any current reports.
AFTER MARKET UPDATE - TUESDAY, MAY 11TH, 2010
Previous After Market Report Next After Market Report >>>
|
|
|
|
DOW |
-36.88 |
10,748.26 |
-0.34% |
|
Volume |
1,456,804,560 |
-22% |
|
Volume |
2,598,736,560 |
-6% |
|
NASDAQ |
+0.64 |
2,375.31 |
+0.03% |
|
Advancers |
1,707 |
54% |
|
Advancers |
1,619 |
58% |
|
S&P 500 |
-3.94 |
1,155.79 |
-0.34% |
|
Decliners |
1,376 |
43% |
|
Decliners |
1,073 |
38% |
|
Russell 2000 |
+5.87 |
695.48 |
+0.85% |
|
52 Wk Highs |
56 |
|
|
52 Wk Highs |
61 |
|
|
S&P 600 |
+2.73 |
371.65 |
+0.74% |
|
52 Wk Lows |
8 |
|
|
52 Wk Lows |
27 |
|
|
 |
Indices End Mixed After Lighter Volume Session
Adam Sarhan, Contributing Writer,
The major averages traded between positive and negative territory and closed mixed to slightly lower after encountering resistance near their respective 50-day moving average (DMA) lines. Volume totals were reported lower on the Nasdaq and on the NYSE compared to Monday's totals. Advancers led decliners by a 3-to-2 ratio on the Nasdaq exchange, but they led by a narrower margin on the NYSE. New 52-week highs outnumbered new 52-week lows on the NYSE and on the Nasdaq exchange. There were 19 high-ranked companies from the CANSLIM.net Leaders List that made a new 52-week high and appeared on the CANSLIM.net BreakOuts Page, higher than the 7 issues that appeared on the prior session. Waning leadership has been evidenced by the recent lack of stocks making new highs as the rally came under pressure.
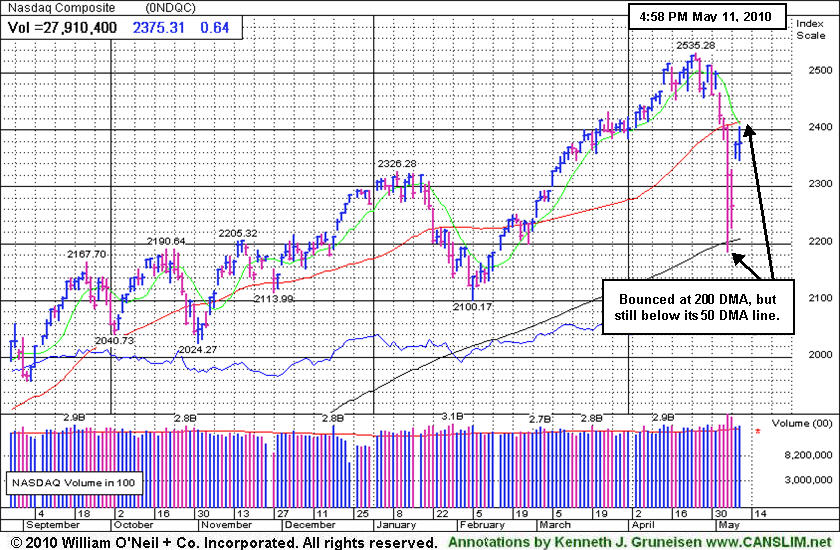
All the major averages opened lower, then turned higher, only to pullback after encountering resistance near their respective 50 DMA lines. Last week's historic sell off left a lot of technical damage on the charts of the major averages and leading stocks. Until the major averages all close above their respective 50 DMA lines then by definition the technical damage will remain intact and the near-term trend is lower. It was also worrisome to see that Chinese equities entered a bear market as inflation accelerated to an 18-month high. Higher inflation caused by their robust economy adds pressure on the government to raise interest rates which may in turn slow down the global economic recovery.
In a surprising turn of events, David Cameron was named the new Prime Minister of the United Kingdom after Gordon Brown unexpectedly resigned. Cameron's new role helped the conservative movement regain power after a 13-year hiatus. David Cameron is believed to be nearing an agreement on forming a coalition government with Nick Clegg’s Liberal Democrats. Negotiators for both their parties met today after talks broke down between Brown's Labour Party and the Liberal Democrats.
Tuesday marked Day 2 of the current rally attempt which means that as long as Monday's lows are not breached the earliest a proper follow-through-day (FTD) could emerge will be this Thursday. However, if Monday's lows are breached, then the day count will be reset. Taking the appropriate action on a case-by-case basis with your stocks prompts investors to raise cash when any holdings start getting into the trouble zone. A reminder was added to many Featured Stocks' notes this week -Broader market action (M criteria) is normally expected to impact 3 out of 4 stocks. Trade accordingly.
PICTURED: The Nasdaq Composite Index bounced at its 200 DMA line, but the tech-heavy index remains trading below its 50 DMA line after the recent downdraft.
|
|
|
 |
View Of Groups Worth Studying Closely
Kenneth J. Gruneisen - Passed the CAN SLIM® Master's Exam
The Healthcare Index ($HMO +1.24%) posted a gain, and it is currently meandering between its 50 and 200 DMA lines. Both energy-related indexes regularly covered in this section are currently in rather poor technical shape, trading near or below their long-term 200 DMA lines. On Tuesday the Integrated Oil Index ($XOI -1.17%) fell while the Oil Services Index ($OSX +0.31%) edged higher. Overall, that says defensive groups have not been leading.
Tech shares showed mixed action Tuesday as the Semiconductor Index ($SOX -0.75%) and Internet Index ($IIX -0.34%) fell modestly and the Networking Index ($NWX +0.26%) and Biotechnology Index ($BTK +0.47%) posted small gains. All of the above mentioned tech indexes were pressured near their 200 DMA lines last week, and their rebounds leave them concurrently trading below their 50 DMA lines. Overall, that says that the tech sector played a big part in the market's downdraft after having provided a lot of leadership. Only time will tell if the tech sector helps recharge the rally.
The Broker/Dealer Index's ($XBD -1.08%) loss sent it further below its 200 DMA line on Tuesday after that long-term average acted as resistance. Meanwhile, the Bank Index ($BKX +0.31%) held up well above its 50 and 200 DMA lines, having only briefly undercut its short-term average during the broader market's downdraft last week. The diverging action among financial stocks adds to the current level of uncertainty in the market. As a general rule the market hates uncertainty, which is yet another argument for caution until there is confirmation of a new rally. Long time followers of this commentary know the importance that is placed on the financial stocks as leading indicators. Both financial index charts were shown in yesterday's IGW section (read here) if you missed them.
Charts courtesy www.stockcharts.com
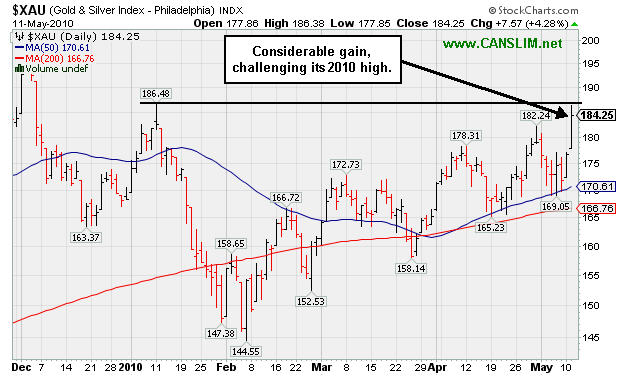
PICTURED 1: The Gold & Silver Index ($XAU +4.28%) was Tuesday's standout gainer, and the considerable rally helped it challenge its 2010 high. Some of the money that rotated away from the weakening tech sector recently may be finding a home in the classic "safe haven" area which has lagged.
Charts courtesy www.stockcharts.com
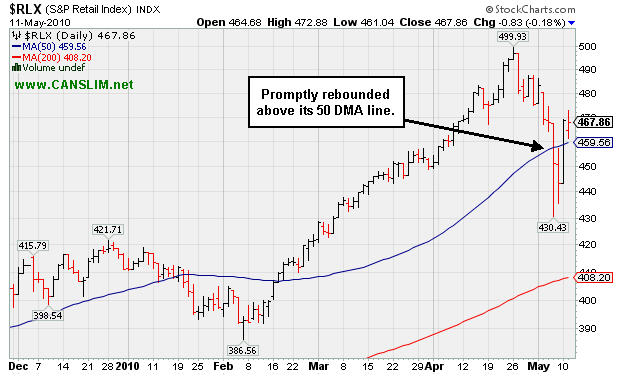
PICTURED 2: The Retail Index ($RLX -0.18%) finished without much change after rebounding above its 50 DMA line on the prior session. Resilience in the retail group bodes well.
| Oil Services |
$OSX |
196.55 |
+0.61 |
+0.31% |
+0.84% |
| Healthcare |
$HMO |
1,480.54 |
+18.12 |
+1.24% |
+0.52% |
| Integrated Oil |
$XOI |
1,027.27 |
-12.11 |
-1.17% |
-3.83% |
| Semiconductor |
$SOX |
364.73 |
-2.75 |
-0.75% |
+1.34% |
| Networking |
$NWX |
254.99 |
+0.67 |
+0.26% |
+10.36% |
| Internet |
$IIX |
244.73 |
-0.83 |
-0.34% |
+4.65% |
| Broker/Dealer |
$XBD |
114.57 |
-1.26 |
-1.08% |
-0.42% |
| Retail |
$RLX |
467.86 |
-0.83 |
-0.18% |
+13.80% |
| Gold & Silver |
$XAU |
184.25 |
+7.57 |
+4.28% |
+9.51% |
| Bank |
$BKX |
55.08 |
+0.17 |
+0.31% |
+28.96% |
| Biotech |
$BTK |
1,090.59 |
+5.08 |
+0.47% |
+15.76% |
|
|
|
 |
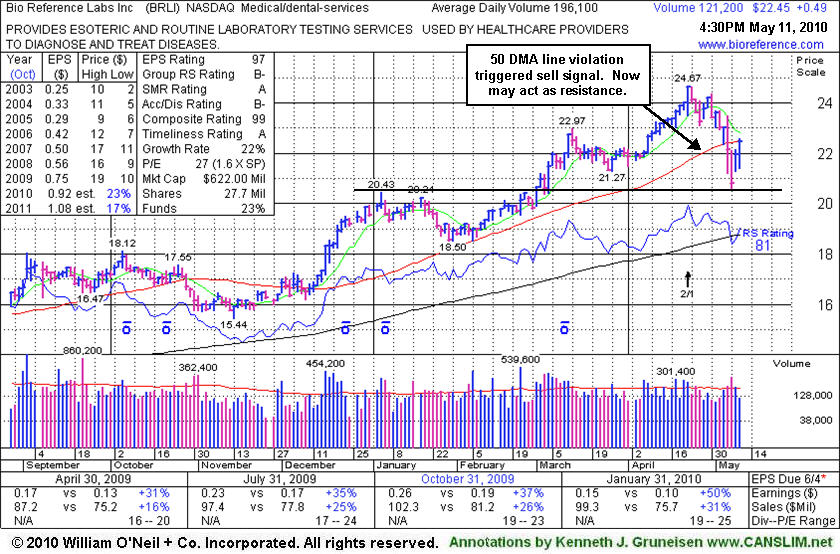
50-Day Moving Average Violation Triggered Recent Sell Signal
Kenneth J. Gruneisen - Passed the CAN SLIM® Master's Exam
Bio-Reference Laboratories, Inc. (BRLI +$0.49 to $22.45) remains below its 50 DMA line which may now act as resistance. It gapped up on 5/10/10 and promptly rallied back above its 3/26/10 low. It was noted that during the wild 5/06/10 trading session it reportedly traded down considerably intra-day, undercutting its 200 DMA line and revisiting its November 2009 lows, yet it rebounded to close near its 50 DMA line and in the upper part of its range. Apparently some low trades must have been taken off the tape, as the chart now reads differently for that date. More time is needed to see if a proper new base may form, and to also see if the major averages (M criteria) will confirm their new rally attempt with a powerful follow-through-day.
A gain on 3/04/10 with 2 times average volume lifted it solidly above its previously cited pivot point, confirming a technical buy signal. Now that old resistance level it cleared is a key chart support level. Its weekly chart is marked by many up weeks with above average volume and few down weeks on volume - very bullish characteristics. Earnings growth and sales revenues growth has accelerated, with increases better than the +25% minimum guideline in recent quarters. Fundamentals are favorable with respect to the C and A criteria of the investment system. Since splitting its shares 2:1 on 4/22/10 BRLI now has 27.7 million shares outstanding (S criteria). The number of top-rated funds owning its shares rose from 77 in Mar '09 to 86 in Mar '10 which is somewhat reassuring in regard to the I criteria of the investment system.
|
|
|
Color Codes Explained :
Y - Better candidates highlighted by our
staff of experts.
G - Previously featured
in past reports as yellow but may no longer be buyable under the
guidelines.
***Last / Change / Volume data in this table is the closing quote data***
Symbol/Exchange
Company Name
Industry Group |
PRICE |
CHANGE
(%Change) |
Day High |
Volume
(% DAV)
(% 50 day avg vol) |
52 Wk Hi
% From Hi |
Featured
Date |
Price
Featured |
Pivot Featured |
|
Max Buy |
BIDU
-
NASDAQ
Baidu Inc Ads
INTERNET - Internet Information Providers
|
$714.17
|
+19.39
2.79% |
$716.67
|
2,092,350
133.54% of 50 DAV
50 DAV is 1,566,800
|
$718.00
-0.53%
|
1/13/2010
|
$431.25
|
PP = $426.75
|
|
MB = $448.09
|
 Most Recent Note - 5/11/2010 4:11:06 PM
G - Gain today with above average volume for a new high close. Last week's loss broke a 13 week winning streak. A proper follow-through day from the major averages is needed as a confirmation of a healthy and sustainable new rally effort.
 >>> The latest Featured Stock Update with an annotated graph appeared on 4/20/2010. Click here. >>> The latest Featured Stock Update with an annotated graph appeared on 4/20/2010. Click here.
View all notes |
Alert me of new notes |
CANSLIM.net Company Profile
|
BPI
-
NYSE
Bridgepoint Education
DIVERSIFIED SERVICES - Education and; Training Services
|
$24.23
|
-0.17
-0.70% |
$24.45
|
345,684
64.25% of 50 DAV
50 DAV is 538,000
|
$27.50
-11.89%
|
4/13/2010
|
$25.59
|
PP = $25.76
|
|
MB = $27.05
|
Most Recent Note - 5/11/2010 4:12:37 PM
G - Consolidating above its 50 DMA line, its recent chart low ($22.75) defines near-term chart support. The Commercial Services - Schools firm was featured in yellow in the 4/13/10 mid-day report (read here) as rose from a cup-with-high-handle.
>>> The latest Featured Stock Update with an annotated graph appeared on 5/7/2010. Click here.
View all notes |
Alert me of new notes |
CANSLIM.net Company Profile
|
BRLI
-
NASDAQ
Bio Reference Labs Inc
HEALTH SERVICES - Medical Laboratories and Researc
|
$22.45
|
+0.49
2.23% |
$22.58
|
123,098
62.77% of 50 DAV
50 DAV is 196,100
|
$24.67
-9.01%
|
2/12/2010
|
$39.02
|
PP = $20.49
|
|
MB = $21.51
|
Most Recent Note - 5/11/2010 4:14:53 PM
G - Gain on lighter volume today helped it rally near its 50 DMA line which may now act as resistance. Gapped up on 5/10/10 and promptly rallied back above its 3/26/10 low.
>>> The latest Featured Stock Update with an annotated graph appeared on 5/11/2010. Click here.
View all notes |
Alert me of new notes |
CANSLIM.net Company Profile
|
CISG
-
NASDAQ
Cninsure Inc Ads
INSURANCE - Insurance Brokers
|
$26.22
|
+0.22
0.85% |
$26.85
|
199,332
72.72% of 50 DAV
50 DAV is 274,100
|
$28.62
-8.39%
|
3/3/2010
|
$24.38
|
PP = $23.10
|
|
MB = $24.26
|
Most Recent Note - 5/11/2010 4:18:01 PM
G - Posted a second consecutive gain on lighter than average volume. Its 50 DMA line seems to be acting as a resistance level following last week's technical violation and sell signal.
>>> The latest Featured Stock Update with an annotated graph appeared on 4/19/2010. Click here.
View all notes |
Alert me of new notes |
CANSLIM.net Company Profile
|
CRM
-
NYSE
Salesforce.Com Inc
INTERNET - Internet Software and Services
|
$86.20
|
+0.71
0.83% |
$87.90
|
2,498,205
145.88% of 50 DAV
50 DAV is 1,712,500
|
$89.50
-3.69%
|
3/5/2010
|
$72.28
|
PP = $75.53
|
|
MB = $79.31
|
Most Recent Note - 5/11/2010 4:19:52 PM
G - Gained a bit more ground following its gap up on 5/10/10 which promptly repaired the violation of its 50 DMA line, a sign of great institutional support.
>>> The latest Featured Stock Update with an annotated graph appeared on 4/21/2010. Click here.
View all notes |
Alert me of new notes |
CANSLIM.net Company Profile
|
Symbol/Exchange
Company Name
Industry Group |
PRICE |
CHANGE
(%Change) |
Day High |
Volume
(% DAV)
(% 50 day avg vol) |
52 Wk Hi
% From Hi |
Featured
Date |
Price
Featured |
Pivot Featured |
|
Max Buy |
LL
-
NYSE
Lumber Liquidators Hldgs
RETAIL - Home Improvement Stores
|
$30.14
|
+0.67
2.27% |
$30.82
|
289,525
71.79% of 50 DAV
50 DAV is 403,300
|
$33.41
-9.79%
|
4/22/2010
|
$29.87
|
PP = $29.03
|
|
MB = $30.48
|
Most Recent Note - 5/11/2010 4:21:03 PM
G - Gain on lighter volume today. It found support above its 50 DMA line and promptly rebounded back above its December 2009 highs. First featured in yellow at $29.87 in the 4/22/10 the mid-day report (read here).
>>> The latest Featured Stock Update with an annotated graph appeared on 4/26/2010. Click here.
View all notes |
Alert me of new notes |
CANSLIM.net Company Profile
|
LOPE
-
NASDAQ
Grand Canyon Education
DIVERSIFIED SERVICES - Education and; Training Services
|
$24.85
|
-0.15
-0.60% |
$25.32
|
154,890
40.86% of 50 DAV
50 DAV is 379,100
|
$28.46
-12.68%
|
4/13/2010
|
$27.71
|
PP = $27.33
|
|
MB = $28.70
|
Most Recent Note - 5/11/2010 4:22:05 PM
G - Its outlook is increasingly questionable the longer it remains below its 50 DMA line. Many for-profit schools have encountered distributional pressure in the wake of recently proposed regulatory changes.
>>> The latest Featured Stock Update with an annotated graph appeared on 5/10/2010. Click here.
View all notes |
Alert me of new notes |
CANSLIM.net Company Profile
|
ROVI
-
NASDAQ
Rovi Corp
COMPUTER SOFTWARE andamp; SERVICES - Security Software andamp; Services
|
$36.21
|
-0.77
-2.07% |
$36.98
|
1,160,562
88.22% of 50 DAV
50 DAV is 1,315,600
|
$40.06
-9.61%
|
4/20/2010
|
$37.62
|
PP = $38.60
|
|
MB = $40.53
|
Most Recent Note - 5/11/2010 4:31:58 PM
G - Down today on lighter volume, its 50 DMA line has acted as resistance following last week's violation and technical sell signal. Subsequent deterioration under its October 2009 high would raise more serious concerns.
>>> The latest Featured Stock Update with an annotated graph appeared on 5/5/2010. Click here.
View all notes |
Alert me of new notes |
CANSLIM.net Company Profile
|
SIRO
-
NASDAQ
Sirona Dental Systems
HEALTH SERVICES - Medical Instruments andamp; Supplies
|
$38.45
|
+0.34
0.89% |
$39.10
|
468,825
74.32% of 50 DAV
50 DAV is 630,800
|
$43.45
-11.51%
|
2/16/2010
|
$36.43
|
PP = $36.15
|
|
MB = $37.96
|
Most Recent Note - 5/10/2010 4:18:39 PM
G - Small gain today remaining below its 50 DMA line which may now act as resistance. On 5/05/10 it endured heavy distributional pressure after reporting +231% earnings on +15% sales revenues for the quarter ended March 31, 2010 versus the year ago period.
>>> The latest Featured Stock Update with an annotated graph appeared on 4/22/2010. Click here.
View all notes |
Alert me of new notes |
CANSLIM.net Company Profile
|
SUMR
-
NASDAQ
Summer Infant Inc
CONSUMER NON-DURABLES - Personal Products
|
$7.01
|
+0.06
0.86% |
$7.17
|
66,834
135.29% of 50 DAV
50 DAV is 49,400
|
$7.24
-3.18%
|
5/4/2010
|
$6.85
|
PP = $7.09
|
|
MB = $7.44
|
Most Recent Note - 5/11/2010 4:35:21 PM
Y - Hovering within close striking range of its 52-week high. It found great support last week at its 50 DMA line.
>>> The latest Featured Stock Update with an annotated graph appeared on 5/4/2010. Click here.
View all notes |
Alert me of new notes |
CANSLIM.net Company Profile
|
Symbol/Exchange
Company Name
Industry Group |
PRICE |
CHANGE
(%Change) |
Day High |
Volume
(% DAV)
(% 50 day avg vol) |
52 Wk Hi
% From Hi |
Featured
Date |
Price
Featured |
Pivot Featured |
|
Max Buy |
ULTA
-
NASDAQ
Ulta Salon Cosm & Frag
SPECIALTY RETAIL - Specialty Retail, Other
|
$23.40
|
+0.58
2.54% |
$24.09
|
287,284
65.60% of 50 DAV
50 DAV is 437,900
|
$25.76
-9.16%
|
3/12/2010
|
$22.81
|
PP = $21.72
|
|
MB = $22.81
|
Most Recent Note - 5/11/2010 4:38:00 PM
G - Gain today on lighter volume. On 5/10/10 it rallied back above its 50 DMA line and January low, showing prompt and encouraging signs of support.
>>> The latest Featured Stock Update with an annotated graph appeared on 4/30/2010. Click here.
View all notes |
Alert me of new notes |
CANSLIM.net Company Profile
|
VIT
-
NYSE
Vanceinfo Tech Inc Ads
COMPUTER SOFTWARE and SERVICES - Business Software and Services
|
$23.48
|
+0.42
1.82% |
$24.07
|
265,830
34.42% of 50 DAV
50 DAV is 772,300
|
$26.48
-11.33%
|
4/9/2010
|
$23.79
|
PP = $23.95
|
|
MB = $25.15
|
Most Recent Note - 5/11/2010 4:39:05 PM
G - Posted a 3rd consecutive gain today on very light volume. Recently finding support near its 50 DMA line.
>>> The latest Featured Stock Update with an annotated graph appeared on 5/6/2010. Click here.
View all notes |
Alert me of new notes |
CANSLIM.net Company Profile
|
|
|
|
THESE ARE NOT BUY RECOMMENDATIONS!
Comments contained in the body of this report are technical
opinions only. The material herein has been obtained
from sources believed to be reliable and accurate, however,
its accuracy and completeness cannot be guaranteed.
This site is not an investment advisor, hence it does
not endorse or recommend any securities or other investments.
Any recommendation contained in this report may not
be suitable for all investors and it is not to be deemed
an offer or solicitation on our part with respect to
the purchase or sale of any securities. All trademarks,
service marks and trade names appearing in this report
are the property of their respective owners, and are
likewise used for identification purposes only.
This report is a service available
only to active Paid Premium Members.
You may opt-out of receiving report notifications
at any time. Questions or comments may be submitted
by writing to Premium Membership Services 665 S.E. 10 Street, Suite 201 Deerfield Beach, FL 33441-5634 or by calling 1-800-965-8307
or 954-785-1121.
|
|
|


