You are not logged in.
This means you
CAN ONLY VIEW reports that were published prior to Monday, April 14, 2025.
You
MUST UPGRADE YOUR MEMBERSHIP if you want to see any current reports.
AFTER MARKET UPDATE - MONDAY, MAY 10TH, 2010
Previous After Market Report Next After Market Report >>>
|
|
|
|
DOW |
+404.71 |
10,785.14 |
+3.90% |
|
Volume |
1,858,230,840 |
-23% |
|
Volume |
2,753,202,670 |
-32% |
|
NASDAQ |
+109.03 |
2,374.67 |
+4.81% |
|
Advancers |
3,003 |
94% |
|
Advancers |
2,461 |
86% |
|
S&P 500 |
+48.85 |
1,159.73 |
+4.40% |
|
Decliners |
162 |
5% |
|
Decliners |
336 |
12% |
|
Russell 2000 |
+36.61 |
689.61 |
+5.61% |
|
52 Wk Highs |
56 |
|
|
52 Wk Highs |
38 |
|
|
S&P 600 |
+18.23 |
368.92 |
+5.20% |
|
52 Wk Lows |
7 |
|
|
52 Wk Lows |
17 |
|
|
 |
Breadth Positive While Market Rises On Lighter Volume
Adam Sarhan, Contributing Writer,
Stocks surged around the world after European policy makers announced a $1 trillion bailout package designed to end the region's sovereign-debt crisis and save the euro. Volume totals were reported lighter on both the NYSE and on the Nasdaq exchange compared to Friday's very high levels. Advancers trumped decliners by more than a 18-to-1 ratio (if the data is reliable) on the NYSE, and by a 7-to-1 ratio on the Nasdaq exchange, breadth as decidedly bullish as last Thursday's action was bearish. New 52-week highs outnumbered new 52-week lows on the NYSE and on the Nasdaq exchange. There were 7 high-ranked companies from the CANSLIM.net Leaders List that made a new 52-week high and appeared on the CANSLIM.net BreakOuts Page, higher than the 0 issues that appeared on the prior session. Waning leadership has been evidenced by the recent lack of stocks making new highs as the rally came under pressure.
Over the weekend, European governments agreed to lend as much as 750 billion euros (nearly $1 trillion) to the most-indebted countries in the region. The European Central Bank said it will counter "severe tensions" in certain markets by purchasing government and private debt which is a direct contradiction to what they said last week before Thursday's chaos. The EU has decided to fight contagion instead of inflation which is a concern for many market participants because history shows us that when central bankers print excessive amounts of paper, inflation surges. The most recent example occurred over the past three years in Zimbabwe. After a series of ominous policy decisions, including defaulting on their IMF loans, Zimbabwe plunged into a period of hyperinflation. Figures from November 2008 estimated Zimbabwe's annual inflation rate at 89.7 sextillion (1021) percent. By December 2008, inflation was estimated at 6.5 quindecillion novemdecillion percent (65 followed by 107 zeros). In April 2009, Zimbabwe abandoned printing of the Zimbabwean dollar, and started using the South African rand and US dollar as their standard currencies for exchange. The government does not intend to reintroduce their currency until the second half of 2010. Will Europe suffer the same fate? Hopefully not, but the fact that the euro negatively reversed today (opened higher and closed lower) on what would normally be considered news suggests market participants are not happy with the results. In addition, last week alone, a whopping $3.7 trillion was erased from the value of global stock markets.
The technical action in global equity markets is not promising. At this point, several European stock market's have fallen over -20% from their 52-week highs which technically defines a bear market. The major US averages are all trading below their respective 50-day moving average (DMA) lines, which is not healthy. It was also disconcerting to see volume dry up on Monday as the major averages bounced back from egregiously oversold levels, which usually suggests massive short covering, not new buying efforts. A host of leading stocks closed near their lows after a very strong open, which is a subtle sign of distribution. However, this market resolves itself, a proper follow-through day (FTD) must emerge before a new rally can be confirmed. That said, Monday marked Day 1 of a new rally attempt, which means that as long as Monday's lows are not breached the earliest a possible FTD could emerge will be Thursday (Day 4). If Monday's lows are breached then the day count will be reset. Taking the appropriate action on a case-by-case basis with your stocks prompts investors to raise cash when any holdings start getting into the trouble zone. A reminder was added to many Featured Stocks' notes this week -Broader market action (M criteria) is normally expected to impact 3 out of 4 stocks. Trade accordingly.
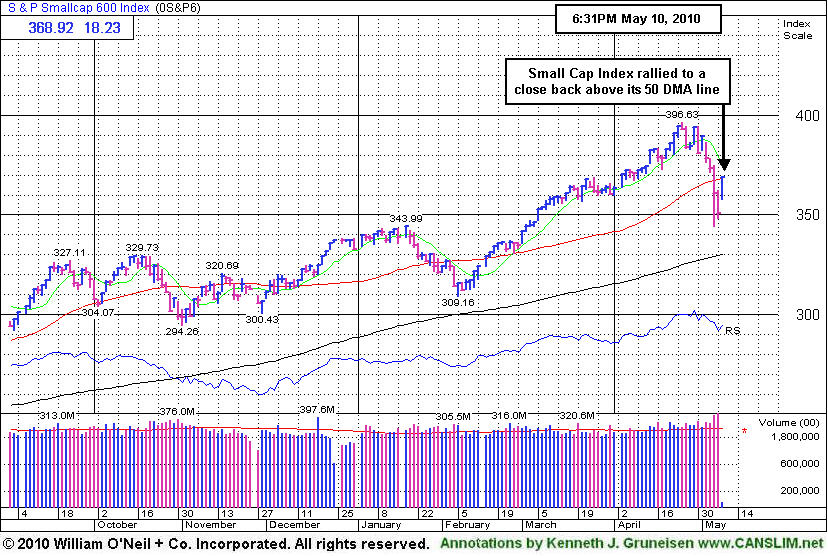
PICTURED: The S&P 600 Small Cap Index rallied to a close back above its 50 DMA line. Time will tell if the other indices can also rebound above their respective short-term averages, but the strength from small caps was an encouraging sign.
|
|
|
 |
Financial, Retail, and Tech Groups Among Large Widespread Gains
Kenneth J. Gruneisen - Passed the CAN SLIM® Master's Exam
Big gains from financial stocks underpinned Monday's hearty rebound as the Bank Index ($BKX +6.21%) and Broker/Dealer Index ($XBD +4.11%) tallied large gains. A solid gain from the Retail Index ($RLX +5.73%) and widespread gains from the tech sector also contributed to the major averages' large gains as the Semiconductor Index ($SOX +5.98%) and Internet Index ($IIX +5.37%) posted better than +5% gains and the Networking Index ($NWX +4.93%) and Biotechnology Index ($BTK +3.64%) were on the rise. The Gold & Silver Index ($XAU +2.79%) was a laggard among defensive group while the Healthcare Index ($HMO +3.21%) rose and strength in energy-related issues boosted the Integrated Oil Index ($XOI +3.81%) and Oil Services Index ($OSX +4.35%).
Charts courtesy www.stockcharts.com
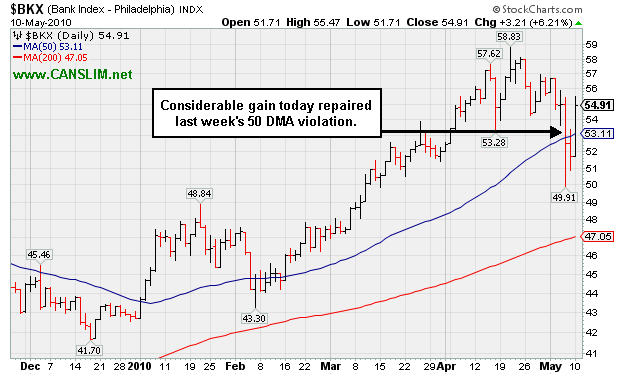
PICTURED 1: The Bank Index ($BKX +6.21%) posted a considerable gain and rallied back above its 50-day moving average (DMA) line.
Charts courtesy www.stockcharts.com
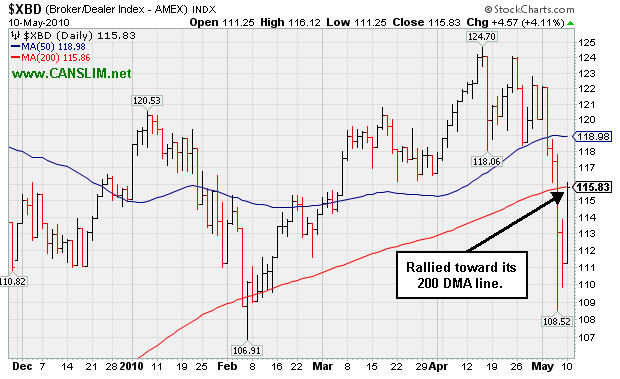
PICTURED 2: The Broker/Dealer Index ($XBD +4.11%) rallied back to its 200 DMA line after 4 consecutive losses led to violations of its 50 and 200 DMA lines.
| Oil Services |
$OSX |
195.94 |
+8.17 |
+4.35% |
+0.52% |
| Healthcare |
$HMO |
1,462.42 |
+45.49 |
+3.21% |
-0.71% |
| Integrated Oil |
$XOI |
1,039.39 |
+38.17 |
+3.81% |
-2.70% |
| Semiconductor |
$SOX |
367.48 |
+20.73 |
+5.98% |
+2.10% |
| Networking |
$NWX |
254.32 |
+11.96 |
+4.93% |
+10.07% |
| Internet |
$IIX |
245.56 |
+12.51 |
+5.37% |
+5.00% |
| Broker/Dealer |
$XBD |
115.83 |
+4.57 |
+4.11% |
+0.67% |
| Retail |
$RLX |
468.69 |
+25.40 |
+5.73% |
+14.00% |
| Gold & Silver |
$XAU |
176.68 |
+4.80 |
+2.79% |
+5.01% |
| Bank |
$BKX |
54.91 |
+3.21 |
+6.21% |
+28.56% |
| Biotech |
$BTK |
1,085.50 |
+38.13 |
+3.64% |
+15.22% |
|
|
|
 |
Distributional Pressure Negated Latest Breakout
Kenneth J. Gruneisen - Passed the CAN SLIM® Master's Exam
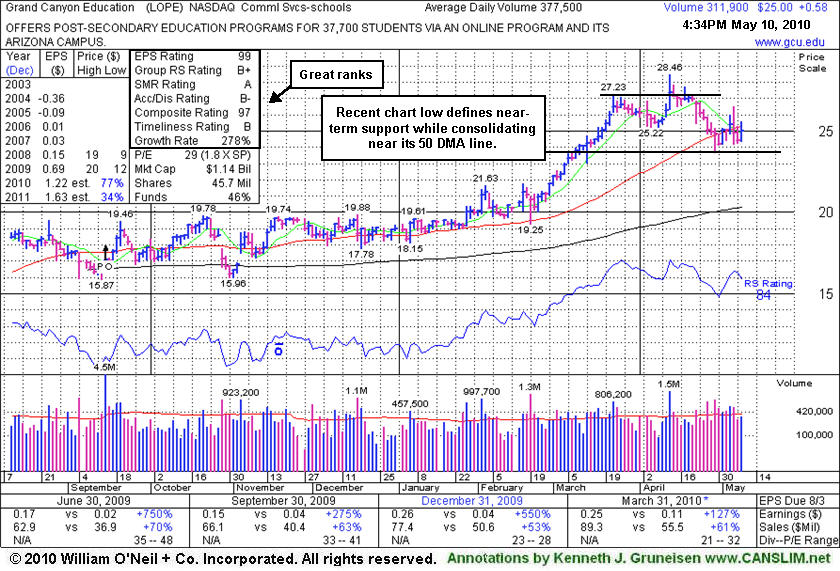
Grand Canyon Education (LOPE +$0.58 or +2.38% to $25.00) posted a small gain today, yet closed below its 50-day moving average (DMA) line. Its recent chart low ($23.66 on 4/29/10) defines near-term support, where further deterioration would raise greater concerns. More time is needed for it to possibly for a sound new base. The number of top-rated funds owning shares rose from 42 in Jun '09 to 58 Mar '10, providing some reassurance concerning the I criteria of the fact-based investment system. Distributional pressure negated its most recent breakout since it was featured in the 4/13/10 mid-day report (read here) when triggering a technical buy after a "3-weeks tight" type pattern. Leadership in the Commercial Services - Schools group was a nice reassurance for the L criteria, but subsequently, many for-profit schools have encountered distributional pressure in the wake of recently proposed regulatory changes. Broader market weakness (the M criteria) did nothing to help its chances.
|
|
|
Color Codes Explained :
Y - Better candidates highlighted by our
staff of experts.
G - Previously featured
in past reports as yellow but may no longer be buyable under the
guidelines.
***Last / Change / Volume data in this table is the closing quote data***
Symbol/Exchange
Company Name
Industry Group |
PRICE |
CHANGE
(%Change) |
Day High |
Volume
(% DAV)
(% 50 day avg vol) |
52 Wk Hi
% From Hi |
Featured
Date |
Price
Featured |
Pivot Featured |
|
Max Buy |
BIDU
-
NASDAQ
Baidu Inc Ads
INTERNET - Internet Information Providers
|
$694.04
|
+54.55
8.53% |
$694.50
|
1,662,084
106.94% of 50 DAV
50 DAV is 1,554,200
|
$718.00
-3.34%
|
1/13/2010
|
$431.25
|
PP = $426.75
|
|
MB = $448.09
|
 Most Recent Note - 5/10/2010 2:16:31 PM
G - Gapped up today after last week's loss broke a 13 week winning streak. A follow-through day between days 4-7 after the major indices (M criteria) get their initial foothold would be the most ideal confirmation of a healthy and sustainable new rally effort.
 >>> The latest Featured Stock Update with an annotated graph appeared on 4/20/2010. Click here. >>> The latest Featured Stock Update with an annotated graph appeared on 4/20/2010. Click here.
View all notes |
Alert me of new notes |
CANSLIM.net Company Profile
|
BPI
-
NYSE
Bridgepoint Education
DIVERSIFIED SERVICES - Education and; Training Services
|
$24.36
|
+1.52
6.65% |
$25.19
|
226,726
42.39% of 50 DAV
50 DAV is 534,800
|
$27.50
-11.42%
|
4/13/2010
|
$25.59
|
PP = $25.76
|
|
MB = $27.05
|
Most Recent Note - 5/10/2010 2:19:28 PM
G - Gapped up today, finding prompt support and rallying back above its 50 DMA line, yet volume is very light behind the gain. The Commercial Services - Schools firm was featured in yellow in the 4/13/10 mid-day report (read here) as rose from a cup-with-high-handle.
>>> The latest Featured Stock Update with an annotated graph appeared on 5/7/2010. Click here.
View all notes |
Alert me of new notes |
CANSLIM.net Company Profile
|
BRLI
-
NASDAQ
Bio Reference Labs Inc
HEALTH SERVICES - Medical Laboratories and Researc
|
$21.94
|
+1.15
5.53% |
$22.14
|
166,580
85.78% of 50 DAV
50 DAV is 194,200
|
$24.67
-11.08%
|
2/12/2010
|
$39.02
|
PP = $20.49
|
|
MB = $21.51
|
Most Recent Note - 5/7/2010 3:31:51 PM
G - Damaging loss today on higher volume, sinking further below its 50 DMA line. Wild action on 5/06/10 intra-day undercut its 200 DMA line and revisited its November 2009 lows, yet it rebounded to close near its 50 DMA line and in the upper part of its range. Broader market action (M criteria) is normally expected to impact 3 out of 4 stocks, and widespread losses effectively ended the latest rally.
>>> The latest Featured Stock Update with an annotated graph appeared on 4/16/2010. Click here.
View all notes |
Alert me of new notes |
CANSLIM.net Company Profile
|
CISG
-
NASDAQ
Cninsure Inc Ads
INSURANCE - Insurance Brokers
|
$25.96
|
+2.01
8.39% |
$26.67
|
193,382
70.02% of 50 DAV
50 DAV is 276,200
|
$28.62
-9.29%
|
3/3/2010
|
$24.38
|
PP = $23.10
|
|
MB = $24.26
|
Most Recent Note - 5/10/2010 1:17:42 PM
G - Rallying toward its 50 DMA line today after triggering technical sell signals last week. Its color code was changed to green based on the violation.
>>> The latest Featured Stock Update with an annotated graph appeared on 4/19/2010. Click here.
View all notes |
Alert me of new notes |
CANSLIM.net Company Profile
|
CRM
-
NYSE
Salesforce.Com Inc
INTERNET - Internet Software and Services
|
$85.48
|
+7.96
10.27% |
$85.58
|
2,652,523
155.55% of 50 DAV
50 DAV is 1,705,300
|
$89.50
-4.49%
|
3/5/2010
|
$72.28
|
PP = $75.53
|
|
MB = $79.31
|
Most Recent Note - 5/10/2010 12:19:40 PM
G - Gapped up today for a considerable gain, promptly repairing the violation of its 50 DMA line, a sign of great institutional support. A follow-through day between days 4-7 after the major indices (M criteria) get their initial foothold would be the most ideal confirmation of a healthy and sustainable new rally effort.
>>> The latest Featured Stock Update with an annotated graph appeared on 4/21/2010. Click here.
View all notes |
Alert me of new notes |
CANSLIM.net Company Profile
|
Symbol/Exchange
Company Name
Industry Group |
PRICE |
CHANGE
(%Change) |
Day High |
Volume
(% DAV)
(% 50 day avg vol) |
52 Wk Hi
% From Hi |
Featured
Date |
Price
Featured |
Pivot Featured |
|
Max Buy |
LL
-
NYSE
Lumber Liquidators Hldgs
RETAIL - Home Improvement Stores
|
$29.49
|
+1.47
5.25% |
$29.68
|
334,929
81.73% of 50 DAV
50 DAV is 409,800
|
$33.41
-11.73%
|
4/22/2010
|
$29.87
|
PP = $29.03
|
|
MB = $30.48
|
Most Recent Note - 5/10/2010 2:54:56 PM
G - Gapped up today, finding support above its 50 DMA line and promptly rebounding back above its December 2009 highs. First featured in yellow at $29.87 in the 4/22/10 the mid-day report (read here).
>>> The latest Featured Stock Update with an annotated graph appeared on 4/26/2010. Click here.
View all notes |
Alert me of new notes |
CANSLIM.net Company Profile
|
LOPE
-
NASDAQ
Grand Canyon Education
DIVERSIFIED SERVICES - Education and; Training Services
|
$25.00
|
+0.58
2.38% |
$25.60
|
287,502
76.16% of 50 DAV
50 DAV is 377,500
|
$28.46
-12.16%
|
4/13/2010
|
$27.71
|
PP = $27.33
|
|
MB = $28.70
|
Most Recent Note - 5/7/2010 4:15:53 PM
G - Closed below its 50 DMA line today with its 11th loss in 13 sessions. Many for-profit schools have encountered distributional pressure in the wake of recently proposed regulatory changes.
>>> The latest Featured Stock Update with an annotated graph appeared on 4/14/2010. Click here.
View all notes |
Alert me of new notes |
CANSLIM.net Company Profile
|
ROVI
-
NASDAQ
Rovi Corp
COMPUTER SOFTWARE andamp; SERVICES - Security Software andamp; Services
|
$36.87
|
+1.77
5.04% |
$37.35
|
1,473,223
112.73% of 50 DAV
50 DAV is 1,306,900
|
$40.06
-7.96%
|
4/20/2010
|
$37.62
|
PP = $38.60
|
|
MB = $40.53
|
Most Recent Note - 5/10/2010 3:52:04 PM
G - Gapped up today, promptly rallying back above its April low while still remaining under its 50 DMA line. Subsequent deterioration under its October 2009 high would raise more serious concerns.
>>> The latest Featured Stock Update with an annotated graph appeared on 5/5/2010. Click here.
View all notes |
Alert me of new notes |
CANSLIM.net Company Profile
|
SIRO
-
NASDAQ
Sirona Dental Systems
HEALTH SERVICES - Medical Instruments andamp; Supplies
|
$38.04
|
+0.87
2.34% |
$38.95
|
950,958
153.55% of 50 DAV
50 DAV is 619,300
|
$43.45
-12.45%
|
2/16/2010
|
$36.43
|
PP = $36.15
|
|
MB = $37.96
|
Most Recent Note - 5/7/2010 4:24:40 PM
G - Loss today with above average volume, closing the week below its 50 DMA line. On 5/05/10 it endured heavy distributional pressure after reporting +231% earnings on +15% sales revenues for the quarter ended March 31, 2010 versus the year ago period.
>>> The latest Featured Stock Update with an annotated graph appeared on 4/22/2010. Click here.
View all notes |
Alert me of new notes |
CANSLIM.net Company Profile
|
SUMR
-
NASDAQ
Summer Infant Inc
CONSUMER NON-DURABLES - Personal Products
|
$6.95
|
+0.37
5.70% |
$7.07
|
105,818
222.77% of 50 DAV
50 DAV is 47,500
|
$7.24
-4.01%
|
5/4/2010
|
$6.85
|
PP = $7.09
|
|
MB = $7.44
|
Most Recent Note - 5/10/2010 12:55:59 PM
Y - Perched within close striking range of its 52-week high, it found support last week at its 50 DMA line. Featured in the 5/04/10 mid-day report (read here) - "Inching into new high ground this week on the right side of a 7-week flat base above its 50 DMA line and well above prior chart highs in the $5 area. Color code is yellow with pivot point noted based upon its 3/15/10 high plus ten cents. Quarterly earnings (C criteria) in the 2 latest quarterly comparisons showed great increases while sales revenues growth accelerated to +27% in the period ended Mach 31, 2010. It has a good annual earnings (A criteria) history, and a small supply (S criteria) of only 11.0 million shares in the public float. Technically, a gain and strong close above its pivot point with heavy volume would trigger a buy signal."
>>> The latest Featured Stock Update with an annotated graph appeared on 5/4/2010. Click here.
View all notes |
Alert me of new notes |
CANSLIM.net Company Profile
|
Symbol/Exchange
Company Name
Industry Group |
PRICE |
CHANGE
(%Change) |
Day High |
Volume
(% DAV)
(% 50 day avg vol) |
52 Wk Hi
% From Hi |
Featured
Date |
Price
Featured |
Pivot Featured |
|
Max Buy |
ULTA
-
NASDAQ
Ulta Salon Cosm & Frag
SPECIALTY RETAIL - Specialty Retail, Other
|
$22.75
|
+1.51
7.11% |
$23.00
|
288,902
66.71% of 50 DAV
50 DAV is 433,100
|
$25.76
-11.68%
|
3/12/2010
|
$22.81
|
PP = $21.72
|
|
MB = $22.81
|
Most Recent Note - 5/10/2010 3:56:22 PM
G - Gapped up today, rallying back above its 50 DMA line and January low. The prompt rebound above its short-term average is an encouraging sign of support that helps its outlook.
>>> The latest Featured Stock Update with an annotated graph appeared on 4/30/2010. Click here.
View all notes |
Alert me of new notes |
CANSLIM.net Company Profile
|
VIT
-
NYSE
Vanceinfo Tech Inc Ads
COMPUTER SOFTWARE and SERVICES - Business Software and Services
|
$23.00
|
+0.22
0.97% |
$24.47
|
397,395
51.54% of 50 DAV
50 DAV is 771,100
|
$26.48
-13.14%
|
4/9/2010
|
$23.79
|
PP = $23.95
|
|
MB = $25.15
|
Most Recent Note - 5/7/2010 4:30:29 PM
G - Gain today helped it make a stand near its 50 DMA line. Color code was changed to green based on recent distributional action. Broader market action (M criteria) is normally expected to impact 3 out of 4 stocks, and widespread losses effectively ended the latest rally.
>>> The latest Featured Stock Update with an annotated graph appeared on 5/6/2010. Click here.
View all notes |
Alert me of new notes |
CANSLIM.net Company Profile
|
|
|
|
THESE ARE NOT BUY RECOMMENDATIONS!
Comments contained in the body of this report are technical
opinions only. The material herein has been obtained
from sources believed to be reliable and accurate, however,
its accuracy and completeness cannot be guaranteed.
This site is not an investment advisor, hence it does
not endorse or recommend any securities or other investments.
Any recommendation contained in this report may not
be suitable for all investors and it is not to be deemed
an offer or solicitation on our part with respect to
the purchase or sale of any securities. All trademarks,
service marks and trade names appearing in this report
are the property of their respective owners, and are
likewise used for identification purposes only.
This report is a service available
only to active Paid Premium Members.
You may opt-out of receiving report notifications
at any time. Questions or comments may be submitted
by writing to Premium Membership Services 665 S.E. 10 Street, Suite 201 Deerfield Beach, FL 33441-5634 or by calling 1-800-965-8307
or 954-785-1121.
|
|
|


