***Last / Change / Volume data in this table is the closing quote data***
Symbol/Exchange
Company Name
Industry Group |
PRICE |
CHANGE
(%Change) |
Day High |
Volume
(% DAV)
(% 50 day avg vol) |
52 Wk Hi
% From Hi |
Featured
Date |
Price
Featured |
Pivot Featured |
|
Max Buy |
ACN
-
NYSE
Accenture Plc
DIVERSIFIED SERVICES - Business/Management Services
|
$59.22
|
-0.12
-0.20% |
$59.72
|
5,242,164
152.84% of 50 DAV
50 DAV is 3,429,900
|
$65.89
-10.12%
|
3/23/2012
|
$64.13
|
PP = $63.76
|
|
MB = $66.95
|
Most Recent Note - 5/7/2012 1:23:00 PM
G - Triggering a worrisome technical sell signal as it gapped down today, sinking under prior highs in the $62-63 area. A weak finish on the prior session led to a close just below its 50 DMA line. Its color code is changed to green.
>>> The latest Featured Stock Update with an annotated graph appeared on 3/23/2012. Click here.
View all notes |
Alert me of new notes |
CANSLIM.net Company Profile |
SEC |
Zacks Reports |
StockTalk |
News |
Chart |
Request a new note
C
A N
S L
I M


|
ADS
-
NYSE
Alliance Data Sys Corp
COMPUTER SOFTWARE and SERVICES - Information and Delivery Service
|
$124.65
|
-0.27
-0.22% |
$125.24
|
340,354
59.80% of 50 DAV
50 DAV is 569,200
|
$130.66
-4.60%
|
1/17/2012
|
$108.24
|
PP = $107.43
|
|
MB = $112.80
|
Most Recent Note - 5/8/2012 6:24:55 PM
G - Finished near the session high and just below its 50 DMA line after today's 4th consecutive loss with below average volume. Sub par earnings increases in the 2 latest quarterly reports (Dec '11 and Mar '12) raised fundamental concerns. Its prior low ($122.78 on 4/10/12) defines the next important support to watch where any violation would trigger a more worrisome technical sell signal.
>>> The latest Featured Stock Update with an annotated graph appeared on 4/24/2012. Click here.
View all notes |
Alert me of new notes |
CANSLIM.net Company Profile |
SEC |
Zacks Reports |
StockTalk |
News |
Chart |
Request a new note
C
A N
S L
I M
|
ALLT
-
NASDAQ
Allot Communications Ltd
COMPUTER SOFTWARE andamp; SERVICES - Technical andamp; System Software
|
$23.95
|
+0.81
3.50% |
$24.16
|
944,427
197.95% of 50 DAV
50 DAV is 477,100
|
$26.97
-11.20%
|
3/13/2012
|
$19.72
|
PP = $18.91
|
|
MB = $19.86
|
Most Recent Note - 5/7/2012 1:27:26 PM
G - Pulling back from its all-time high with today's 3rd consecutive loss. It is extended from its prior base. Recent lows ($22.46 on 4/23/12) define near-term support above its 50 DMA line.
>>> The latest Featured Stock Update with an annotated graph appeared on 3/19/2012. Click here.
View all notes |
Alert me of new notes |
CANSLIM.net Company Profile |
SEC |
Zacks Reports |
StockTalk |
News |
Chart |
Request a new note
C
A N
S L
I M
|
ALXN
-
NASDAQ
Alexion Pharmaceuticals
DRUGS - Drug Manufacturers - Other
|
$84.34
|
-1.41
-1.64% |
$85.25
|
1,050,558
85.00% of 50 DAV
50 DAV is 1,236,000
|
$95.01
-11.23%
|
5/1/2012
|
$91.73
|
PP = $95.11
|
|
MB = $99.87
|
Most Recent Note - 5/7/2012 9:52:21 AM
G - Gapped down today after violating its 50 DMA line on the prior session and finishing near the session low. Did not trade above the new pivot point cited based on its 3/26/12 high plus 10 cents after building an orderly flat base. Previously noted - "The late-stage base may be a riskier set-up, yet volume-driven gains could trigger a new (or add-on) technical buy signal."
>>> The latest Featured Stock Update with an annotated graph appeared on 4/16/2012. Click here.
View all notes |
Alert me of new notes |
CANSLIM.net Company Profile |
SEC |
Zacks Reports |
StockTalk |
News |
Chart |
Request a new note
C
A N
S L
I M
|
ARBA
-
NASDAQ
Ariba Inc
INTERNET - Internet Software and Services
|
$38.92
|
-0.44
-1.12% |
$39.19
|
606,937
61.69% of 50 DAV
50 DAV is 983,800
|
$40.45
-3.78%
|
4/27/2012
|
$38.53
|
PP = $37.24
|
|
MB = $39.10
|
Most Recent Note - 5/8/2012 11:46:17 AM
G - Pulling back under its "max buy" level today amid widespread market weakness. Held its ground stubbornly since its technical breakout on 5 times average volume when highlighted in yellow in the 4/27/12 mid-day breakouts report (read here). Support to watch is at prior highs in the $35-37 area.
>>> The latest Featured Stock Update with an annotated graph appeared on 4/30/2012. Click here.
View all notes |
Alert me of new notes |
CANSLIM.net Company Profile |
SEC |
Zacks Reports |
StockTalk |
News |
Chart |
Request a new note
C
A N
S L
I M
|
Symbol/Exchange
Company Name
Industry Group |
PRICE |
CHANGE
(%Change) |
Day High |
Volume
(% DAV)
(% 50 day avg vol) |
52 Wk Hi
% From Hi |
Featured
Date |
Price
Featured |
Pivot Featured |
|
Max Buy |
CDNS
-
NASDAQ
Cadence Design Systems
COMPUTER SOFTWARE and SERVICES - Technical and System Software
|
$11.13
|
-0.02
-0.18% |
$11.20
|
2,196,050
81.29% of 50 DAV
50 DAV is 2,701,400
|
$12.60
-11.67%
|
2/3/2012
|
$11.66
|
PP = $11.15
|
|
MB = $11.71
|
Most Recent Note - 5/8/2012 6:33:21 PM
G - Finished at the session high today after slumping near its 200 DMA line then rebounding for a small gain after a positive reversal. A rebound above its 50 DMA line is needed for its technical stance and outlook to improve.
>>> The latest Featured Stock Update with an annotated graph appeared on 3/28/2012. Click here.
View all notes |
Alert me of new notes |
CANSLIM.net Company Profile |
SEC |
Zacks Reports |
StockTalk |
News |
Chart |
Request a new note
C
A N
S L
I M
|
CERN
-
NASDAQ
Cerner Corp
COMPUTER SOFTWARE and SERVICES - Healthcare Information Service
|
$78.90
|
-2.51
-3.08% |
$80.40
|
2,337,215
206.74% of 50 DAV
50 DAV is 1,130,500
|
$84.10
-6.18%
|
4/27/2012
|
$77.23
|
PP = $78.63
|
|
MB = $82.56
|
 Most Recent Note - 5/9/2012 12:09:26 PM
G - Gapped down today amid widespread market weakness. Its early loss again tested near prior chart highs that now define a support level.
>>> The latest Featured Stock Update with an annotated graph appeared on 5/1/2012. Click here.
View all notes |
Alert me of new notes |
CANSLIM.net Company Profile |
SEC |
Zacks Reports |
StockTalk |
News |
Chart |
Request a new note
C
A N
S L
I M
|
CMCSA
-
NASDAQ
Comcast Corp Cl A
MEDIA - CATV Systems
|
$29.17
|
-0.23
-0.78% |
$29.45
|
14,891,060
116.97% of 50 DAV
50 DAV is 12,730,700
|
$30.88
-5.52%
|
5/2/2012
|
$30.04
|
PP = $30.51
|
|
MB = $32.04
|
Most Recent Note - 5/7/2012 6:26:56 PM
Y - Hovering near its 50 DMA line. Encountered distributional pressure after its 5/01/12 volume-driven gain triggered a technical buy signal while capping a streak of 6 consecutive gains to a new 52-week high and trading above its 2007 high. See the latest FSU analysis for more details and a new annotated graph.
>>> The latest Featured Stock Update with an annotated graph appeared on 5/7/2012. Click here.
View all notes |
Alert me of new notes |
CANSLIM.net Company Profile |
SEC |
Zacks Reports |
StockTalk |
News |
Chart |
Request a new note
C
A N
S L
I M
|
COO
-
NYSE
Cooper Companies Inc
HEALTH SERVICES - Medical Instruments and Supplies
|
$86.97
|
-0.90
-1.02% |
$87.36
|
189,763
41.87% of 50 DAV
50 DAV is 453,200
|
$89.31
-2.62%
|
3/9/2012
|
$83.05
|
PP = $81.02
|
|
MB = $85.07
|
Most Recent Note - 5/3/2012 11:58:43 AM
G - Small gain today with above average volume conviction while trading at its 52-week and all-time highs above its "max buy" level. It is extended from its prior base. Prior highs in the $83-84 area define near-term support above its 50 DMA line.
>>> The latest Featured Stock Update with an annotated graph appeared on 3/9/2012. Click here.
View all notes |
Alert me of new notes |
CANSLIM.net Company Profile |
SEC |
Zacks Reports |
StockTalk |
News |
Chart |
Request a new note
C
A N
S L
I M
|
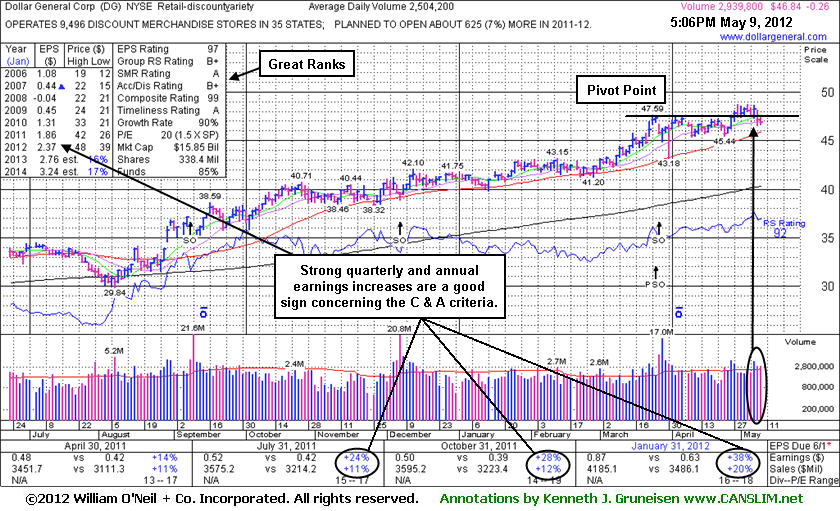
DG
-
NYSE
Dollar General Corp
RETAIL - Discount, Variety Stores
|
$46.84
|
-0.26
-0.55% |
$47.34
|
2,940,019
117.40% of 50 DAV
50 DAV is 2,504,200
|
$48.76
-3.94%
|
5/7/2012
|
$48.51
|
PP = $47.69
|
|
MB = $50.07
|
Most Recent Note - 5/9/2012 5:25:33 PM
Y - Technically, volume-driven gains helped it recently rally from a 5-week flat base, however it has encountered some distributional pressure while market conditions (M criteria) turned for the worse. See the latest FSU analysis for more details and a new annotated graph.
>>> The latest Featured Stock Update with an annotated graph appeared on 5/9/2012. Click here.
View all notes |
Alert me of new notes |
CANSLIM.net Company Profile |
SEC |
Zacks Reports |
StockTalk |
News |
Chart |
Request a new note
C
A N
S L
I M
|
Symbol/Exchange
Company Name
Industry Group |
PRICE |
CHANGE
(%Change) |
Day High |
Volume
(% DAV)
(% 50 day avg vol) |
52 Wk Hi
% From Hi |
Featured
Date |
Price
Featured |
Pivot Featured |
|
Max Buy |
DISH
-
NASDAQ
Dish Network Corp Cl A
CONSUMER DURABLES - Electronic Equipment
|
$30.29
|
-0.61
-1.97% |
$30.82
|
2,684,704
107.61% of 50 DAV
50 DAV is 2,494,900
|
$35.64
-15.01%
|
3/7/2012
|
$30.83
|
PP = $30.10
|
|
MB = $31.61
|
Most Recent Note - 5/4/2012 5:57:48 PM
G - Finished near the session low with a loss today on average volume, closing just under its 50 DMA line. Further deterioration below the 50 DMA or below recent lows ($29.93 on 4/18/12) would raise more serious concerns. Due to report its latest earnings on Monday, May 7, 2012.
>>> The latest Featured Stock Update with an annotated graph appeared on 3/14/2012. Click here.
View all notes |
Alert me of new notes |
CANSLIM.net Company Profile |
SEC |
Zacks Reports |
StockTalk |
News |
Chart |
Request a new note
C
A N
S L
I M
|
EXPE
-
NASDAQ
Expedia Inc
INTERNET - Internet Information Providers
|
$41.14
|
+0.04
0.10% |
$41.74
|
3,560,957
81.70% of 50 DAV
50 DAV is 4,358,400
|
$43.92
-6.33%
|
4/27/2012
|
$41.80
|
PP = $35.57
|
|
MB = $37.35
|
Most Recent Note - 5/3/2012 6:16:41 PM
G - Consolidating after quickly getting extended from its prior base following its appearance highlighted in yellow in the 4/27/12 mid-day breakouts report (read here) after a considerable "breakaway gap" up. See the latest FSU analysis for more details and a new annotated graph.
>>> The latest Featured Stock Update with an annotated graph appeared on 5/3/2012. Click here.
View all notes |
Alert me of new notes |
CANSLIM.net Company Profile |
SEC |
Zacks Reports |
StockTalk |
News |
Chart |
Request a new note
C
A N
S L
I M
|
FEIC
-
NASDAQ
F E I Co
ELECTRONICS - Diversified Electronics
|
$45.43
|
-0.90
-1.94% |
$45.96
|
384,115
117.00% of 50 DAV
50 DAV is 328,300
|
$52.01
-12.65%
|
12/7/2011
|
$41.41
|
PP = $42.35
|
|
MB = $44.47
|
Most Recent Note - 5/7/2012 4:46:17 PM
G - Sank to its 50 DMA line today with a 3rd consecutive loss on near average volume since its "positive reversal" on 5/02/12 after reporting earnings +17% on +10% sales revenues for the quarter ended March 31, 2012 versus the year ago period. Disciplined investors make sell decisions based upon technical action alone, whereas buy decisions are to be made only when both fundamental and technical criteria met. Concerns were raised by its 2 consecutive quarters below the +25% minimum guideline for earnings growth.
>>> The latest Featured Stock Update with an annotated graph appeared on 3/12/2012. Click here.
View all notes |
Alert me of new notes |
CANSLIM.net Company Profile |
SEC |
Zacks Reports |
StockTalk |
News |
Chart |
Request a new note
C
A N
S L
I M
|
GNC
-
NYSE
G N C Holdings Inc
RETAIL - Drug Stores
|
$40.33
|
+1.63
4.21% |
$40.67
|
1,867,430
93.91% of 50 DAV
50 DAV is 1,988,500
|
$41.95
-3.86%
|
1/19/2012
|
$28.99
|
PP = $29.60
|
|
MB = $31.08
|
Most Recent Note - 5/7/2012 4:48:04 PM
G - Consolidating -10.5% off its all-time high today with light volume behind its 3rd consecutive loss. Support to watch is at prior highs near $36 above its 50 DMA line. Reported earnings +82% on +23% sales revenues for the quarter ended March 31, 2012 versus the year ago period.
>>> The latest Featured Stock Update with an annotated graph appeared on 4/26/2012. Click here.
View all notes |
Alert me of new notes |
CANSLIM.net Company Profile |
SEC |
Zacks Reports |
StockTalk |
News |
Chart |
Request a new note
C
A N
S L
I M
|
ISRG
-
NASDAQ
Intuitive Surgical Inc
HEALTH SERVICES - Medical Appliances and Equipment
|
$549.59
|
-7.41
-1.33% |
$556.45
|
438,521
154.03% of 50 DAV
50 DAV is 284,700
|
$594.89
-7.61%
|
12/20/2011
|
$442.43
|
PP = $449.16
|
|
MB = $471.62
|
Most Recent Note - 5/3/2012 3:09:55 PM
G - Still stubbornly holding its ground near its all-time high with volume totals cooling since a considerable gap up gain on 4/18/12. It may produce more climactic gains, however it has not spent much time basing since its last "Featured Date" when highlighted in yellow on 12/23/11. It tallied 11 consecutive weekly gains. Disciplined investors always limit losses if any stock falls -7% from their purchase price.
>>> The latest Featured Stock Update with an annotated graph appeared on 3/1/2012. Click here.
View all notes |
Alert me of new notes |
CANSLIM.net Company Profile |
SEC |
Zacks Reports |
StockTalk |
News |
Chart |
Request a new note
C
A N
S L
I M
|
Symbol/Exchange
Company Name
Industry Group |
PRICE |
CHANGE
(%Change) |
Day High |
Volume
(% DAV)
(% 50 day avg vol) |
52 Wk Hi
% From Hi |
Featured
Date |
Price
Featured |
Pivot Featured |
|
Max Buy |
JAZZ
-
NASDAQ
Jazz Pharmaceuticals Plc
DRUGS - Biotechnology
|
$49.57
|
-0.80
-1.59% |
$50.00
|
1,376,237
139.44% of 50 DAV
50 DAV is 987,000
|
$54.50
-9.05%
|
4/27/2012
|
$51.93
|
PP = $51.39
|
|
MB = $53.96
|
Most Recent Note - 5/9/2012 10:54:55 AM
Y - Reported earnings +54% on +113% sales revenues for the quarter ended March 31, 2012 versus the year ago period. Gapped down today, trading near its 50 DMA line. It stalled after a considerable gap up gain on 4/27/12 backed by 4 times average volume technically cleared a "double bottom" base pattern.
>>> The latest Featured Stock Update with an annotated graph appeared on 4/27/2012. Click here.
View all notes |
Alert me of new notes |
CANSLIM.net Company Profile |
SEC |
Zacks Reports |
StockTalk |
News |
Chart |
Request a new note
C
A N
S L
I M
|
LULU
-
NASDAQ
Lululemon Athletica
MANUFACTURING - Textile Manufacturing
|
$74.06
|
-0.87
-1.16% |
$74.71
|
1,937,556
88.70% of 50 DAV
50 DAV is 2,184,300
|
$81.09
-8.67%
|
5/1/2012
|
$76.05
|
PP = $77.23
|
|
MB = $81.09
|
Most Recent Note - 5/8/2012 11:16:38 AM
G - Down considerably today, raising concerns while violating its 50 DMA line with volume running at an above average pace, and its color code is changed to green. Prior low ($69.64 on 4/24/12) defines important near-term support where further deterioration would raise greater concerns.
>>> The latest Featured Stock Update with an annotated graph appeared on 4/12/2012. Click here.
View all notes |
Alert me of new notes |
CANSLIM.net Company Profile |
SEC |
Zacks Reports |
StockTalk |
News |
Chart |
Request a new note
C
A N
S L
I M
|
MA
-
NYSE
Mastercard Inc Cl A
DIVERSIFIED SERVICES - Business/Management Services
|
$422.83
|
-8.81
-2.04% |
$432.04
|
999,521
110.58% of 50 DAV
50 DAV is 903,900
|
$466.98
-9.45%
|
3/12/2012
|
$419.86
|
PP = $428.67
|
|
MB = $450.10
|
Most Recent Note - 5/8/2012 11:18:57 AM
G - Loss today has it slumping under its 50 DMA line for the first time since 2/01/12, raising concerns. Prior low ($420.75 on 4/23/12) defines near-term support where further deterioration would raise greater concerns.
>>> The latest Featured Stock Update with an annotated graph appeared on 4/11/2012. Click here.
View all notes |
Alert me of new notes |
CANSLIM.net Company Profile |
SEC |
Zacks Reports |
StockTalk |
News |
Chart |
Request a new note
C
A N
S L
I M
|
MELI
-
NASDAQ
Mercadolibre Inc
INTERNET - Internet Software and; Services
|
$77.08
|
-10.91
-12.40% |
$81.98
|
4,731,561
1,007.79% of 50 DAV
50 DAV is 469,500
|
$104.50
-26.24%
|
5/1/2012
|
$99.34
|
PP = $102.98
|
|
MB = $108.13
|
Most Recent Note - 5/9/2012 10:01:31 AM
G - Reported earnings +41% on +36% sales revenues for the quarter ended March 31, 2012 versus the year ago period. Gapped down today and undercut its 200 DMA line with a considerable, damaging loss raising more serious concerns and triggering additional sell signals.
>>> The latest Featured Stock Update with an annotated graph appeared on 3/29/2012. Click here.
View all notes |
Alert me of new notes |
CANSLIM.net Company Profile |
SEC |
Zacks Reports |
StockTalk |
News |
Chart |
Request a new note
C
A N
S L
I M
|
MG
-
NYSE
Mistras Group Inc
DIVERSIFIED SERVICES - Bulding and Faci;ity Management Services
|
$24.03
|
-0.02
-0.08% |
$24.10
|
111,947
115.65% of 50 DAV
50 DAV is 96,800
|
$26.24
-8.42%
|
3/22/2012
|
$24.96
|
PP = $26.34
|
|
MB = $27.66
|
Most Recent Note - 5/7/2012 1:15:32 PM
G - Trading up above its 50 DMA line today. The next near-term support level is its 200 DMA line. Previously noted - "A volume-driven gain above its recent chart high ($25.49 on 3/21/12) may help trigger a proper technical buy signal after a new base formation, however no new (lower) pivot point is currently being cited, and it may continue encountering stubborn resistance."
>>> The latest Featured Stock Update with an annotated graph appeared on 4/2/2012. Click here.
View all notes |
Alert me of new notes |
CANSLIM.net Company Profile |
SEC |
Zacks Reports |
StockTalk |
News |
Chart |
Request a new note
C
A N
S L
I M
|
Symbol/Exchange
Company Name
Industry Group |
PRICE |
CHANGE
(%Change) |
Day High |
Volume
(% DAV)
(% 50 day avg vol) |
52 Wk Hi
% From Hi |
Featured
Date |
Price
Featured |
Pivot Featured |
|
Max Buy |
NTES
-
NASDAQ
Netease Inc Adr
INTERNET - Internet Information Providers
|
$56.91
|
-0.68
-1.18% |
$57.69
|
662,304
98.95% of 50 DAV
50 DAV is 669,300
|
$61.45
-7.39%
|
3/19/2012
|
$56.18
|
PP = $55.10
|
|
MB = $57.86
|
Most Recent Note - 5/8/2012 11:41:12 AM
G - Down considerably today amid widespread market weakness, testing support at its 50 DMA line. Prior low ($55.34 on 4/10/12) defines the next important chart support to watch.
>>> The latest Featured Stock Update with an annotated graph appeared on 3/27/2012. Click here.
View all notes |
Alert me of new notes |
CANSLIM.net Company Profile |
SEC |
Zacks Reports |
StockTalk |
News |
Chart |
Request a new note
C
A N
S L
I M
|
PCLN
-
NASDAQ
Priceline.Com Inc
INTERNET - Internet Software and Services
|
$718.95
|
+2.75
0.38% |
$733.05
|
2,505,103
205.66% of 50 DAV
50 DAV is 1,218,100
|
$774.96
-7.23%
|
4/27/2012
|
$539.46
|
PP = $774.96
|
|
MB = $813.71
|
Most Recent Note - 5/8/2012 11:44:45 AM
Y - Slumping back to its 50 DMA line today amid widespread market weakness. More damaging losses would raise greater concerns, and the next support level is its prior low ($678.04 on 4/24/12). Color code was changed to yellow while rallying from its first test of its 10-week moving average (WMA) since breaking out above resistance in the $554 area in February. The 4/27/12 mid-day report noted - "In the Certification they teach that after an earlier breakout a secondary buy point exists between the first successful test of the 10 WMA up to +5% above its latest high. The 2-week consolidation is not considered a sound base pattern, yet the pivot point cited is based on that recent high. Prior mid-day reports noted - 'Technically, it broke out on 2/13/12 with a volume-driven gain, and now it is getting extended from its prior base. Fundamentals have remained strong since dropped from the Featured Stocks list on 9/29/11. Patient investors may watch for secondary buy points to possibly develop and be noted.'"
>>> The latest Featured Stock Update with an annotated graph appeared on 9/22/2011. Click here.
View all notes |
Alert me of new notes |
CANSLIM.net Company Profile |
SEC |
Zacks Reports |
StockTalk |
News |
Chart |
Request a new note
C
A N
S L
I M
|
RAX
-
NYSE
Rackspace Hosting Inc
INTERNET - Internet Software and; Services
|
$52.62
|
-0.02
-0.04% |
$52.75
|
3,548,109
178.69% of 50 DAV
50 DAV is 1,985,600
|
$60.55
-13.10%
|
4/26/2012
|
$58.39
|
PP = $59.53
|
|
MB = $62.51
|
Most Recent Note - 5/8/2012 11:06:12 AM
G - Reported earnings +70% on +31% sales revenues for the quarter ended March 31, 2012 versus the year ago period. Gapped down violating its 50 DMA line and prior low triggering technical sell signals and its color code is changed to green.
>>> The latest Featured Stock Update with an annotated graph appeared on 4/10/2012. Click here.
View all notes |
Alert me of new notes |
CANSLIM.net Company Profile |
SEC |
Zacks Reports |
StockTalk |
News |
Chart |
Request a new note
C
A N
S L
I M
|
RGR
-
NYSE
Sturm Ruger & Co Inc
CONSUMER DURABLES - Sporting Goods
|
$46.89
|
-0.78
-1.64% |
$51.38
|
958,875
180.17% of 50 DAV
50 DAV is 532,200
|
$58.42
-19.74%
|
3/22/2012
|
$46.49
|
PP = $46.78
|
|
MB = $49.12
|
Most Recent Note - 5/8/2012 11:08:23 AM
G - Down considerably today for a 4th consecutive loss on above average volume, trading below its 50 DMA line, raising concerns.
>>> The latest Featured Stock Update with an annotated graph appeared on 3/22/2012. Click here.
View all notes |
Alert me of new notes |
CANSLIM.net Company Profile |
SEC |
Zacks Reports |
StockTalk |
News |
Chart |
Request a new note
C
A N
S L
I M
|
RNF
-
NYSE
Rentech Nitrogen Ptnr Lp
CHEMICALS - Agricultural Chemicals
|
$24.70
|
-1.80
-6.79% |
$27.57
|
942,710
363.14% of 50 DAV
50 DAV is 259,600
|
$30.39
-18.73%
|
4/27/2012
|
$29.32
|
PP = $28.60
|
|
MB = $30.03
|
Most Recent Note - 5/9/2012 10:05:03 AM
G - Gapped down today, slumping further below its 50 DMA line and raising more serious concerns. Color code is changed to green after damaging technical action. Reporting earnings on Friday, May 11, 2012.
>>> The latest Featured Stock Update with an annotated graph appeared on 5/2/2012. Click here.
View all notes |
Alert me of new notes |
CANSLIM.net Company Profile |
SEC |
Zacks Reports |
StockTalk |
News |
Chart |
Request a new note
C
A N
S L
I M
|
Symbol/Exchange
Company Name
Industry Group |
PRICE |
CHANGE
(%Change) |
Day High |
Volume
(% DAV)
(% 50 day avg vol) |
52 Wk Hi
% From Hi |
Featured
Date |
Price
Featured |
Pivot Featured |
|
Max Buy |
RRTS
-
NYSE
Roadrunner Trans Systems
TRANSPORTATION - Air Delivery and Freight Service
|
$17.90
|
-0.15
-0.83% |
$18.07
|
49,612
49.91% of 50 DAV
50 DAV is 99,400
|
$19.06
-6.09%
|
5/3/2012
|
$18.20
|
PP = $18.69
|
|
MB = $19.62
|
Most Recent Note - 5/4/2012 12:48:08 PM
Y - Holding its ground today following a gap up on the prior session. Color code was changed to yellow with new pivot point cited based on the 52-week high plus 10 cents. Its finish near the prior session low indicated that it encountered resistance, and it still needs a strong finish above the pivot point cited to clinch a proper technical buy signal. Reported earnings +79% on +38% sales revenues for the quarter ended March 31, 2012.
>>> The latest Featured Stock Update with an annotated graph appeared on 4/9/2012. Click here.
View all notes |
Alert me of new notes |
CANSLIM.net Company Profile |
SEC |
Zacks Reports |
StockTalk |
News |
Chart |
Request a new note
C
A N
S L
I M
|
SHFL
-
NASDAQ
Shuffle Master Inc
MANUFACTURING - Diversified Machinery
|
$16.05
|
-0.52
-3.14% |
$17.17
|
581,575
85.34% of 50 DAV
50 DAV is 681,500
|
$18.77
-14.49%
|
3/6/2012
|
$17.07
|
PP = $15.25
|
|
MB = $16.01
|
Most Recent Note - 5/9/2012 4:20:38 PM
G - Gapped down today and slumped further below its 50 DMA line with its 5th consecutive loss, also sinking below its prior low ($16.14 on 4/10/12), raising more serious concerns.
>>> The latest Featured Stock Update with an annotated graph appeared on 3/15/2012. Click here.
View all notes |
Alert me of new notes |
CANSLIM.net Company Profile |
SEC |
Zacks Reports |
StockTalk |
News |
Chart |
Request a new note
C
A N
S L
I M
|
SHOO
-
NASDAQ
Steven Madden Limited
CONSUMER NON-DURABLES - Textile - Apparel Footwear
|
$40.69
|
-0.40
-0.97% |
$42.01
|
330,156
90.90% of 50 DAV
50 DAV is 363,200
|
$45.70
-10.96%
|
4/27/2012
|
$43.20
|
PP = $45.32
|
|
MB = $47.59
|
Most Recent Note - 5/8/2012 11:24:42 AM
G - Gapped down today amid widespread market weakness, particularly in the Retail/Apparel groups. Deterioration below the recent low ($40.91 on 4/24/12) has raised more serious concerns. Earnings growth for the quarter ended March 31, 2012 versus the year ago period was below the +25% minimum guideline.
>>> The latest Featured Stock Update with an annotated graph appeared on 1/4/2011. Click here.
View all notes |
Alert me of new notes |
CANSLIM.net Company Profile |
SEC |
Zacks Reports |
StockTalk |
News |
Chart |
Request a new note
C
A N
S L
I M
|
SWI
-
NYSE
Solarwinds Inc
COMPUTER SOFTWARE and SERVICES - Application Software
|
$45.35
|
-0.14
-0.31% |
$45.92
|
630,863
55.68% of 50 DAV
50 DAV is 1,133,000
|
$47.66
-4.85%
|
4/26/2012
|
$45.15
|
PP = $42.32
|
|
MB = $44.44
|
Most Recent Note - 5/7/2012 1:09:56 PM
G - Pulling back today after holding its ground last week. Quickly got extended from its prior base after it triggered a technical buy signal on 4/26/12 as it was featured in the mid-day report and noted - "Reported earnings +43% on +39% sales revenues for the quarter ended March 31, 2012 versus the year ago period. It held its ground stubbornly after violating its 50 DMA line when a damaging loss with above average volume triggered technical sell signals on 4/10/12 and it was dropped from the Featured Stocks list. Earnings below the +25% guideline for the Dec '11 quarter (+21%) had also raised fundamental concerns at that time, however the stock's resilience and impressive acceleration means that 3 of the past 4 quarterly comparisons are now above the minimum guideline concerning the C criteria. Its annual earnings (A criteria) history has been strong."
>>> The latest Featured Stock Update with an annotated graph appeared on 3/16/2012. Click here.
View all notes |
Alert me of new notes |
CANSLIM.net Company Profile |
SEC |
Zacks Reports |
StockTalk |
News |
Chart |
Request a new note
C
A N
S L
I M
|
SXCI
-
NASDAQ
S X C Health Solutions
COMPUTER SOFTWARE and SERVICES - Healthcare Information Service
|
$90.77
|
+0.04
0.04% |
$91.31
|
635,084
65.49% of 50 DAV
50 DAV is 969,700
|
$100.50
-9.68%
|
2/23/2012
|
$68.24
|
PP = $66.05
|
|
MB = $69.35
|
Most Recent Note - 5/3/2012 2:49:28 PM
G - Reported earnings +58% on +56% sales revenues for the quarter ended March 31, 2012 versus the year ago period. Volume and volatility often increase near earnings news. Pulling back toward recent lows, still too extended from its prior base to be buyable under the investment system's guidelines.
>>> The latest Featured Stock Update with an annotated graph appeared on 3/6/2012. Click here.
View all notes |
Alert me of new notes |
CANSLIM.net Company Profile |
SEC |
Zacks Reports |
StockTalk |
News |
Chart |
Request a new note
C
A N
S L
I M
|
Symbol/Exchange
Company Name
Industry Group |
PRICE |
CHANGE
(%Change) |
Day High |
Volume
(% DAV)
(% 50 day avg vol) |
52 Wk Hi
% From Hi |
Featured
Date |
Price
Featured |
Pivot Featured |
|
Max Buy |
TDC
-
NYSE
Teradata Corp
COMPUTER SOFTWARE and SERVICES - Technical and; System Software
|
$72.35
|
+1.02
1.43% |
$71.99
|
2,253,550
154.10% of 50 DAV
50 DAV is 1,462,400
|
$79.89
-9.44%
|
5/3/2012
|
$79.06
|
PP = $70.73
|
|
MB = $74.27
|
Most Recent Note - 5/8/2012 6:27:19 PM
Y - Pulled back today for a 3rd consecutive loss with above average volume yet finished in the upper third of its intra-day range and still above its pivot point. See the latest FSU analysis for more details and a new annotated graph.
>>> The latest Featured Stock Update with an annotated graph appeared on 5/8/2012. Click here.
View all notes |
Alert me of new notes |
CANSLIM.net Company Profile |
SEC |
Zacks Reports |
StockTalk |
News |
Chart |
Request a new note
C
A N
S L
I M
|
TDG
-
NYSE
Transdigm Group Inc
AEROSPACE/DEFENSE - Aerospace/Defense Products and; Services
|
$125.95
|
-2.56
-1.99% |
$132.69
|
629,678
137.88% of 50 DAV
50 DAV is 456,700
|
$132.69
-5.08%
|
2/29/2012
|
$120.10
|
PP = $118.93
|
|
MB = $124.88
|
Most Recent Note - 5/8/2012 12:31:04 PM
G - Reversed into the red after hitting a new all-time high with today's earlier gains. Reported earnings +72% on +39% sales revenues for the quarter ended March 31, 2012 versus the year ago period. Extended from its prior base and above its "max buy" level. Prior highs in the $118-121 area define chart support to watch on pullbacks.
>>> The latest Featured Stock Update with an annotated graph appeared on 3/30/2012. Click here.
View all notes |
Alert me of new notes |
CANSLIM.net Company Profile |
SEC |
Zacks Reports |
StockTalk |
News |
Chart |
Request a new note
C
A N
S L
I M
|
TIBX
-
NASDAQ
Tibco Software Inc
COMPUTER SOFTWARE and SERVICES - Business Software and Services
|
$31.61
|
+0.16
0.51% |
$31.76
|
2,031,124
67.70% of 50 DAV
50 DAV is 3,000,400
|
$34.67
-8.82%
|
3/30/2012
|
$31.01
|
PP = $31.25
|
|
MB = $32.81
|
Most Recent Note - 5/3/2012 2:51:58 PM
G - Consolidating well above support at prior highs in the $31 area and its 50 DMA line. It is extended from its prior base.
>>> The latest Featured Stock Update with an annotated graph appeared on 4/5/2012. Click here.
View all notes |
Alert me of new notes |
CANSLIM.net Company Profile |
SEC |
Zacks Reports |
StockTalk |
News |
Chart |
Request a new note
C
A N
S L
I M
|
TNGO
-
NASDAQ
Tangoe Inc
COMPUTER SOFTWARE and SERVICES - Technical and System Software
|
$21.97
|
+2.67
13.83% |
$19.49
|
1,971,341
328.17% of 50 DAV
50 DAV is 600,700
|
$21.74
1.06%
|
3/27/2012
|
$19.35
|
PP = $20.00
|
|
MB = $21.00
|
Most Recent Note - 5/9/2012 1:03:54 PM
G - Reported earnings +50% on +53% sales revenues for the quarter ended March 31, 2012 versus the year ago period. Color code is changed to green after rallying above its "max buy" level to new 52-week high territory.
>>> The latest Featured Stock Update with an annotated graph appeared on 4/3/2012. Click here.
View all notes |
Alert me of new notes |
CANSLIM.net Company Profile |
SEC |
Zacks Reports |
StockTalk |
News |
Chart |
Request a new note
C
A N
S L
I M
|
TSCO
-
NASDAQ
Tractor Supply Co
SPECIALTY RETAIL - Specialty Retail, Other
|
$96.70
|
+0.88
0.92% |
$96.11
|
945,235
119.77% of 50 DAV
50 DAV is 789,200
|
$101.20
-4.45%
|
5/1/2012
|
$98.38
|
PP = $101.30
|
|
MB = $106.37
|
Most Recent Note - 5/8/2012 6:29:41 PM
Y - Pulled back and tested support at its 50 DMA line today yet rebounded to finish near the session high. Volume-driven gains to new highs didn't trigger a new (or add-on) technical buy signal in recent weeks.
>>> The latest Featured Stock Update with an annotated graph appeared on 4/17/2012. Click here.
View all notes |
Alert me of new notes |
CANSLIM.net Company Profile |
SEC |
Zacks Reports |
StockTalk |
News |
Chart |
Request a new note
C
A N
S L
I M
|
Symbol/Exchange
Company Name
Industry Group |
PRICE |
CHANGE
(%Change) |
Day High |
Volume
(% DAV)
(% 50 day avg vol) |
52 Wk Hi
% From Hi |
Featured
Date |
Price
Featured |
Pivot Featured |
|
Max Buy |
UA
-
NYSE
Under Armour Inc Cl A
CONSUMER NON-DURABLES - Textile - Apparel Clothing
|
$93.94
|
+1.26
1.36% |
$96.36
|
1,561,055
161.95% of 50 DAV
50 DAV is 963,900
|
$102.86
-8.67%
|
2/15/2012
|
$85.77
|
PP = $84.86
|
|
MB = $89.10
|
Most Recent Note - 5/9/2012 1:06:34 PM
G - Rising back toward its 50 DMA line with today's gain. That short-term average may now act as a resistance level following the violation on the prior session which triggered technical sell signals. Concerns were raised by weaker fundamentals. Reported earnings +22% on +23% sales revenues for the quarter ended March 31, 2012 versus the year ago period, its first quarterly earnings increase below the +25% minimum guideline in more than 2 years.
>>> The latest Featured Stock Update with an annotated graph appeared on 4/4/2012. Click here.
View all notes |
Alert me of new notes |
CANSLIM.net Company Profile |
SEC |
Zacks Reports |
StockTalk |
News |
Chart |
Request a new note
C
A N
S L
I M
|
V
-
NYSE
Visa Inc Cl A
DIVERSIFIED SERVICES - Business/Management Services
|
$117.42
|
-0.72
-0.61% |
$119.08
|
4,415,519
131.72% of 50 DAV
50 DAV is 3,352,100
|
$125.35
-6.33%
|
3/12/2012
|
$116.53
|
PP = $119.46
|
|
MB = $125.43
|
Most Recent Note - 5/4/2012 12:57:25 PM
Y - Rebounding near its 50 DMA line which may now act as a resistance level after the technical violation on the prior session. Previously noted - "Reported earnings +30% on +15% sales revenues for the quarter ended March 31, 2012 versus the year ago period. It dipped below its 50 DMA line with today's 2nd consecutive loss with above average volume, trading to its lowest level since its 4/13/12 gain backed by +49% above average volume technically confirmed a buy signal."
>>> The latest Featured Stock Update with an annotated graph appeared on 3/7/2012. Click here.
View all notes |
Alert me of new notes |
CANSLIM.net Company Profile |
SEC |
Zacks Reports |
StockTalk |
News |
Chart |
Request a new note
C
A N
S L
I M
|
VMW
-
NYSE
Vmware Inc Cl A
COMPUTER SOFTWARE andamp; SERVICES - Technical andamp; System Software
|
$105.33
|
+0.26
0.25% |
$107.38
|
1,367,023
85.50% of 50 DAV
50 DAV is 1,598,900
|
$118.79
-11.33%
|
4/18/2012
|
$110.04
|
PP = $115.29
|
|
MB = $121.05
|
Most Recent Note - 5/8/2012 11:30:43 AM
G - Violated its 50 DMA line and raised greater concerns with today's damaging loss undercutting its prior low ($102.66 on 4/24/12). Color code is changed to green.
>>> The latest Featured Stock Update with an annotated graph appeared on 4/18/2012. Click here.
View all notes |
Alert me of new notes |
CANSLIM.net Company Profile |
SEC |
Zacks Reports |
StockTalk |
News |
Chart |
Request a new note
C
A N
S L
I M
|
VSI
-
NYSE
Vitamin Shoppe Inc
SPECIALTY RETAIL - Specialty Retail, Other
|
$54.07
|
+2.46
4.77% |
$54.16
|
1,305,453
321.94% of 50 DAV
50 DAV is 405,500
|
$54.16
-0.16%
|
4/25/2012
|
$47.77
|
PP = $48.46
|
|
MB = $50.88
|
Most Recent Note - 5/9/2012 1:11:18 PM
G - Reported earnings +30% on +14% sales revenues for the quarter ended March 31, 2012 versus the year ago period. Color code is changed to green after trading up considerably with 2 consecutive volume-driven gains into new 52-week high territory, bucking a broadly negative market.
>>> The latest Featured Stock Update with an annotated graph appeared on 4/25/2012. Click here.
View all notes |
Alert me of new notes |
CANSLIM.net Company Profile |
SEC |
Zacks Reports |
StockTalk |
News |
Chart |
Request a new note
C
A N
S L
I M
|
WFM
-
NASDAQ
Whole Foods Market Inc
RETAIL - Grocery Stores
|
$88.10
|
-0.23
-0.26% |
$89.80
|
1,884,543
120.53% of 50 DAV
50 DAV is 1,563,600
|
$91.50
-3.72%
|
5/3/2012
|
$90.28
|
PP = $86.45
|
|
MB = $90.77
|
Most Recent Note - 5/8/2012 12:41:16 PM
Y - Pulling back toward prior highs with today's 3rd consecutive loss following its considerable "breakaway gap" that cleared an orderly flat base pattern. The is no resistance remaining due to overhead supply. Quarterly comparisons have shown strong earnings increases above the +25% guideline (C criteria). Its annual earnings (A criteria) history has been improving since a downturn in FY '08.

There are no Featured Stock Updates™ available for this stock at this time. You may request one by clicking the Request a New Note link below
View all notes |
Alert me of new notes |
CANSLIM.net Company Profile |
SEC |
Zacks Reports |
StockTalk |
News |
Chart |
Request a new note
C
A N
S L
I M
|
Symbol/Exchange
Company Name
Industry Group |
PRICE |
CHANGE
(%Change) |
Day High |
Volume
(% DAV)
(% 50 day avg vol) |
52 Wk Hi
% From Hi |
Featured
Date |
Price
Featured |
Pivot Featured |
|
Max Buy |