You are not logged in.
This means you
CAN ONLY VIEW reports that were published prior to Monday, February 26, 2024.
You
MUST UPGRADE YOUR MEMBERSHIP if you want to see any current reports.
AFTER MARKET UPDATE - FRIDAY, MAY 8TH, 2020
Previous After Market Report Next After Market Report >>>
|
|
|
|
DOW |
+455.43 |
24,331.32 |
+1.91% |
|
Volume |
908,743,261 |
-5% |
|
Volume |
3,765,321,200 |
+2% |
|
NASDAQ |
+140.06 |
9,119.72 |
+1.56% |
|
Advancers |
2,455 |
84% |
|
Advancers |
2,453 |
75% |
|
S&P 500 |
+47.50 |
2,928.69 |
+1.65% |
|
Decliners |
468 |
16% |
|
Decliners |
797 |
25% |
|
Russell 2000 |
+46.71 |
1,329.64 |
+3.64% |
|
52 Wk Highs |
31 |
|
|
52 Wk Highs |
87 |
|
|
S&P 600 |
+30.41 |
770.87 |
+4.11% |
|
52 Wk Lows |
6 |
|
|
52 Wk Lows |
11 |
|
|
 |
Breadth Clearly Positive as Major Indices Continued to Rally Back
Kenneth J. Gruneisen - Passed the CAN SLIM® Master's Exam
The Dow rallied 455 points, climbing 2.6% for the week. The S&P 500 jumped 1.7%, and posted its first positive week in three with a 3.5% gain. The Nasdaq Composite rose 1.6%, pushing its weekly advance to 6%. Breadth was clearly positive as advancers led decliners by more than a 5-1 margin on the NYSE and more than 3-1 on the Nasdaq exchange. The reported volume totals were mixed, lighter than the prior session on the NYSE and higher on the Nasdaq exchange. There were 34 high-ranked companies from the Leaders List that hit new 52-week highs and were listed on the BreakOuts Page, versus the 33 on the prior session. New 52-week highs expanded and outnumbered shrinking new lows totals on the NYSE and on the Nasdaq exchange. The major indices are in a confirmed uptrend (M criteria). Any sustainable rally requires a healthy crop of new leaders, so the latest improvement is a reassuring sign. Charts used courtesy of www.stockcharts.com
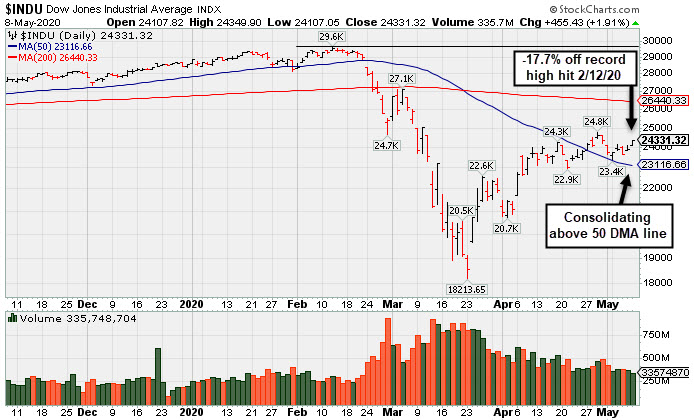
PICTURED: The Dow Jones Industrial Average recently rebounded above its 50-day moving average (DMA) line. It remains -17.7% off its record high hit on 2/12/20
U.S. equities finished near their best levels on Friday as investors assessed a “better-than-feared” jobs report and positive developments in U.S.-China trade relations. On the data front, the Labor Department revealed the U.S. economy lost a record 20.5 million jobs in April, which was below expectations of a 22 million decline. The unemployment rate more than tripled from the prior month to 14.7%, breaking the post-World War II record of 10.8%, but was still below projections of 16% and the Great Depression’s estimated figure of 25.0%.
Treasuries declined along the curve, with the yield on the 10-year note up four basis points to 0.67%. The two-year note rebounded three basis points to 0.15%, after dipping to a fresh intraday-day low of 0.10%. In geopolitical news, top officials from Washington and Beijing reportedly discussed the “phase one” trade accord on a conference call Thursday, with encouraging takeaways.
All 11 S&P 500 sectors ended in positive territory. The Energy group paced the gains with a more than 4% rally as WTI crude jumped more than 24% for the week. Industrials also outperformed during the session, with United Airlines (UAL +11.74%) rising. In earnings, Uber Technologies (UBER +6.01%) rose after reporting a 52% increase in its Uber Eats service. Roku (ROKU -7.88%) fell after revealing an increase in advertising cancellations. |
 Kenneth J. Gruneisen started out as a licensed stockbroker in August 1987, a couple of months prior to the historic stock market crash that took the Dow Jones Industrial Average down -22.6% in a single day. He has published daily fact-based fundamental and technical analysis on high-ranked stocks online for two decades. Through FACTBASEDINVESTING.COM, Kenneth provides educational articles, news, market commentary, and other information regarding proven investment systems that work in good times and bad.
Comments contained in the body of this report are technical opinions only and are not necessarily those of Gruneisen Growth Corp. The material herein has been obtained from sources believed to be reliable and accurate, however, its accuracy and completeness cannot be guaranteed. Our firm, employees, and customers may effect transactions, including transactions contrary to any recommendation herein, or have positions in the securities mentioned herein or options with respect thereto. Any recommendation contained in this report may not be suitable for all investors and it is not to be deemed an offer or solicitation on our part with respect to the purchase or sale of any securities. |
|
 |
Financial, Retail, Tech, and Energy-Linked Groups Posted Gains
Kenneth J. Gruneisen - Passed the CAN SLIM® Master's Exam
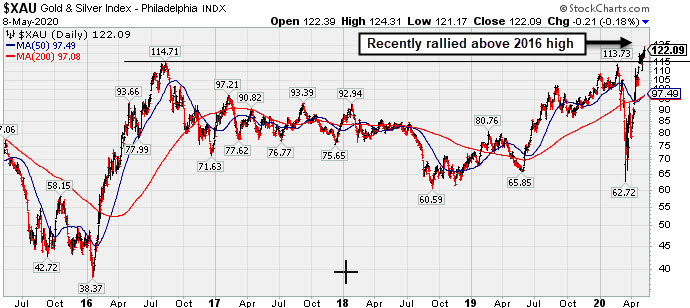
The Bank Index ($BKX +2.86%) and the Broker/Dealer Index ($XBD +2.35%) both posted solid gains. The tech sector had a positive bias as the Networking Index ($NWX +4.37%) again outpaced the Semiconductor Index ($SOX +2.94%) and Biotech Index ($BTK +1.04%). The Retail Index ($RLX +1.19%) also rose. Energy-linked groups also had a positive bias as the Oil Services Index ($OSX +7.28%), Integrated Oil Index ($XOI +4.67%). PICTURED: The Gold & Silver Index ($XAU -0.18%) was a laggard as it ended the session slightly in the red. The 5-year chart shows that it recently has been rallying into new high territory.
| Oil Services |
$OSX |
30.38 |
+2.06 |
+7.27% |
-61.20% |
| Integrated Oil |
$XOI |
796.60 |
+35.55 |
+4.67% |
-37.30% |
| Semiconductor |
$SOX |
1,776.38 |
+51.45 |
+2.98% |
-3.96% |
| Networking |
$NWX |
539.72 |
+22.62 |
+4.37% |
-7.49% |
| Broker/Dealer |
$XBD |
245.44 |
+5.64 |
+2.35% |
-15.48% |
| Retail |
$RLX |
2,661.44 |
+31.31 |
+1.19% |
+8.66% |
| Gold & Silver |
$XAU |
122.09 |
-0.21 |
-0.17% |
+14.19% |
| Bank |
$BKX |
71.12 |
+1.96 |
+2.83% |
-37.26% |
| Biotech |
$BTK |
5,368.66 |
+55.13 |
+1.04% |
+5.94% |
|
|
|
 |
Light Volume Gain for New High Close Caps 7th Straight Weekly Gain
Kenneth J. Gruneisen - Passed the CAN SLIM® Master's Exam
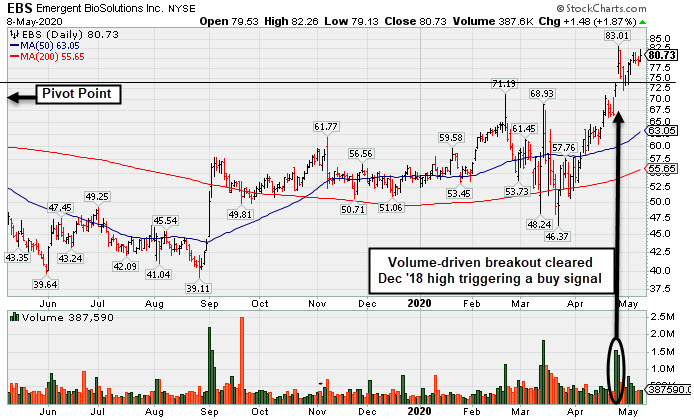
Emergent Biosolutions (EBS +$1.48 or +1.87% to $80.73) posted a gain today with light volume for a best-ever close. Recently it reported Mar '20 earnings of 1 cent per share versus a 10 cents per share loss for the year ago period with +1% better sales revenues. Prior highs in the $71-73 area define initial support to watch on pullbacks.
EBS finished strong after highlighted in yellow with pivot point cited based on its December 2018 high in the 4/24/20 mid-day report (read here). It gapped up hitting a new 52-week high and touched a new all-time high (N criteria). Subsequent gains and strong close above the pivot point backed by more than +40% above average volume clinched a convincing technical buy signal (see the annotated graph below).
EBS was last shown in this FSU section on 4/24/20 with an annotated graph under the headline, "Volume-Driven Gain for Vaccine Maker With Great Earnings History". It currently has a 90 Earnings Per Share Rating, putting it in the top 10% of all publicly traded companies based on its earnings history. It reported earnings +101% on +33% sales revenues for the Dec '19 quarter, and earnings +120% on +80% sales revenues in the Sep '19 quarter, very strong quarterly comparisons versus the year ago periods. Annual earnings history (A criteria) has been strong since a downturn in FY '16.
It has a small supply (S criteria) of only 44.9 million shares in the publicly traded float which can contribute to greater price volatility in the event of institutional buying or selling. The number of top-rated funds owning its shares rose from 453 in Sep '19 to 464 in Mar '20, and its current Up/Down Volume Ratio of 1.4 is an unbiased indication its shares have been under accumulation over the past 50 days. It has an A Timeliness rating and an A- Accumulation/Distribution rating. The company is in the Medical - Biomed/Biotech industry group which is a leading group currently ranked 6th out of the 197 industry groups (L criteria). |
|
|
Color Codes Explained :
Y - Better candidates highlighted by our
staff of experts.
G - Previously featured
in past reports as yellow but may no longer be buyable under the
guidelines.
***Last / Change / Volume data in this table is the closing quote data***
Symbol/Exchange
Company Name
Industry Group |
PRICE |
CHANGE
(%Change) |
Day High |
Volume
(% DAV)
(% 50 day avg vol) |
52 Wk Hi
% From Hi |
Featured
Date |
Price
Featured |
Pivot Featured |
|
Max Buy |
 FTNT
-
NASDAQ
FTNT
-
NASDAQ
Fortinet Inc
Computer Sftwr-Security
|
$136.84
|
+1.72
1.27% |
$137.08
|
2,556,850
99.45% of 50 DAV
50 DAV is 2,571,000
|
$136.85
-0.01%
|
5/7/2020
|
$134.40
|
PP = $121.92
|
|
MB = $128.02
|
Most Recent Note - 5/7/2020 6:39:40 PM
Y - Finished strong today after highlighted in yellow with new pivot point cited based on its 2/06/20 high plus 10 cents. Fundamentals remain strong. Bullish action came after it reported earnings +30% on +22% sales revenues for the Mar '20 quarter. Hit a new all-time high with a big "breakaway gap" backed by +114% above average volume triggering a technical buy signal. Rebounded impressively after slumping well below its 200 DMA line since dropped from the Featured Stocks list on 3/09/20. See the latest FSU analysis for more details and a new annotated graph.
>>> FEATURED STOCK ARTICLE : Gap Up and Big Volume-Driven Gain for Computer Security Firm - 5/7/2020 |
View all notes |
Set NEW NOTE alert |
Company Profile |
SEC
News |
Chart |
Request a new note
C
A
S
I |
EBS
-
NYSE
Emergent Biosolutions
DRUGS - Biotechnology
|
$80.73
|
+1.48
1.87% |
$82.26
|
387,590
66.60% of 50 DAV
50 DAV is 582,000
|
$83.01
-2.75%
|
4/24/2020
|
$72.10
|
PP = $73.99
|
|
MB = $77.69
|
 Most Recent Note - 5/8/2020 5:22:25 PM
G - Posted a gain with light volume today for a best-ever close. Prior highs in the $71-73 area define initial support to watch on pullbacks. Fundamentals remain strong. See the latest FSU analysis for more details and a new annotated graph.
>>> FEATURED STOCK ARTICLE : Light Volume Gain for New High Close Caps 7th Straight Weekly Gain - 5/8/2020 |
View all notes |
Set NEW NOTE alert |
Company Profile |
SEC
News |
Chart |
Request a new note
C
A
S
I |
TREX
-
NYSE
Trex Company Inc
MATERIALS and CONSTRUCTION - General Building Materials
|
$115.09
|
+4.76
4.31% |
$115.70
|
884,390
80.99% of 50 DAV
50 DAV is 1,092,000
|
$114.48
0.53%
|
5/5/2020
|
$109.05
|
PP = $111.95
|
|
MB = $117.55
|
Most Recent Note - 5/8/2020 5:27:24 PM
Y - Posted a gain today with below average volume as it hit a new all-time high approaching its "max buy" level. Gains above the pivot point must be backed by at least +40% above average volume to trigger a proper technical buy signal. Has a new CEO as of 4/29/20. Fundamentals remain strong.
>>> FEATURED STOCK ARTICLE : Gapped Up for Volume-Driven Gain and Hit a New All-Time High - 5/5/2020 |
View all notes |
Set NEW NOTE alert |
Company Profile |
SEC
News |
Chart |
Request a new note
C
A
S
I |
NFLX
-
NASDAQ
Netflix Inc
SPECIALTY RETAIL - Music and Video Stores
|
$435.55
|
-0.98
-0.22% |
$442.00
|
5,020,095
51.87% of 50 DAV
50 DAV is 9,678,000
|
$449.52
-3.11%
|
4/13/2020
|
$393.60
|
PP = $393.62
|
|
MB = $413.30
|
Most Recent Note - 5/6/2020 7:16:52 PM
G - Posted another gain today with light volume. Prior highs in the $393 area acted as support following the recent breakout. Fundamentals remain strong after it reported earnings +107% on +28% sales revenues for the Mar '20 quarter versus the year ago period. See the latest FSU analysis for more details and a new annotated graph.
>>> FEATURED STOCK ARTICLE : Prior Highs Acted as Support Following Recent Breakout - 5/6/2020 |
View all notes |
Set NEW NOTE alert |
Company Profile |
SEC
News |
Chart |
Request a new note
C
A
S
I |
NOW
-
NYSE
Servicenow Inc
Computer Sftwr-Enterprse
|
$377.26
|
-4.57
-1.20% |
$387.60
|
2,096,537
73.98% of 50 DAV
50 DAV is 2,834,000
|
$386.58
-2.41%
|
4/30/2020
|
$343.05
|
PP = $363.05
|
|
MB = $381.20
|
Most Recent Note - 5/7/2020 6:41:21 PM
Y - Hit another new high challenging its "max buy" level with today's big gain backed by near average volume. Gains above the pivot point should be backed by at least +40% above average volume to clinch a proper technical buy signal.
>>> FEATURED STOCK ARTICLE : Fundamental Strength Continues; Volume Heavy Behind Big Gain - 4/30/2020 |
View all notes |
Set NEW NOTE alert |
Company Profile |
SEC
News |
Chart |
Request a new note
C
A
S
I |
Symbol/Exchange
Company Name
Industry Group |
PRICE |
CHANGE
(%Change) |
Day High |
Volume
(% DAV)
(% 50 day avg vol) |
52 Wk Hi
% From Hi |
Featured
Date |
Price
Featured |
Pivot Featured |
|
Max Buy |
QLYS
-
NASDAQ
Qualys Inc
Computer Sftwr-Security
|
$104.40
|
-6.85
-6.16% |
$108.98
|
1,248,413
226.57% of 50 DAV
50 DAV is 551,000
|
$111.79
-6.61%
|
4/9/2020
|
$100.44
|
PP = $97.22
|
|
MB = $102.08
|
Most Recent Note - 5/8/2020 5:23:53 PM
G - Color code is changed to green after finishing the session above its "max buy" level. Pulled back after reporting Mar '20 quarterly earnings +33% on +14% sales revenues versus the year ago period, continuing its strong earnings track record. Volume and volatility often increase near earnings news. Abruptly retreated from its new all-time high hit in the prior session. Prior highs in the $97 area recently acted as support.
>>> FEATURED STOCK ARTICLE : Volume Totals Cooling While Stubbornly Holding Ground Near High - 4/27/2020 |
View all notes |
Set NEW NOTE alert |
Company Profile |
SEC
News |
Chart |
Request a new note
C
A
S
I |
TEAM
-
NASDAQ
Atlassian Corp Plc Cl A
Comp Sftwr-Spec Enterprs
|
$176.19
|
-3.59
-2.00% |
$182.60
|
1,748,941
82.93% of 50 DAV
50 DAV is 2,109,000
|
$180.64
-2.46%
|
5/4/2020
|
$159.70
|
PP = $156.22
|
|
MB = $164.03
|
Most Recent Note - 5/7/2020 6:45:57 PM
G - Posted a 4th consecutive gain today, getting more extended from the previously noted base. Prior highs in the $156 area define initial support to watch on pullbacks.
>>> FEATURED STOCK ARTICLE : Volume-Driven Gain For New All-Time High - 5/4/2020 |
View all notes |
Set NEW NOTE alert |
Company Profile |
SEC
News |
Chart |
Request a new note
C
A
S
I |
AAXN
-
NASDAQ
Axon Enterprise Inc
Security/Sfty
|
$86.13
|
+15.85
22.55% |
$86.48
|
3,485,113
421.93% of 50 DAV
50 DAV is 826,000
|
$90.10
-4.41%
|
5/8/2020
|
$84.86
|
PP = $90.20
|
|
MB = $94.71
|
Most Recent Note - 5/8/2020 5:20:16 PM
Y - Finished strong after highlighted in yellow in the earlier mid-day report with pivot point cited based upon its 2/19/20 high plus 10 cents (read There are no Featured Stock Updates™ available for this stock at this time. You may request one by clicking the Request a New Note link below |
View all notes |
Set NEW NOTE alert |
Company Profile |
SEC
News |
Chart |
Request a new note
C
A
S
I |
|
|
|
THESE ARE NOT BUY RECOMMENDATIONS!
Comments contained in the body of this report are technical
opinions only. The material herein has been obtained
from sources believed to be reliable and accurate, however,
its accuracy and completeness cannot be guaranteed.
This site is not an investment advisor, hence it does
not endorse or recommend any securities or other investments.
Any recommendation contained in this report may not
be suitable for all investors and it is not to be deemed
an offer or solicitation on our part with respect to
the purchase or sale of any securities. All trademarks,
service marks and trade names appearing in this report
are the property of their respective owners, and are
likewise used for identification purposes only.
This report is a service available
only to active Paid Premium Members.
You may opt-out of receiving report notifications
at any time. Questions or comments may be submitted
by writing to Premium Membership Services 665 S.E. 10 Street, Suite 201 Deerfield Beach, FL 33441-5634 or by calling 1-800-965-8307
or 954-785-1121.
|
|
|