You are not logged in.
This means you
CAN ONLY VIEW reports that were published prior to Monday, April 14, 2025.
You
MUST UPGRADE YOUR MEMBERSHIP if you want to see any current reports.
AFTER MARKET UPDATE - WEDNESDAY, MAY 7TH, 2014
Previous After Market Report Next After Market Report >>>
|
|
|
|
DOW |
+117.52 |
16,518.54 |
+0.72% |
|
Volume |
749,141,980 |
+9% |
|
Volume |
2,296,496,310 |
+35% |
|
NASDAQ |
-13.09 |
4,067.67 |
-0.32% |
|
Advancers |
1,991 |
63% |
|
Advancers |
1,178 |
42% |
|
S&P 500 |
+10.49 |
1,878.21 |
+0.56% |
|
Decliners |
1,076 |
34% |
|
Decliners |
1,527 |
55% |
|
Russell 2000 |
+0.54 |
1,108.55 |
+0.05% |
|
52 Wk Highs |
135 |
|
|
52 Wk Highs |
34 |
|
|
S&P 600 |
+2.66 |
642.91 |
+0.42% |
|
52 Wk Lows |
78 |
|
|
52 Wk Lows |
175 |
|
|
 |
Tech Weakness Dragged Nasdaq Composite Index Lower
Kenneth J. Gruneisen - Passed the CAN SLIM® Master's Exam
Stocks were mostly higher on Wednesday's session. The Dow rose 118 points to 16,518. The S&P 500 was up 10 points to 1,878. The NASDAQ retreated 13 points to 4,067. The volume was reported higher than the prior session totals on the NYSE and on the Nasdaq exchange. Advancers led decliners by nearly a 2-1 margin on the NYSE, meanwhile on the Nasdaq exchange decliners outnumbered advancers by a 5-4 margin. There were 31 high-ranked companies from the CANSLIM.net Leaders List that made new 52-week highs and appeared on the CANSLIM.net BreakOuts Page, near the total of 32 stocks on the prior session. New 52-week highs outnumbered new 52-week lows on the NYSE while new lows outnumbered new highs on the Nasdaq exchange. There were gains for 5 of the 6 high-ranked companies currently included on the Featured Stocks Page. For the Market (M criteria) to earn the label of returning to a "confirmed uptrend" gains from at least one of the major averages into new high territory would be a welcome reassurance. Then, new buying efforts should be selective and only focused in stocks meeting all key criteria of the fact-based investment system. Keep in mind that any sustained and meaningful market advance requires leadership - a healthy crop of stocks hitting new 52-week highs.
The major averages finished mixed following comments from Fed Chairwoman Janet Yellen. In her testimony before the Joint Economic Committee, Yellen said the central bank is likely to continue its stimulus efforts to spur growth. Attention was also on Ukraine as Russian President Vladimir Putin indicated a willingness to discuss the resolving the conflict. Today’s economic reports showed nonfarm productivity declined -1.7% in the first quarter while consumer credit increased $17.5 billion in March.
Tech weighed on the market as internet stocks fell for a second consecutive day. Yahoo! (YHOO -6.63%) and Twitter (TWTR -3.7%) both faced presure while shares of AOL (AOL -20.62%) tumbled after posting quarterly results below consensus projections. Telecom and utilities were the best performing sectors as Verizon (VZ +1.33%) and First Energy (FE +3.80%) rose. Among earnings releases, Electronic Arts (EA +21.03%) was a notable gainer following its better-than-expected quarterly results. Whole Foods (WFM -18.81%) after reducing its full-year forecast.
Treasuries were mostly higher while the benchmark 10-year notes were unchanged to yield 2.59%.
The CANSLIM.net Featured Stocks Page shows the most action-worthy candidates and their latest notes and a Headline Link directs members to the latest detailed analysis with data-packed graphs annotated by a Certified expert along with links to additional resources. The Premium Member Homepage includes "dynamic archives" to all prior pay reports published. Watch for an announcement via email concerning the next WEBCAST.
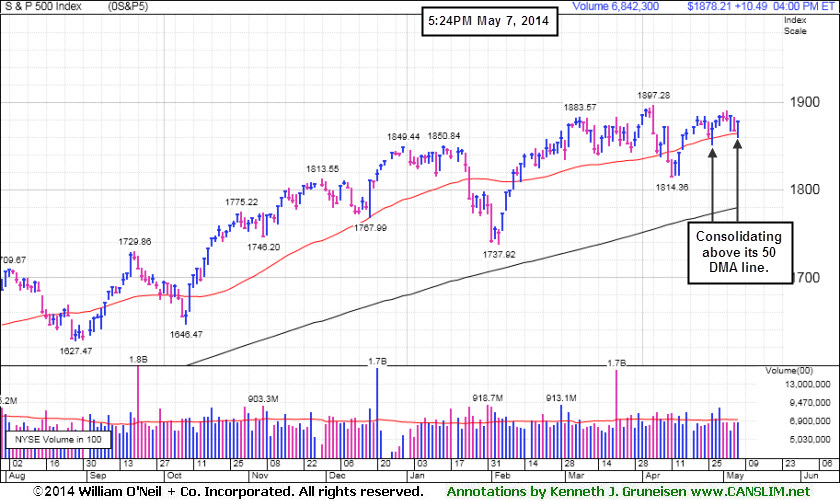
PICTURED: The benchmark S&P 500 Index is consolidating above its 50-day moving average (DMA) line. It finished -0.67% off its best ever close (1,890.90 on 4/02/14).
|
 Kenneth J. Gruneisen started out as a licensed stockbroker in August 1987, a couple of months prior to the historic stock market crash that took the Dow Jones Industrial Average down -22.6% in a single day. He has published daily fact-based fundamental and technical analysis on high-ranked stocks online for two decades. Through FACTBASEDINVESTING.COM, Kenneth provides educational articles, news, market commentary, and other information regarding proven investment systems that work in good times and bad.
Comments contained in the body of this report are technical opinions only and are not necessarily those of Gruneisen Growth Corp. The material herein has been obtained from sources believed to be reliable and accurate, however, its accuracy and completeness cannot be guaranteed. Our firm, employees, and customers may effect transactions, including transactions contrary to any recommendation herein, or have positions in the securities mentioned herein or options with respect thereto. Any recommendation contained in this report may not be suitable for all investors and it is not to be deemed an offer or solicitation on our part with respect to the purchase or sale of any securities. |
|
 |
Financial and Energy-Linked Groups Rose
Kenneth J. Gruneisen - Passed the CAN SLIM® Master's Exam
Financial stocks were a positive influence on the major averages on Wednesday as the Broker/Dealer Index ($XBD +0.95%) and the Bank Index ($BKX +1.21%) posted gains. The Retail Index ($RLX -0.69%) was a negative influence with its modest loss. The Biotechnology Index ($BTK -1.00%) led the tech sector lower while the Networking Index ($NWX -0.10%) and the Semiconductor Index ($SOX +0.09%) finished flat. Energy-related shares had a positive bias as the Integrated Oil Index ($XOI +0.48%) and the Oil Services Index ($OSX +0.75%) posted modest gains. Meanwhile, the Gold & Silver Index ($XAU -2.15%) was a standout decliner.
Charts courtesy www.stockcharts.com
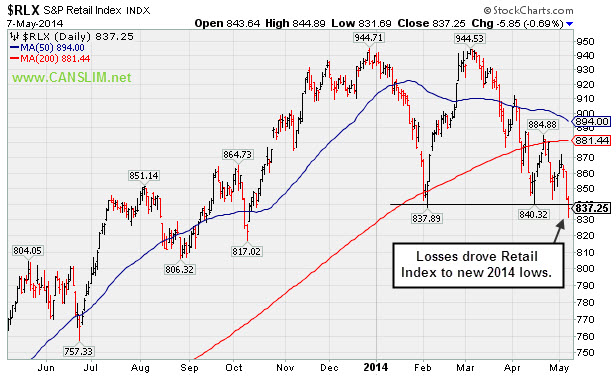
PICTURED: The Retail Index's ($RLX -0.69%) latest losses have it hitting new 2014 lows. The weakness is a cause for concern because it suggests that consumers may not be doing as much spending as previously expected.
| Oil Services |
$OSX |
296.37 |
+2.21 |
+0.75% |
+5.46% |
| Integrated Oil |
$XOI |
1,634.48 |
+7.88 |
+0.48% |
+8.74% |
| Semiconductor |
$SOX |
573.99 |
+0.51 |
+0.09% |
+7.28% |
| Networking |
$NWX |
322.79 |
-0.33 |
-0.10% |
-0.35% |
| Broker/Dealer |
$XBD |
153.50 |
+1.45 |
+0.95% |
-4.40% |
| Retail |
$RLX |
837.25 |
-5.85 |
-0.69% |
-10.91% |
| Gold & Silver |
$XAU |
90.03 |
-1.98 |
-2.15% |
+6.99% |
| Bank |
$BKX |
67.94 |
+0.81 |
+1.21% |
-1.91% |
| Biotech |
$BTK |
2,498.11 |
-25.30 |
-1.00% |
+7.20% |
|
|
|
 |
Stalled After Hitting a New 52-Week High
Kenneth J. Gruneisen - Passed the CAN SLIM® Master's Exam
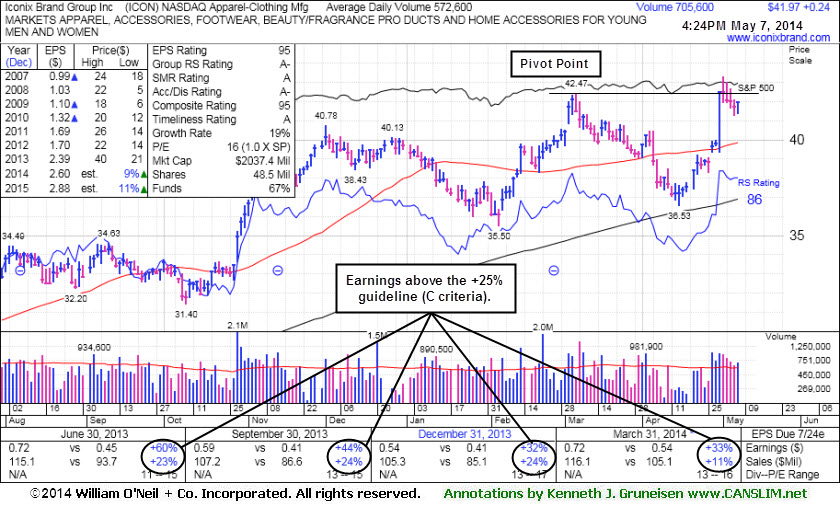
Iconix Brand Group Inc (ICON +$0.24 or +0.58% to $41.97) held its ground today after ending slightly lower for 4 consecutive sessions. No resistance remains due to overhead supply and it remains perched near a new pivot point, however, it stalled near its 52-week high following a considerable 4/30/14 volume-driven gain and finish near that threshold. Confirming gains above the pivot point with at least +40% above average volume could trigger a new (or add-on) technical buy signal.
Keep in mind that 3 out of 4 stocks tend to move in the same direction of the major averages (M criteria) and confirming gains from the major averages are still needed as reassurance the broader market is strong. Members are also reminded that disciplined investors always limit losses by selling any stock that falls more than -7% from their purchase price.
Fundamentals remain strong for the high-ranked Apparel - Clothing Manufacturing firm. ICON reported earnings +33% on +11% sales revenues for the quarter ended March 31, 2014 versus the year ago period marking its 5th consecutive quarterly earnings increase above the +25% guideline (C criteria). Its annual earnings (A criteria) history has been steady. It has earned a 95 Earnings Per Share Rating (EPS) which suggests that its recent earnings growth history has been stellar. Its Relative Strength rating is 86, above the 80+ minimum rank for buy candidates under the fact-based system.
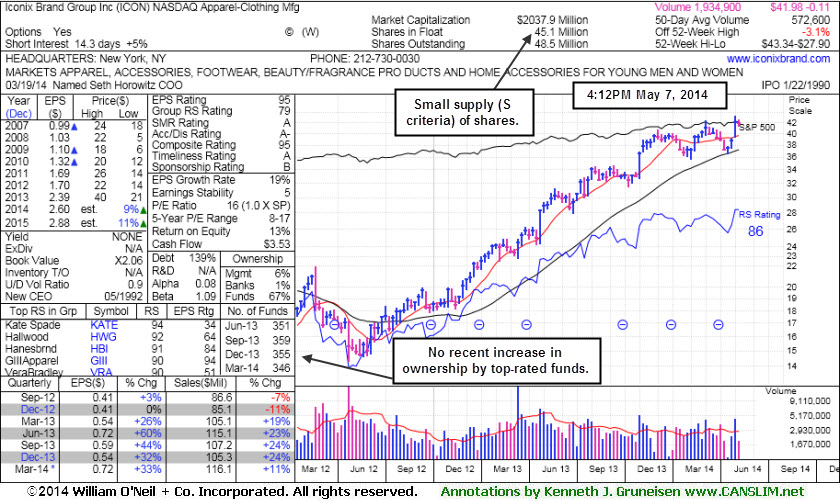
The number of top-rated funds owning its shares fell from 359 in Sep '13 to 346 in Mar '14, not a reassuring sign concerning the I criteria. The stock has shown resilience and strength since last shown in this FSU section on 4/24/14 with annotated graphs under the headline, "Rebound Above 50-Day Average Needed to Improve Outlook".
|
|
|
Color Codes Explained :
Y - Better candidates highlighted by our
staff of experts.
G - Previously featured
in past reports as yellow but may no longer be buyable under the
guidelines.
***Last / Change / Volume data in this table is the closing quote data***
Symbol/Exchange
Company Name
Industry Group |
PRICE |
CHANGE
(%Change) |
Day High |
Volume
(% DAV)
(% 50 day avg vol) |
52 Wk Hi
% From Hi |
Featured
Date |
Price
Featured |
Pivot Featured |
|
Max Buy |
EQM
-
NYSE
E Q T Midstream Partners
ENERGY - Oil and Gas Pipelines
|
$75.89
|
+0.64
0.85% |
$76.25
|
260,741
118.52% of 50 DAV
50 DAV is 220,000
|
$78.67
-3.53%
|
12/12/2013
|
$53.17
|
PP = $56.51
|
|
MB = $59.34
|
Most Recent Note - 5/6/2014 6:21:27 PM
G - Still hovering near its all-time high. Completed a new Public Offering of 10.75 Million common units on 5/01/14. Fundamental concerns remain. Its 50 DMA line ($70.27) defines near-term support where a violation may trigger a technical sell signal.
>>> FEATURED STOCK ARTICLE : Stength Contiunues; Earnings Below +25% Minimum Guideline for a 2nd Quarter - 4/28/2014
View all notes |
Set NEW NOTE alert |
CANSLIM.net Company Profile |
SEC
News |
Chart |
Request a new note
C
A N
S L
I M


|
GNRC
-
NYSE
Generac Hldgs Inc
Electrical-Power/Equipmt
|
$53.53
|
+0.83
1.57% |
$53.87
|
1,269,304
194.29% of 50 DAV
50 DAV is 653,300
|
$62.50
-14.35%
|
2/14/2014
|
$56.50
|
PP = $57.39
|
|
MB = $60.26
|
Most Recent Note - 5/5/2014 9:31:24 PM
G - Reported earnings -40% on -14% sales for the Mar '14 quarter raising fundamental concerns, and it violated support at its 50 DMA line on 5/01/14 with a volume-driven loss triggering technical sell signals. See the latest FSU analysis for more details and a new annotated daily graph.
>>> FEATURED STOCK ARTICLE : Fundamental and Technical Deterioration Raised Concerns - 5/5/2014
View all notes |
Set NEW NOTE alert |
CANSLIM.net Company Profile |
SEC
News |
Chart |
Request a new note
C
A N
S L
I M
|
ICON
-
NASDAQ
Iconix Brand Group Inc
CONSUMER NON-DURABLES - Textile - Apparel Footwear
|
$41.97
|
+0.24
0.58% |
$42.03
|
707,203
123.64% of 50 DAV
50 DAV is 572,000
|
$43.34
-3.16%
|
4/30/2014
|
$42.50
|
PP = $42.57
|
|
MB = $44.70
|
 Most Recent Note - 5/7/2014 5:44:42 PM
Y - Halted its slide today after 4 consecutive small losses. Confirming gains with above average volume could trigger a new (or add-on) technical buy signal. See the latest FSU analysis for more details and new annotated graphs.
>>> FEATURED STOCK ARTICLE : Stalled After Hitting a New 52-Week High - 5/7/2014
View all notes |
Set NEW NOTE alert |
CANSLIM.net Company Profile |
SEC
News |
Chart |
Request a new note
C
A N
S L
I M
|
PSIX
-
NASDAQ
Power Solutions Intl Inc
Machinery-Gen Industrial
|
$81.43
|
-5.03
-5.82% |
$88.96
|
74,049
97.43% of 50 DAV
50 DAV is 76,000
|
$88.20
-7.68%
|
5/6/2014
|
$86.46
|
PP = $87.50
|
|
MB = $91.88
|
Most Recent Note - 5/7/2014 3:55:31 PM
Y - Touched another new 52-week high today but reversed into the red for a big loss but with light volume. Color code was changed to yellow with new pivot point cited based upon its 3/11/14 high plus 10 cents. Gains above the pivot point backed by at least +40% above average volume may trigger a new (or add-on) technical buy signal. No resistance remains due to overhead supply. The 50 DMA line defines near-term support to watch. See the latest FSU analysis for more details and annotated graphs.
>>> FEATURED STOCK ARTICLE : Hitting New 52-Week High and New Pivot Point Cited - 5/6/2014
View all notes |
Set NEW NOTE alert |
CANSLIM.net Company Profile |
SEC
News |
Chart |
Request a new note
C
A N
S L
I M
|
TRN
-
NYSE
Trinity Industries Inc
TRANSPORTATION - Railroads
|
$78.16
|
+0.49
0.63% |
$78.37
|
1,594,131
126.62% of 50 DAV
50 DAV is 1,259,000
|
$78.91
-0.95%
|
4/30/2014
|
$75.57
|
PP = $76.05
|
|
MB = $79.85
|
Most Recent Note - 5/6/2014 6:25:19 PM
Y - Hit another new 52-week high with today's gain above its pivot point backed by +86% above average volume while approaching its "max buy" level. Prior highs in the $75-76 area define near-term support to watch on pullbacks.
>>> FEATURED STOCK ARTICLE : Finished Near Session Lows After Encountering Distributional Pressure - 4/30/2014
View all notes |
Set NEW NOTE alert |
CANSLIM.net Company Profile |
SEC
News |
Chart |
Request a new note
C
A N
S L
I M
|
Symbol/Exchange
Company Name
Industry Group |
PRICE |
CHANGE
(%Change) |
Day High |
Volume
(% DAV)
(% 50 day avg vol) |
52 Wk Hi
% From Hi |
Featured
Date |
Price
Featured |
Pivot Featured |
|
Max Buy |
WLK
-
NYSE
Westlake Chemical Corp
CHEMICALS - Specialty Chemicals
|
$77.01
|
+0.28
0.36% |
$77.64
|
930,044
135.57% of 50 DAV
50 DAV is 686,000
|
$77.51
-0.65%
|
4/29/2014
|
$72.79
|
PP = $69.31
|
|
MB = $72.78
|
Most Recent Note - 5/6/2014 6:27:59 PM
G - Hit yet another new 52-week high while rallying further above its "max buy" level with today's considerable gain adding to its recent spurt of volume-driven gains. Prior highs in the $69 area define near-term support to watch. Reported +28% earnings on +19% sales for the Mar '14 quarter.
>>> FEATURED STOCK ARTICLE : Technical Breakout From Double Bottom Base Pattern - 4/29/2014
View all notes |
Set NEW NOTE alert |
CANSLIM.net Company Profile |
SEC
News |
Chart |
Request a new note
C
A N
S L
I M
|
|
|
|
THESE ARE NOT BUY RECOMMENDATIONS!
Comments contained in the body of this report are technical
opinions only. The material herein has been obtained
from sources believed to be reliable and accurate, however,
its accuracy and completeness cannot be guaranteed.
This site is not an investment advisor, hence it does
not endorse or recommend any securities or other investments.
Any recommendation contained in this report may not
be suitable for all investors and it is not to be deemed
an offer or solicitation on our part with respect to
the purchase or sale of any securities. All trademarks,
service marks and trade names appearing in this report
are the property of their respective owners, and are
likewise used for identification purposes only.
This report is a service available
only to active Paid Premium Members.
You may opt-out of receiving report notifications
at any time. Questions or comments may be submitted
by writing to Premium Membership Services 665 S.E. 10 Street, Suite 201 Deerfield Beach, FL 33441-5634 or by calling 1-800-965-8307
or 954-785-1121.
|
|
|

