You are not logged in.
This means you
CAN ONLY VIEW reports that were published prior to Monday, April 14, 2025.
You
MUST UPGRADE YOUR MEMBERSHIP if you want to see any current reports.
AFTER MARKET UPDATE - THURSDAY, MAY 6TH, 2010
Previous After Market Report Next After Market Report >>>
|
|
|
|
DOW |
-347.80 |
10,520.32 |
-3.20% |
|
Volume |
2,579,947,430 |
+71% |
|
Volume |
4,382,247,640 |
+52% |
|
NASDAQ |
-82.65 |
2,319.64 |
-3.44% |
|
Advancers |
168 |
5% |
|
Advancers |
349 |
12% |
|
S&P 500 |
-37.75 |
1,128.15 |
-3.24% |
|
Decliners |
3,024 |
94% |
|
Decliners |
2,449 |
86% |
|
Russell 2000 |
-26.35 |
672.23 |
-3.77% |
|
52 Wk Highs |
52 |
|
|
52 Wk Highs |
60 |
|
|
S&P 600 |
-12.35 |
360.95 |
-3.31% |
|
52 Wk Lows |
218 |
|
|
52 Wk Lows |
190 |
|
|
 |
Major Averages Suffer Very Damaging Losses
Adam Sarhan, Contributing Writer,
The major averages tanked for the third consecutive day as the euro slid to a fresh 14-month low and gold topped $1,200 per ounce. The major averages plunged below important moving averages as concern spread that other European countries might follow in Greece's ominous footsteps. Volume totals were reported substantially higher on both the NYSE and on the Nasdaq exchange compared to Wednesday's totals, indicating massive distributional selling from large institutional investors. At their intra-day lows all the major averages traded below their respective 200-day moving average (DMA) lines. Decliners reportedly trumped advancers by an 18-to-1 ratio (if the data is reliable) on the NYSE, and decliners led advancers by a 7-to-1 ratio on the Nasdaq exchange. New 52-week lows outnumbered new 52-week highs on the NYSE and on the Nasdaq exchange, the first time in many months that new lows have trumped new highs on both exchanges. There were only 6 high-ranked companies from the CANSLIM.net Leaders List that made a new 52-week high and appeared on the CANSLIM.net BreakOuts Page, the same number that appeared on the prior session. Waning leadership has been evidenced by the recent lack of stocks making new highs as the rally came under pressure.
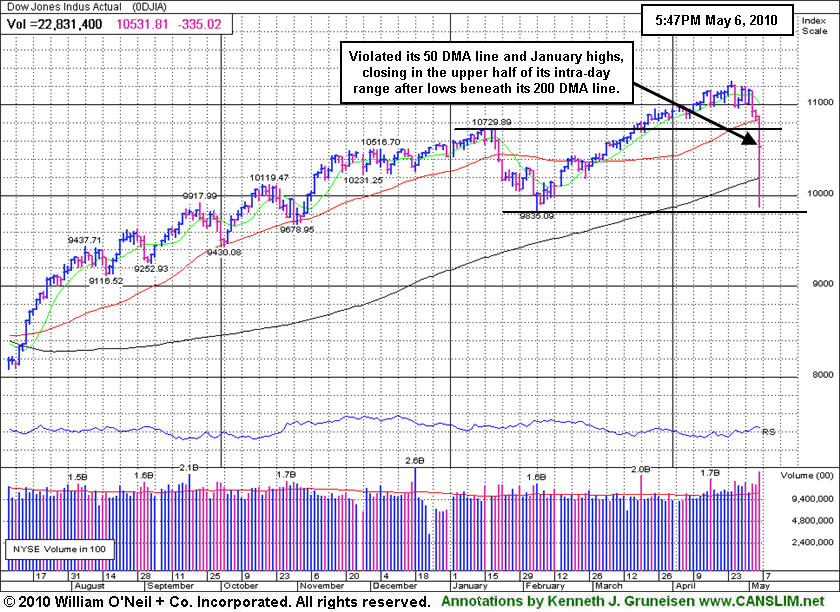
The European Central Bank (ECB) held interest rates steady at a record low of 1% on Thursday as the Greek parliament approved austerity measures demanded by the EU and IMF. This sparked massive riots in downtown Athens and sent stock markets plunging across the globe. Around 2:30PM EST, the bears showed up and pounded the stock market. The Dow Jones Industrial Average plunged nearly 1,000 points before buyers showed up and sent the Dow back up to finish down -347 points on the day. Shortly after the decline, news broke that the move occurred because of a massive trading error at a major firm. This was the Dow's largest single day point decline in history which reiterates the importance of raising capital when the market (M criteria) enters a correction. Even after the rebound from the intra-day lows, the Dow plunged on heavy volume as fear spread that the EU may collapse if other European countries fall behind on their debt payments.
A slew of commodities also got smacked as the dollar soared. Crude oil tanked to a fresh nine-week low in New York as investors reduced risk. Oil has lost nearly -10% this week as investors fear that the ongoing EU woes will adversely affect economic demand. However, gold soared as investors flocked to the perceived safety of the yellow metal while fear was abounding.
Taking the appropriate action on a case-by-case basis with your stocks prompts investors to raise cash when any holdings start getting into the trouble zone. A reminder was added to many Featured Stocks' notes this week -Broader market action (M criteria) is normally expected to impact 3 out of 4 stocks, and widespread losses are adding to concerns about the current rally's tenacity. Trade accordingly.
PICTURED:The Dow Jones Industrial Average violated its 50-day moving average (DMA) line and January highs today, closing in the upper half of its intra-day range after lows beneath its 200 DMA line.
|
|
|
 |
Defensive Positioning Helps Safe Haven Areas
Kenneth J. Gruneisen - Passed the CAN SLIM® Master's Exam
The Bank Index ($BKX -4.53%) and Broker/Dealer Index ($XBD -3.67%) were a negative influence among a long list of decliners on Thursday. The Retail Index ($RLX -3.55%) and the tech sector suffered large losses as the Networking Index ($NWX -4.74%), Biotechnology Index ($BTK -3.77%), Semiconductor Index ($SOX -3.29%), and Internet Index ($IIX -2.91%) ended unanimously lower. The energy group was weak as the Oil Services Index ($OSX -3.88%) and Integrated Oil Index ($XOI -3.33%) plunged. Defensive areas fared better as the Healthcare Index ($HMO -1.21%) held its ground better than most groups.
Charts courtesy www.stockcharts.com
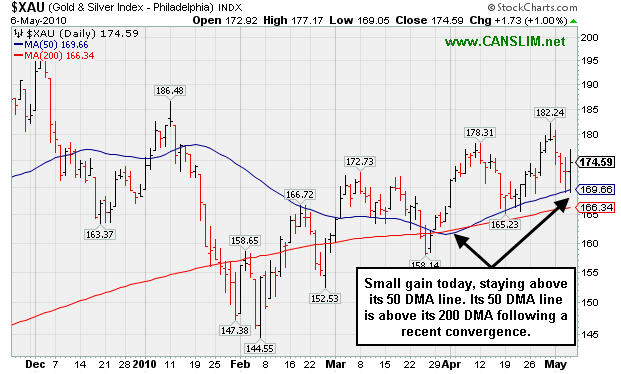
PICTURED: The Gold & Silver Index ($XAU +1.00%) posted a small gain today, bucking a widely negative market and staying above its 50-day moving average (DMA) line. Its 50 DMA line has managed to stay above its 200 DMA following a recent convergence.
| Oil Services |
$OSX |
194.84 |
-7.86 |
-3.88% |
-0.04% |
| Healthcare |
$HMO |
1,461.61 |
-17.94 |
-1.21% |
-0.77% |
| Integrated Oil |
$XOI |
1,018.03 |
-35.06 |
-3.33% |
-4.70% |
| Semiconductor |
$SOX |
352.54 |
-12.00 |
-3.29% |
-2.05% |
| Networking |
$NWX |
249.00 |
-12.38 |
-4.74% |
+7.76% |
| Internet |
$IIX |
240.18 |
-7.20 |
-2.91% |
+2.70% |
| Broker/Dealer |
$XBD |
113.08 |
-4.30 |
-3.67% |
-1.71% |
| Retail |
$RLX |
451.06 |
-16.58 |
-3.55% |
+9.71% |
| Gold & Silver |
$XAU |
174.59 |
+1.73 |
+1.00% |
+3.77% |
| Bank |
$BKX |
52.50 |
-2.49 |
-4.53% |
+22.92% |
| Biotech |
$BTK |
1,080.34 |
-42.38 |
-3.77% |
+14.67% |
|
|
|
 |
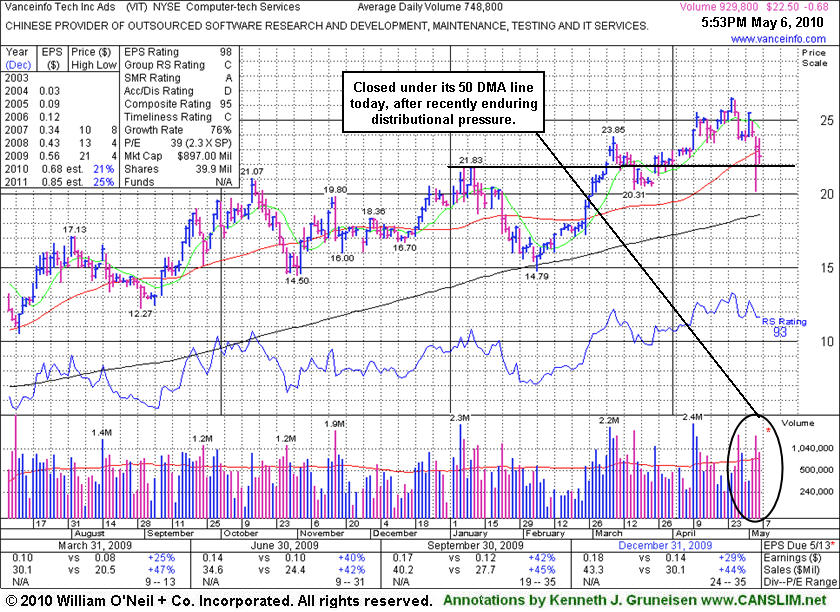
Closed Under 50 Day Average After Recent Bout Of Distribution
Kenneth J. Gruneisen - Passed the CAN SLIM® Master's Exam
Vanceinfo Tech Inc Ads (VIT -$0.69 or -2.98% to $22.49) was down today and closed below its 50-day moving average (DMA) line. Its color code was changed to green based on recent distributional action. It was color coded yellow on 4/09/10 with new pivot point and "max buy" levels noted in the mid-day report (read here). However, deterioration and closes this week below prior high closes has completely negated the latest breakout. Broader market action (M criteria) is normally expected to impact 3 out of 4 stocks, and widespread losses effectively ended the latest rally.
Its small supply of only 11.6 million shares (the S criteria) in the publicly traded float could be a factor leading to greater volatility, especially in the event of mutual funds accumulating or distributing (selling) shares. This heightens the need for caution when buying and the discipline to limit losses, as always, if any stock ever falls more than -7% from your buy price.
 |
|
|
Color Codes Explained :
Y - Better candidates highlighted by our
staff of experts.
G - Previously featured
in past reports as yellow but may no longer be buyable under the
guidelines.
***Last / Change / Volume quote data in this table corresponds with the timestamp on the note***
Symbol/Exchange
Company Name
Industry Group |
Last |
Chg. |
Vol
% DAV |
Date Featured |
Price Featured |
Latest Pivot Point
Featured |
Status |
| Latest Max Buy Price |
BIDU
- NASDAQ
Baidu Inc Ads
INTERNET - Internet Information Providers
|
$668.02
|
-21.51
|
1,725,902
113% DAV
1,522,400
|
1/13/2010
(Date
Featured) |
$431.25
(Price
Featured) |
PP = $426.75 |
G |
| MB = $448.09 |
Most Recent Note - 5/6/2010 4:18:19 PM
G - Loss today amid wider market weakness, closing -7.0% off its all-time high. Its streak of 13 consecutive weekly gains leaves it very extended from a sound base.
>>> The latest Featured Stock Update with an annotated graph appeared on 4/20/2010. click here.
|
|
C
A
S
I |
News |
Chart |
SEC
View all notes Alert
me of new notes
Company
Profile
|
BPI
- NYSE
Bridgepoint Education
DIVERSIFIED SERVICES - Education &; Training Services
|
$23.87
|
-0.79
|
773,411
151% DAV
510,700
|
4/13/2010
(Date
Featured) |
$25.59
(Price
Featured) |
PP = $25.76 |
G |
| MB = $27.05 |
Most Recent Note - 5/6/2010 4:19:51 PM
G - Loss today with above average volume, yet still making a stand near its 50 DMA line despite distributional pressure. The Commercial Services - Schools firm was featured in yellow in the 4/13/10 mid-day report (read here) as rose from a cup-with-high-handle.
>>> The latest Featured Stock Update with an annotated graph appeared on 4/13/2010. click here.
|
|
C
A
S
I |
News |
Chart |
SEC
View all notes Alert
me of new notes
Company
Profile
|
BRLI
- NASDAQ
Bio Reference Labs Inc
HEALTH SERVICES - Medical Laboratories & Researc
|
$22.16
|
-0.84
|
215,302
115% DAV
187,000
|
2/12/2010
(Date
Featured) |
$39.02
(Price
Featured) |
PP = $20.49 |
G |
| MB = $21.51 |
Most Recent Note - 5/6/2010 4:23:46 PM
G - Traded down considerably intra-day, undercutting its 200 DMA line and revisiting its November 2009 lows, yet it rebounded to close near its 50 DMA line and in the upper part of its range. Broader market action (M criteria) is normally expected to impact 3 out of 4 stocks, and widespread losses effectively ended the latest rally.
>>> The latest Featured Stock Update with an annotated graph appeared on 4/16/2010. click here.
|
|
C
A
S
I |
News |
Chart |
SEC
View all notes Alert
me of new notes
Company
Profile
|
CISG
- NASDAQ
Cninsure Inc Ads
INSURANCE - Insurance Brokers
|
$26.73
|
-0.54
|
324,370
124% DAV
262,500
|
3/3/2010
(Date
Featured) |
$24.38
(Price
Featured) |
PP = $23.10 |
Y |
| MB = $24.26 |
Most Recent Note - 5/6/2010 4:39:43 PM
Y - Still consolidating above its 50 DMA line and only -7% off its 52-week high. Its color code was changed to yellow again on 4/29/10, however the prior high is not considered a "pivot point" by definition since it did not form a proper new base.
>>> The latest Featured Stock Update with an annotated graph appeared on 4/19/2010. click here.
|
|
C
A
S
I |
News |
Chart |
SEC
View all notes Alert
me of new notes
Company
Profile
|
CRM
- NYSE
Salesforce.com Inc
INTERNET - Internet Software & Services
|
$80.90
|
-4.32
|
4,066,019
238% DAV
1,706,400
|
3/5/2010
(Date
Featured) |
$72.28
(Price
Featured) |
PP = $75.53 |
G |
| MB = $79.31 |
Most Recent Note - 5/6/2010 4:43:18 PM
G - Considerable loss today on heavy volume, briefly undercutting its 50 DMA line before rebounding to close in the middle of its intra-day range. Broader market action (M criteria) is normally expected to impact 3 out of 4 stocks, and widespread losses effectively ended the latest rally.
>>> The latest Featured Stock Update with an annotated graph appeared on 4/21/2010. click here.
|
|
C
A
S
I |
News |
Chart |
SEC
View all notes Alert
me of new notes
Company
Profile
|
EZPW
- NASDAQ
Ezcorp Inc Cl A
SPECIALTY RETAIL - Specialty Retail, Other
|
$18.97
|
-0.30
|
1,233,254
219% DAV
562,100
|
4/14/2010
(Date
Featured) |
$21.80
(Price
Featured) |
PP = $22.29 |
G |
| MB = $23.40 |
Most Recent Note - 5/6/2010 4:51:20 PM
G - Considerable weakness intra-day led to trading under its 200 DMA line near its $10.00 July 2009 low, yet it rebounded to close with a very small. Broader market action (M criteria) is normally expected to impact 3 out of 4 stocks, and widespread losses effectively ended the latest rally.
>>> The latest Featured Stock Update with an annotated graph appeared on 4/27/2010. click here.
|
|
C
A
S
I |
News |
Chart |
SEC
View all notes Alert
me of new notes
Company
Profile
|
ISRG
- NASDAQ
Intuitive Surgical Inc
HEALTH SERVICES - Medical Appliances & Equipment
|
$337.29
|
-9.65
|
996,452
171% DAV
582,500
|
4/13/2010
(Date
Featured) |
$363.46
(Price
Featured) |
PP = $367.10 |
G |
| MB = $385.46 |
Most Recent Note - 5/6/2010 4:55:00 PM
G - Considerable weakness in the market today was a contributing factor as it undercut its $330 April low, yet it then rebounded to close near the session high. After violating its 50 DMA line on the prior session its color code was changed to green. ISRG was featured again in the 4/13/10 mid-day report (read here) with new pivot point cited based on its 3/03/10 high.
>>> The latest Featured Stock Update with an annotated graph appeared on 5/3/2010. click here.
|
|
C
A
S
I |
News |
Chart |
SEC
View all notes Alert
me of new notes
Company
Profile
|
LL
- NYSE
Lumber Liquidators Hldgs
RETAIL - Home Improvement Stores
|
$28.09
|
-1.59
|
702,554
172% DAV
407,800
|
4/22/2010
(Date
Featured) |
$29.87
(Price
Featured) |
PP = $29.03 |
G |
| MB = $30.48 |
Most Recent Note - 5/6/2010 4:58:13 PM
G - Traded down to its 50 DMA line today then closed in the middle of its intra-day range. It closed the session under its December 2009 highs, negating its latest breakout with a loss on above average volume. First featured in yellow at $29.87 in the 4/22/10 the mid-day report (read here).
>>> The latest Featured Stock Update with an annotated graph appeared on 4/26/2010. click here.
|
|
C
A
S
I |
News |
Chart |
SEC
View all notes Alert
me of new notes
Company
Profile
|
LOPE
- NASDAQ
Grand Canyon Education
DIVERSIFIED SERVICES - Education &; Training Services
|
$24.90
|
-0.50
|
571,806
155% DAV
367,900
|
4/13/2010
(Date
Featured) |
$27.71
(Price
Featured) |
PP = $27.33 |
G |
| MB = $28.70 |
Most Recent Note - 5/6/2010 4:59:28 PM
G - Making a stand today near its 50 DMA line. Many for-profit schools have encountered distributional pressure in the wake of recently proposed regulatory changes.
>>> The latest Featured Stock Update with an annotated graph appeared on 4/14/2010. click here.
|
|
C
A
S
I |
News |
Chart |
SEC
View all notes Alert
me of new notes
Company
Profile
|
PCLN
- NASDAQ
Priceline.com Inc
INTERNET - Internet Software & Services
|
$399.55
|
-4.72
|
584,812
N/A
|
11/1/2002
(Date
Featured) |
$399.55
(Price
Featured) |
PP = $428.20 |
Y |
| MB = $449.61 |
Most Recent Note - 1/2/2011
Y - Returns to Featured Stocks list with its appearance in the January 2011 CANSLIM.net News including detailed analysis and annotated daily and weekly graphs.
>>> The latest Featured Stock Update with an annotated graph appeared on 4/28/2010. click here.
|
|
C
A
S
I |
News |
Chart |
SEC
View all notes Alert
me of new notes
Company
Profile
|
ROVI
- NASDAQ
Rovi Corp
COMPUTER SOFTWARE & SERVICES - Security Software & Services
|
$35.55
|
-1.66
|
1,867,373
149% DAV
1,253,400
|
4/20/2010
(Date
Featured) |
$37.62
(Price
Featured) |
PP = $38.60 |
G |
| MB = $40.53 |
Most Recent Note - 5/6/2010 5:10:00 PM
G - Considerable loss today, violating its 50 DMA line and closing in the middle of its intra-day range after trading briefly below its October 2009 high. Reported earnings after the close.
>>> The latest Featured Stock Update with an annotated graph appeared on 5/5/2010. click here.
|
|
C
A
S
I |
News |
Chart |
SEC
View all notes Alert
me of new notes
Company
Profile
|
SIRO
- NASDAQ
Sirona Dental Systems
HEALTH SERVICES - Medical Instruments & Supplies
|
$38.29
|
+1.21
|
2,218,873
391% DAV
567,100
|
2/16/2010
(Date
Featured) |
$36.43
(Price
Featured) |
PP = $36.15 |
G |
| MB = $37.96 |
Most Recent Note - 5/6/2010 5:13:36 PM
G - Gapped up today and closed near its 50 DMA line, a bullish sign of prompt support from the institutional crowd on a widely negative session. On 5/05/10 it endured heavy distributional pressure after reporting +231% earnings on +15% sales revenues for the quarter ended March 31, 2010 versus the year ago period.
>>> The latest Featured Stock Update with an annotated graph appeared on 4/22/2010. click here.
|
|
C
A
S
I |
News |
Chart |
SEC
View all notes Alert
me of new notes
Company
Profile
|
SUMR
- NASDAQ
Summer Infant Inc
CONSUMER NON-DURABLES - Personal Products
|
$6.52
|
-0.48
|
37,250
80% DAV
46,700
|
5/4/2010
(Date
Featured) |
$6.85
(Price
Featured) |
PP = $7.09 |
Y |
| MB = $7.44 |
Most Recent Note - 5/6/2010 5:16:53 PM
Y - Loss today on light volume, pulling back near its 50 DMA line. It was featured in the 5/04/10 mid-day report (read here) - "Inching into new high ground this week on the right side of a 7-week flat base above its 50 DMA line and well above prior chart highs in the $5 area. Color code is yellow with pivot point noted based upon its 3/15/10 high plus ten cents. Quarterly earnings (C criteria) in the 2 latest quarterly comparisons showed great increases while sales revenues growth accelerated to +27% in the period ended Mach 31, 2010. It has a good annual earnings (A criteria) history, and a small supply (S criteria) of only 11.0 million shares in the public float. Technically, a gain and strong close above its pivot point with heavy volume would trigger a buy signal."
>>> The latest Featured Stock Update with an annotated graph appeared on 5/4/2010. click here.
|
|
C
A
S
I |
News |
Chart |
SEC
View all notes Alert
me of new notes
Company
Profile
|
ULTA
- NASDAQ
Ulta Salon Cosm & Frag
SPECIALTY RETAIL - Specialty Retail, Other
|
$21.99
|
-0.51
|
429,741
101% DAV
426,600
|
3/12/2010
(Date
Featured) |
$22.81
(Price
Featured) |
PP = $21.72 |
G |
| MB = $22.81 |
Most Recent Note - 5/6/2010 5:21:28 PM
G - Weakness today on average volume led to a violation of its 50 DMA line and intra-day trading below its recent chart low $21.66 triggering a technical sell signal. It finished in the upper half of its intra-day range and avoided a close below its January low which would raise greater concerns.
>>> The latest Featured Stock Update with an annotated graph appeared on 4/30/2010. click here.
|
|
C
A
S
I |
News |
Chart |
SEC
View all notes Alert
me of new notes
Company
Profile
|
VIT
-
|
$22.49
|
-0.69
|
939,868
126% DAV
748,800
|
4/9/2010
(Date
Featured) |
$23.79
(Price
Featured) |
PP = $23.95 |
G |
| MB = $25.15 |
Most Recent Note - 5/6/2010 5:23:47 PM
G - Loss today led to a close below its 50 DMA line. Color code was changed to green based on recent distributional action. Broader market action (M criteria) is normally expected to impact 3 out of 4 stocks, and widespread losses effectively ended the latest rally.
>>> The latest Featured Stock Update with an annotated graph appeared on 5/6/2010. click here.
|
|
C
A
S
I |
News |
Chart |
SEC
View all notes Alert
me of new notes
Company
Profile
|
|
|
|
THESE ARE NOT BUY RECOMMENDATIONS!
Comments contained in the body of this report are technical
opinions only. The material herein has been obtained
from sources believed to be reliable and accurate, however,
its accuracy and completeness cannot be guaranteed.
This site is not an investment advisor, hence it does
not endorse or recommend any securities or other investments.
Any recommendation contained in this report may not
be suitable for all investors and it is not to be deemed
an offer or solicitation on our part with respect to
the purchase or sale of any securities. All trademarks,
service marks and trade names appearing in this report
are the property of their respective owners, and are
likewise used for identification purposes only.
This report is a service available
only to active Paid Premium Members.
You may opt-out of receiving report notifications
at any time. Questions or comments may be submitted
by writing to Premium Membership Services 665 S.E. 10 Street, Suite 201 Deerfield Beach, FL 33441-5634 or by calling 1-800-965-8307
or 954-785-1121.
|
|
|


