***Last / Change / Volume data in this table is the closing quote data***
Symbol/Exchange
Company Name
Industry Group |
PRICE |
CHANGE
(%Change) |
Day High |
Volume
(% DAV)
(% 50 day avg vol) |
52 Wk Hi
% From Hi |
Featured
Date |
Price
Featured |
Pivot Featured |
|
Max Buy |
ACN
-
NYSE
Accenture Plc
DIVERSIFIED SERVICES - Business/Management Services
|
$62.61
|
-1.60
-2.49% |
$63.94
|
3,376,293
103.26% of 50 DAV
50 DAV is 3,269,600
|
$65.89
-4.98%
|
3/23/2012
|
$64.13
|
PP = $63.76
|
|
MB = $66.95
|
Most Recent Note - 4/30/2012 5:38:39 PM
Y - Recently consolidating above prior highs in the $62-63 area and its 50 DMA line defining important near-term support. A subsequent violation of its recent low would trigger a worrisome technical sell signal.
>>> The latest Featured Stock Update with an annotated graph appeared on 3/23/2012. Click here.
View all notes |
Alert me of new notes |
CANSLIM.net Company Profile |
SEC |
Zacks Reports |
StockTalk |
News |
Chart |
Request a new note
C
A N
S L
I M


|
ADS
-
NYSE
Alliance Data Sys Corp
COMPUTER SOFTWARE and SERVICES - Information and Delivery Service
|
$126.41
|
-1.89
-1.47% |
$127.97
|
315,398
54.44% of 50 DAV
50 DAV is 579,300
|
$130.66
-3.25%
|
1/17/2012
|
$108.24
|
PP = $107.43
|
|
MB = $112.80
|
Most Recent Note - 5/1/2012 6:31:47 PM
G - Still holding its ground near its all-time high today even after sub par earnings increases raised fundamental concerns. Its 50 DMA line defines important support to watch where any violation would trigger a technical sell signal.
>>> The latest Featured Stock Update with an annotated graph appeared on 4/24/2012. Click here.
View all notes |
Alert me of new notes |
CANSLIM.net Company Profile |
SEC |
Zacks Reports |
StockTalk |
News |
Chart |
Request a new note
C
A N
S L
I M
|
ALLT
-
NASDAQ
Allot Communications Ltd
COMPUTER SOFTWARE andamp; SERVICES - Technical andamp; System Software
|
$25.41
|
-0.97
-3.68% |
$26.15
|
246,126
53.03% of 50 DAV
50 DAV is 464,100
|
$26.97
-5.78%
|
3/13/2012
|
$19.72
|
PP = $18.91
|
|
MB = $19.86
|
 Most Recent Note - 5/4/2012 1:22:40 PM
G - Quietly retreating from this week's new all-time high after getting extended from its prior base. Reported earnings +88% on +41% sales revenues for the quarter ended March 31, 2012 versus the year ago period. Recent lows ($22.46 on 4/23/12) define near-term support above its 50 DMA line.
>>> The latest Featured Stock Update with an annotated graph appeared on 3/19/2012. Click here.
View all notes |
Alert me of new notes |
CANSLIM.net Company Profile |
SEC |
Zacks Reports |
StockTalk |
News |
Chart |
Request a new note
C
A N
S L
I M
|
ALXN
-
NASDAQ
Alexion Pharmaceuticals
DRUGS - Drug Manufacturers - Other
|
$87.28
|
-3.71
-4.08% |
$90.44
|
1,616,501
133.39% of 50 DAV
50 DAV is 1,211,900
|
$95.01
-8.14%
|
5/1/2012
|
$91.73
|
PP = $95.11
|
|
MB = $99.87
|
Most Recent Note - 5/4/2012 1:24:55 PM
G - Color code is changed to green after slumping below its 50 DMA line. Only a prompt rebound above the 50 DMA line would help its outlook. It did not trade above the new pivot point cited based on its 3/26/12 high plus 10 cents after building an orderly flat base. Previously noted - "The late-stage base may be a riskier set-up, yet volume-driven gains could trigger a new (or add-on) technical buy signal."
>>> The latest Featured Stock Update with an annotated graph appeared on 4/16/2012. Click here.
View all notes |
Alert me of new notes |
CANSLIM.net Company Profile |
SEC |
Zacks Reports |
StockTalk |
News |
Chart |
Request a new note
C
A N
S L
I M
|
ARBA
-
NASDAQ
Ariba Inc
INTERNET - Internet Software and Services
|
$38.74
|
-0.36
-0.92% |
$39.03
|
929,327
94.86% of 50 DAV
50 DAV is 979,700
|
$40.45
-4.23%
|
4/27/2012
|
$38.53
|
PP = $37.24
|
|
MB = $39.10
|
Most Recent Note - 4/30/2012 7:01:48 PM
Y - Pulled back today with above average volume following the prior session's technical breakout on 5 times average volume. Support to watch is at prior highs in the $35-37 area. ARBA was highlighted in yellow in the 4/27/12 mid-day breakouts report (read here) when breaking out above the pivot point cited based on its 7/11/11 high plus 10 cents. See the latest FSU analysis for more details and a new annotated graph.
>>> The latest Featured Stock Update with an annotated graph appeared on 4/30/2012. Click here.
View all notes |
Alert me of new notes |
CANSLIM.net Company Profile |
SEC |
Zacks Reports |
StockTalk |
News |
Chart |
Request a new note
C
A N
S L
I M
|
Symbol/Exchange
Company Name
Industry Group |
PRICE |
CHANGE
(%Change) |
Day High |
Volume
(% DAV)
(% 50 day avg vol) |
52 Wk Hi
% From Hi |
Featured
Date |
Price
Featured |
Pivot Featured |
|
Max Buy |
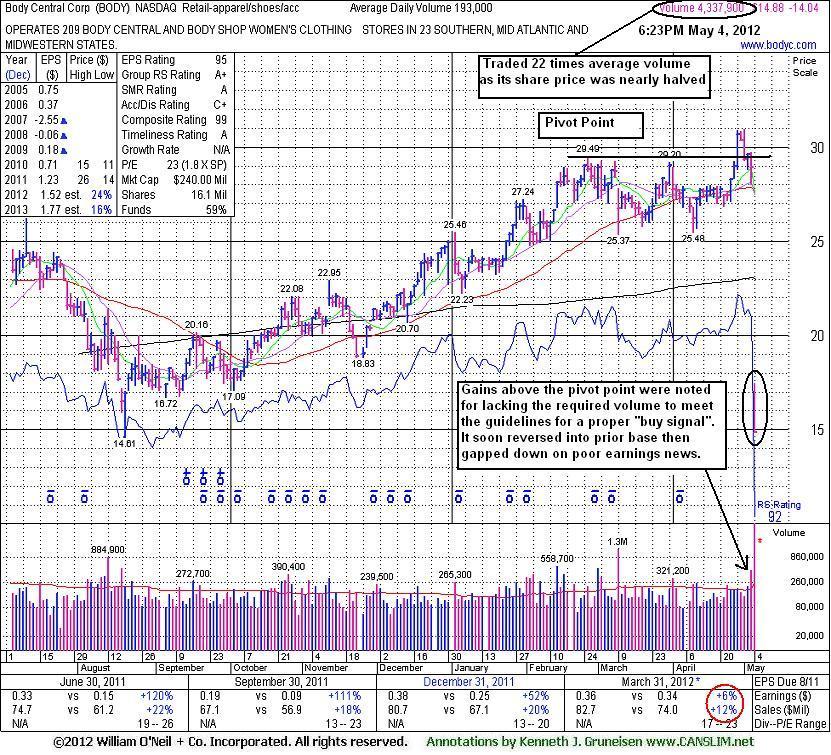
BODY
-
NASDAQ
Body Central Corp
RETAIL - Catalog andamp; Mail Order Houses
|
$14.88
|
-14.04
-48.55% |
$17.48
|
4,349,467
2,253.61% of 50 DAV
50 DAV is 193,000
|
$30.93
-51.90%
|
4/18/2012
|
$27.44
|
PP = $29.59
|
|
MB = $31.07
|
Most Recent Note - 5/4/2012 1:35:23 PM
Based on damaging technical action it will be dropped from the Featured Stocks list tonight. Reported earnings +6% on +22% sales revenues for the quarter ended March 31, 2012 versus the year ago period. Gapped down below its 50 and 200 DMA lines for a huge loss, and its color code was changed to green. In BOLD the Market Commentary has clearly reminded readers - investors should always be disciplined and watch for a proper technical buy signal to be confirmed before taking any action, then steadfastly protect capital by selling whenever any stock falls more than -7% from the purchase price.
>>> The latest Featured Stock Update with an annotated graph appeared on 5/4/2012. Click here.
View all notes |
Alert me of new notes |
CANSLIM.net Company Profile |
SEC |
Zacks Reports |
StockTalk |
News |
Chart |
Request a new note
C
A N
S L
I M
|
CDNS
-
NASDAQ
Cadence Design Systems
COMPUTER SOFTWARE and SERVICES - Technical and System Software
|
$11.20
|
-0.26
-2.27% |
$11.68
|
1,792,421
65.87% of 50 DAV
50 DAV is 2,721,100
|
$12.60
-11.11%
|
2/3/2012
|
$11.66
|
PP = $11.15
|
|
MB = $11.71
|
Most Recent Note - 5/2/2012 4:04:14 PM
G - Its 50 DMA line has been acting as resistance and a rebound above that important short-term average is needed for its technical stance and outlook to improve.
>>> The latest Featured Stock Update with an annotated graph appeared on 3/28/2012. Click here.
View all notes |
Alert me of new notes |
CANSLIM.net Company Profile |
SEC |
Zacks Reports |
StockTalk |
News |
Chart |
Request a new note
C
A N
S L
I M
|
CELG
-
NASDAQ
Celgene Corp
DRUGS - Drug Manufacturers - Major
|
$69.81
|
-1.59
-2.23% |
$71.21
|
3,779,135
127.45% of 50 DAV
50 DAV is 2,965,200
|
$80.42
-13.19%
|
2/2/2012
|
$74.16
|
PP = $75.21
|
|
MB = $78.97
|
Most Recent Note - 5/4/2012 1:33:11 PM
Suffering a 5th consecutive loss today, slumping badly since violating its 50 DMA line and triggering a technical sell signal. Based on weak action it will be dropped from the Featured Stocks list tonight.
>>> The latest Featured Stock Update with an annotated graph appeared on 3/26/2012. Click here.
View all notes |
Alert me of new notes |
CANSLIM.net Company Profile |
SEC |
Zacks Reports |
StockTalk |
News |
Chart |
Request a new note
C
A N
S L
I M
|
CERN
-
NASDAQ
Cerner Corp
COMPUTER SOFTWARE and SERVICES - Healthcare Information Service
|
$80.48
|
-1.59
-1.94% |
$81.28
|
1,393,228
126.02% of 50 DAV
50 DAV is 1,105,600
|
$84.10
-4.30%
|
4/27/2012
|
$77.23
|
PP = $78.63
|
|
MB = $82.56
|
Most Recent Note - 5/1/2012 6:14:21 PM
G - This Computer Software - Medical firm rallied above its "max buy" level with today's 5th consecutive volume-driven gain and its color code was changed to green. See the latest FSU analysis for more details and a new annotated graph.
>>> The latest Featured Stock Update with an annotated graph appeared on 5/1/2012. Click here.
View all notes |
Alert me of new notes |
CANSLIM.net Company Profile |
SEC |
Zacks Reports |
StockTalk |
News |
Chart |
Request a new note
C
A N
S L
I M
|
CMCSA
-
NASDAQ
Comcast Corp Cl A
MEDIA - CATV Systems
|
$29.45
|
-0.91
-3.00% |
$30.19
|
16,019,734
125.04% of 50 DAV
50 DAV is 12,811,300
|
$30.88
-4.62%
|
5/2/2012
|
$30.04
|
PP = $30.51
|
|
MB = $32.04
|
Most Recent Note - 5/2/2012 12:30:12 PM
Y - Small gap down today tested support at its nearby 50 DMA line. Color code is changed to yellow with pivot point cited based on its 3/27/12 high plus 10 cents after a flat base. Technically, its volume driven-gain on the prior session triggered a technical buy signal capping a streak of 6 consecutive gains with an above average volume gain as it hit a new 52-week high and traded above its 2007 high within close range of its all-time high ($31.92 Dec '99). Reported earnings +25% on +23% sales for the quarter ended March 31, 2012 versus the year ago period. The 3 prior quarterly comparisons (through Dec '11) showed sales revenues increases above the year ago periods by +50%, and earnings increases were above the +25% guideline in 3 of the past 4 comparisons.
There are no Featured Stock Updates™ available for this stock at this time. You may request one by clicking the Request a New Note link below
View all notes |
Alert me of new notes |
CANSLIM.net Company Profile |
SEC |
Zacks Reports |
StockTalk |
News |
Chart |
Request a new note
C
A N
S L
I M
|
Symbol/Exchange
Company Name
Industry Group |
PRICE |
CHANGE
(%Change) |
Day High |
Volume
(% DAV)
(% 50 day avg vol) |
52 Wk Hi
% From Hi |
Featured
Date |
Price
Featured |
Pivot Featured |
|
Max Buy |
COO
-
NYSE
Cooper Companies Inc
HEALTH SERVICES - Medical Instruments and Supplies
|
$87.00
|
-1.41
-1.59% |
$88.15
|
267,508
58.54% of 50 DAV
50 DAV is 457,000
|
$89.31
-2.59%
|
3/9/2012
|
$83.05
|
PP = $81.02
|
|
MB = $85.07
|
Most Recent Note - 5/3/2012 11:58:43 AM
G - Small gain today with above average volume conviction while trading at its 52-week and all-time highs above its "max buy" level. It is extended from its prior base. Prior highs in the $83-84 area define near-term support above its 50 DMA line.
>>> The latest Featured Stock Update with an annotated graph appeared on 3/9/2012. Click here.
View all notes |
Alert me of new notes |
CANSLIM.net Company Profile |
SEC |
Zacks Reports |
StockTalk |
News |
Chart |
Request a new note
C
A N
S L
I M
|
DISH
-
NASDAQ
Dish Network Corp Cl A
CONSUMER DURABLES - Electronic Equipment
|
$31.31
|
-1.30
-3.99% |
$32.58
|
2,585,451
103.98% of 50 DAV
50 DAV is 2,486,500
|
$35.64
-12.15%
|
3/7/2012
|
$30.83
|
PP = $30.10
|
|
MB = $31.61
|
Most Recent Note - 5/4/2012 5:57:48 PM
G - Finished near the session low with a loss today on average volume, closing just under its 50 DMA line. Further deterioration below the 50 DMA or below recent lows ($29.93 on 4/18/12) would raise more serious concerns. Due to report its latest earnings on Monday, May 7, 2012.
>>> The latest Featured Stock Update with an annotated graph appeared on 3/14/2012. Click here.
View all notes |
Alert me of new notes |
CANSLIM.net Company Profile |
SEC |
Zacks Reports |
StockTalk |
News |
Chart |
Request a new note
C
A N
S L
I M
|
EXPE
-
NASDAQ
Expedia Inc
INTERNET - Internet Information Providers
|
$40.98
|
-0.45
-1.09% |
$41.52
|
3,603,876
84.37% of 50 DAV
50 DAV is 4,271,300
|
$43.92
-6.69%
|
4/27/2012
|
$41.80
|
PP = $35.57
|
|
MB = $37.35
|
Most Recent Note - 5/3/2012 6:16:41 PM
G - Consolidating after quickly getting extended from its prior base following its appearance highlighted in yellow in the 4/27/12 mid-day breakouts report (read here) after a considerable "breakaway gap" up. See the latest FSU analysis for more details and a new annotated graph.
>>> The latest Featured Stock Update with an annotated graph appeared on 5/3/2012. Click here.
View all notes |
Alert me of new notes |
CANSLIM.net Company Profile |
SEC |
Zacks Reports |
StockTalk |
News |
Chart |
Request a new note
C
A N
S L
I M
|
FEIC
-
NASDAQ
F E I Co
ELECTRONICS - Diversified Electronics
|
$48.87
|
-1.44
-2.86% |
$50.00
|
328,690
101.95% of 50 DAV
50 DAV is 322,400
|
$52.01
-6.04%
|
12/7/2011
|
$41.41
|
PP = $42.35
|
|
MB = $44.47
|
Most Recent Note - 5/3/2012 6:19:08 PM
G - Down today with above average volume after an impressive rebound and "positive reversal" on the prior session after being down considerably. Reported earnings +17% on +10% sales revenues for the quarter ended March 31, 2012 versus the year ago period, marking a second consecutive quarter below the +25% minimum guideline for earnings growth. Disciplined investors make sell decisions based upon technical action alone, whereas buy decisions are to be made only when both fundamental and technical criteria met.
>>> The latest Featured Stock Update with an annotated graph appeared on 3/12/2012. Click here.
View all notes |
Alert me of new notes |
CANSLIM.net Company Profile |
SEC |
Zacks Reports |
StockTalk |
News |
Chart |
Request a new note
C
A N
S L
I M
|
GNC
-
NYSE
G N C Holdings Inc
RETAIL - Drug Stores
|
$37.61
|
-0.86
-2.24% |
$39.40
|
2,429,347
127.58% of 50 DAV
50 DAV is 1,904,200
|
$41.95
-10.35%
|
1/19/2012
|
$28.99
|
PP = $29.60
|
|
MB = $31.08
|
Most Recent Note - 5/3/2012 3:12:34 PM
G - Consolidating -8.9% off its all-time high with light volume behind its loss today. Support to watch is at prior highs near $36 above its 50 DMA line. Reported earnings +82% on +23% sales revenues for the quarter ended March 31, 2012 versus the year ago period.
>>> The latest Featured Stock Update with an annotated graph appeared on 4/26/2012. Click here.
View all notes |
Alert me of new notes |
CANSLIM.net Company Profile |
SEC |
Zacks Reports |
StockTalk |
News |
Chart |
Request a new note
C
A N
S L
I M
|
Symbol/Exchange
Company Name
Industry Group |
PRICE |
CHANGE
(%Change) |
Day High |
Volume
(% DAV)
(% 50 day avg vol) |
52 Wk Hi
% From Hi |
Featured
Date |
Price
Featured |
Pivot Featured |
|
Max Buy |
ISRG
-
NASDAQ
Intuitive Surgical Inc
HEALTH SERVICES - Medical Appliances and Equipment
|
$565.16
|
-13.21
-2.28% |
$577.79
|
313,154
112.16% of 50 DAV
50 DAV is 279,200
|
$594.89
-5.00%
|
12/20/2011
|
$442.43
|
PP = $449.16
|
|
MB = $471.62
|
Most Recent Note - 5/3/2012 3:09:55 PM
G - Still stubbornly holding its ground near its all-time high with volume totals cooling since a considerable gap up gain on 4/18/12. It may produce more climactic gains, however it has not spent much time basing since its last "Featured Date" when highlighted in yellow on 12/23/11. It tallied 11 consecutive weekly gains. Disciplined investors always limit losses if any stock falls -7% from their purchase price.
>>> The latest Featured Stock Update with an annotated graph appeared on 3/1/2012. Click here.
View all notes |
Alert me of new notes |
CANSLIM.net Company Profile |
SEC |
Zacks Reports |
StockTalk |
News |
Chart |
Request a new note
C
A N
S L
I M
|
JAZZ
-
NASDAQ
Jazz Pharmaceuticals Plc
DRUGS - Biotechnology
|
$50.79
|
-0.86
-1.67% |
$51.75
|
444,514
43.65% of 50 DAV
50 DAV is 1,018,400
|
$54.50
-6.81%
|
4/27/2012
|
$51.93
|
PP = $51.39
|
|
MB = $53.96
|
Most Recent Note - 4/27/2012 6:07:32 PM
Y - Considerable gap up gain today backed by 4 times average volume, rising from a "double bottom" base and touching a new all-time high. Color code was changed to yellow and pivot point cited is based on its 4/10/12 high in the mid-day report. See the latest FSU analysis for more details and a new annotated graph.
>>> The latest Featured Stock Update with an annotated graph appeared on 4/27/2012. Click here.
View all notes |
Alert me of new notes |
CANSLIM.net Company Profile |
SEC |
Zacks Reports |
StockTalk |
News |
Chart |
Request a new note
C
A N
S L
I M
|
LULU
-
NASDAQ
Lululemon Athletica
MANUFACTURING - Textile Manufacturing
|
$77.70
|
-2.60
-3.24% |
$80.71
|
2,328,951
110.58% of 50 DAV
50 DAV is 2,106,200
|
$81.09
-4.18%
|
5/1/2012
|
$76.05
|
PP = $77.23
|
|
MB = $81.09
|
Most Recent Note - 5/2/2012 1:00:46 PM
Y - Recently found prompt support at its 50 DMA line. Volume is running at an above average pace today as it is hitting a new high. Gains backed by at least +40% above average volume while rising above the new pivot point cited based on its 4/05/12 high plus 10 cents may trigger a proper new (or add-on) technical buy signal.
>>> The latest Featured Stock Update with an annotated graph appeared on 4/12/2012. Click here.
View all notes |
Alert me of new notes |
CANSLIM.net Company Profile |
SEC |
Zacks Reports |
StockTalk |
News |
Chart |
Request a new note
C
A N
S L
I M
|
MA
-
NYSE
Mastercard Inc Cl A
DIVERSIFIED SERVICES - Business/Management Services
|
$439.69
|
-2.74
-0.62% |
$441.91
|
1,471,572
165.03% of 50 DAV
50 DAV is 891,700
|
$466.98
-5.84%
|
3/12/2012
|
$419.86
|
PP = $428.67
|
|
MB = $450.10
|
Most Recent Note - 5/4/2012 12:30:20 PM
G - Color code remains green even though it has retreated below its "max buy" level. Distributional action in recent weeks may be considered a warning sign while it is consolidating just above its 50 DMA line defining important near-term support to watch.
>>> The latest Featured Stock Update with an annotated graph appeared on 4/11/2012. Click here.
View all notes |
Alert me of new notes |
CANSLIM.net Company Profile |
SEC |
Zacks Reports |
StockTalk |
News |
Chart |
Request a new note
C
A N
S L
I M
|
MELI
-
NASDAQ
Mercadolibre Inc
INTERNET - Internet Software and; Services
|
$92.86
|
-1.16
-1.23% |
$93.97
|
679,595
143.16% of 50 DAV
50 DAV is 474,700
|
$104.50
-11.14%
|
5/1/2012
|
$99.34
|
PP = $102.98
|
|
MB = $108.13
|
Most Recent Note - 5/3/2012 3:19:30 PM
Y - Loss today on lighter volume has it slumping back below its 50 DMA line, hurting its technical stance. A new pivot point was cited based on its 3/27/12 high after forming a "double bottom" base. There is limited resistance due to overhead supply up through the $104 level. Due to report earnings on May 8, 2012 after the close.
>>> The latest Featured Stock Update with an annotated graph appeared on 3/29/2012. Click here.
View all notes |
Alert me of new notes |
CANSLIM.net Company Profile |
SEC |
Zacks Reports |
StockTalk |
News |
Chart |
Request a new note
C
A N
S L
I M
|
Symbol/Exchange
Company Name
Industry Group |
PRICE |
CHANGE
(%Change) |
Day High |
Volume
(% DAV)
(% 50 day avg vol) |
52 Wk Hi
% From Hi |
Featured
Date |
Price
Featured |
Pivot Featured |
|
Max Buy |
MG
-
NYSE
Mistras Group Inc
DIVERSIFIED SERVICES - Bulding and Faci;ity Management Services
|
$23.24
|
+0.10
0.43% |
$23.50
|
106,871
113.93% of 50 DAV
50 DAV is 93,800
|
$26.24
-11.43%
|
3/22/2012
|
$24.96
|
PP = $26.34
|
|
MB = $27.66
|
Most Recent Note - 4/30/2012 5:25:10 PM
G - Encountered distributional pressure today after a gap up, negatively reversing and closing near its 50 DMA line. The recent low ($22.60 on 4/19/12) defines the next near-term support above its 200 DMA line. Previously noted - "A volume-driven gain above its recent chart high ($25.49 on 3/21/12) may help trigger a proper technical buy signal after a new base formation, however no new (lower) pivot point is currently being cited, and it may continue encountering stubborn resistance."
>>> The latest Featured Stock Update with an annotated graph appeared on 4/2/2012. Click here.
View all notes |
Alert me of new notes |
CANSLIM.net Company Profile |
SEC |
Zacks Reports |
StockTalk |
News |
Chart |
Request a new note
C
A N
S L
I M
|
MKTX
-
NASDAQ
Marketaxess Holdings Inc
FINANCIAL SERVICES - Investment Brokerage - Nationa
|
$33.12
|
-0.45
-1.34% |
$33.20
|
784,636
238.78% of 50 DAV
50 DAV is 328,600
|
$37.95
-12.73%
|
3/8/2012
|
$35.80
|
PP = $35.52
|
|
MB = $37.30
|
Most Recent Note - 5/4/2012 1:31:23 PM
Gapped down today for another damaging loss on higher volume, slumping further below its 50 DMA line and below its pivot point. Based on weak action it will be dropped from the Featured Stocks list tonight.
>>> The latest Featured Stock Update with an annotated graph appeared on 3/8/2012. Click here.
View all notes |
Alert me of new notes |
CANSLIM.net Company Profile |
SEC |
Zacks Reports |
StockTalk |
News |
Chart |
Request a new note
C
A N
S L
I M
|
NTES
-
NASDAQ
Netease Inc Adr
INTERNET - Internet Information Providers
|
$59.78
|
-0.13
-0.22% |
$60.00
|
991,625
152.35% of 50 DAV
50 DAV is 650,900
|
$61.45
-2.72%
|
3/19/2012
|
$56.18
|
PP = $55.10
|
|
MB = $57.86
|
Most Recent Note - 5/4/2012 12:39:24 PM
G - Holding its ground stubbornly this week in a tight range near its 52-week high. Recent lows and its 50 DMA line define support to watch in the $55 area.
>>> The latest Featured Stock Update with an annotated graph appeared on 3/27/2012. Click here.
View all notes |
Alert me of new notes |
CANSLIM.net Company Profile |
SEC |
Zacks Reports |
StockTalk |
News |
Chart |
Request a new note
C
A N
S L
I M
|
PCLN
-
NASDAQ
Priceline.Com Inc
INTERNET - Internet Software and Services
|
$736.07
|
-13.67
-1.82% |
$747.00
|
1,141,452
94.95% of 50 DAV
50 DAV is 1,202,200
|
$774.96
-5.02%
|
4/27/2012
|
$539.46
|
PP = $774.96
|
|
MB = $813.71
|
Most Recent Note - 4/27/2012 12:53:39 PM
Y - Gapped up today, rallying from support at its 50 DMA line to within close striking distance of its 52-week high. Color code is changed to yellow while rallying from its first test of its 10-week moving average (WMA) since breaking out above resistance in the $554 area in February. In the Certification they teach that after an earlier breakout a secondary buy point exists between the first successful test of the 10 WMA up to +5% above its latest high. The 2-week consolidation is not considered a sound base pattern, yet the pivot point cited is based on that recent high. Prior mid-day reports noted - "Technically, it broke out on 2/13/12 with a volume-driven gain, and now it is getting extended from its prior base. Fundamentals have remained strong since dropped from the Featured Stocks list on 9/29/11. Patient investors may watch for secondary buy points to possibly develop and be noted."
>>> The latest Featured Stock Update with an annotated graph appeared on 9/22/2011. Click here.
View all notes |
Alert me of new notes |
CANSLIM.net Company Profile |
SEC |
Zacks Reports |
StockTalk |
News |
Chart |
Request a new note
C
A N
S L
I M
|
RAX
-
NYSE
Rackspace Hosting Inc
INTERNET - Internet Software and; Services
|
$58.40
|
-0.64
-1.08% |
$58.65
|
1,993,262
118.40% of 50 DAV
50 DAV is 1,683,500
|
$60.55
-3.55%
|
4/26/2012
|
$58.39
|
PP = $59.53
|
|
MB = $62.51
|
Most Recent Note - 5/1/2012 7:00:46 PM
Y - Holding its ground within close striking distance of its 52-week high. Color code was recently changed to yellow with new pivot point cited based on its 3/27/12 high plus 10 cents following a 5-week consolidation. Volume-driven gains for new highs may trigger a new (or add-on) technical buy signal.
>>> The latest Featured Stock Update with an annotated graph appeared on 4/10/2012. Click here.
View all notes |
Alert me of new notes |
CANSLIM.net Company Profile |
SEC |
Zacks Reports |
StockTalk |
News |
Chart |
Request a new note
C
A N
S L
I M
|
Symbol/Exchange
Company Name
Industry Group |
PRICE |
CHANGE
(%Change) |
Day High |
Volume
(% DAV)
(% 50 day avg vol) |
52 Wk Hi
% From Hi |
Featured
Date |
Price
Featured |
Pivot Featured |
|
Max Buy |
RGR
-
NYSE
Sturm Ruger & Co Inc
CONSUMER DURABLES - Sporting Goods
|
$53.26
|
-1.44
-2.63% |
$54.60
|
633,918
127.45% of 50 DAV
50 DAV is 497,400
|
$58.42
-8.83%
|
3/22/2012
|
$46.49
|
PP = $46.78
|
|
MB = $49.12
|
Most Recent Note - 5/3/2012 1:44:14 PM
G - Pulling back on heavy volume today. Recently reported earnings +88% on +49% sales revenues for the quarter ended March 31, 2012 versus the year ago period. It has been repeatedly noted - "Extended from any sound base and the 50 DMA line defines support to watch on pullbacks."
>>> The latest Featured Stock Update with an annotated graph appeared on 3/22/2012. Click here.
View all notes |
Alert me of new notes |
CANSLIM.net Company Profile |
SEC |
Zacks Reports |
StockTalk |
News |
Chart |
Request a new note
C
A N
S L
I M
|
RNF
-
NYSE
Rentech Nitrogen Ptnr Lp
CHEMICALS - Agricultural Chemicals
|
$27.94
|
-0.36
-1.27% |
$28.53
|
181,264
74.87% of 50 DAV
50 DAV is 242,100
|
$30.39
-8.07%
|
4/27/2012
|
$29.32
|
PP = $28.60
|
|
MB = $30.03
|
Most Recent Note - 5/2/2012 4:47:04 PM
Y - Is hovering near its 52-week high since highlighted in yellow in the 4/27/12 mid-day breakouts report (read here) when it gapped up above the pivot point cited based on its 4/12/12 high plus 10 cents. Reporting earnings on Friday, May 11, 2012. See the latest FSU analysis for more details and a new annotated graph.
>>> The latest Featured Stock Update with an annotated graph appeared on 5/2/2012. Click here.
View all notes |
Alert me of new notes |
CANSLIM.net Company Profile |
SEC |
Zacks Reports |
StockTalk |
News |
Chart |
Request a new note
C
A N
S L
I M
|
RRTS
-
NYSE
Roadrunner Trans Systems
TRANSPORTATION - Air Delivery and Freight Service
|
$18.24
|
+0.13
0.72% |
$18.35
|
207,459
202.20% of 50 DAV
50 DAV is 102,600
|
$19.06
-4.30%
|
5/3/2012
|
$18.20
|
PP = $18.69
|
|
MB = $19.62
|
Most Recent Note - 5/4/2012 12:48:08 PM
Y - Holding its ground today following a gap up on the prior session. Color code was changed to yellow with new pivot point cited based on the 52-week high plus 10 cents. Its finish near the prior session low indicated that it encountered resistance, and it still needs a strong finish above the pivot point cited to clinch a proper technical buy signal. Reported earnings +79% on +38% sales revenues for the quarter ended March 31, 2012.
>>> The latest Featured Stock Update with an annotated graph appeared on 4/9/2012. Click here.
View all notes |
Alert me of new notes |
CANSLIM.net Company Profile |
SEC |
Zacks Reports |
StockTalk |
News |
Chart |
Request a new note
C
A N
S L
I M
|
SHFL
-
NASDAQ
Shuffle Master Inc
MANUFACTURING - Diversified Machinery
|
$17.18
|
-0.29
-1.66% |
$17.48
|
511,556
77.47% of 50 DAV
50 DAV is 660,300
|
$18.77
-8.47%
|
3/6/2012
|
$17.07
|
PP = $15.25
|
|
MB = $16.01
|
Most Recent Note - 5/2/2012 4:02:01 PM
G - Rebounded from lows near its 50 DMA and managed a positive reversal today. Its consolidation is not a sufficient length to be considered a sound new base pattern. It already has tested support at its 10-week moving average line multiple times this year, so it may not be considered an ideal "secondary buy point" now.
>>> The latest Featured Stock Update with an annotated graph appeared on 3/15/2012. Click here.
View all notes |
Alert me of new notes |
CANSLIM.net Company Profile |
SEC |
Zacks Reports |
StockTalk |
News |
Chart |
Request a new note
C
A N
S L
I M
|
SHOO
-
NASDAQ
Steven Madden Limited
CONSUMER NON-DURABLES - Textile - Apparel Footwear
|
$42.61
|
-1.02
-2.34% |
$44.20
|
357,871
101.99% of 50 DAV
50 DAV is 350,900
|
$45.70
-6.76%
|
4/27/2012
|
$43.20
|
PP = $45.32
|
|
MB = $47.59
|
Most Recent Note - 5/3/2012 12:49:22 PM
G - Rebounding from earlier lows following a gap down today after reporting earnings +22% on +60% sales revenues for the quarter ended March 31, 2012 versus the year ago period. Color code was changed to green based on fundamental and technical concerns after failing to break out from the previously noted "double bottom" base pattern. No recent buy signal was triggered. Sales revenues had shown impressive acceleration in the Jun, Sep, and Dec '11 quarterly comparisons with earnings increases above the +25% minimum guideline in the Sep and Dec '11 comparisons. Deterioration below the recent low ($40.91 on 4/24/12) would raise more serious concerns.
>>> The latest Featured Stock Update with an annotated graph appeared on 1/4/2011. Click here.
View all notes |
Alert me of new notes |
CANSLIM.net Company Profile |
SEC |
Zacks Reports |
StockTalk |
News |
Chart |
Request a new note
C
A N
S L
I M
|
Symbol/Exchange
Company Name
Industry Group |
PRICE |
CHANGE
(%Change) |
Day High |
Volume
(% DAV)
(% 50 day avg vol) |
52 Wk Hi
% From Hi |
Featured
Date |
Price
Featured |
Pivot Featured |
|
Max Buy |
SWI
-
NYSE
Solarwinds Inc
COMPUTER SOFTWARE and SERVICES - Application Software
|
$47.11
|
-0.08
-0.17% |
$47.55
|
1,237,273
112.28% of 50 DAV
50 DAV is 1,102,000
|
$47.66
-1.15%
|
4/26/2012
|
$45.15
|
PP = $42.32
|
|
MB = $44.44
|
Most Recent Note - 4/27/2012 6:58:59 PM
G - Color code is changed to green after getting more extended from its prior highs with today's 3rd consecutive volume-driven gain. The volume-driven gain to new highs triggered a new buy signal on 4/26/12 as it was featured in the mid-day report and noted - "Reported earnings +43% on +39% sales revenues for the quarter ended March 31, 2012 versus the year ago period. It held its ground stubbornly after violating its 50 DMA line when a damaging loss with above average volume triggered technical sell signals on 4/10/12 and it was dropped from the Featured Stocks list. Earnings below the +25% guideline for the Dec '11 quarter (+21%) had also raised fundamental concerns at that time, however the stock's resilience and impressive acceleration means that 3 of the past 4 quarterly comparisons are now above the minimum guideline concerning the C criteria. Its annual earnings (A criteria) history has been strong."
>>> The latest Featured Stock Update with an annotated graph appeared on 3/16/2012. Click here.
View all notes |
Alert me of new notes |
CANSLIM.net Company Profile |
SEC |
Zacks Reports |
StockTalk |
News |
Chart |
Request a new note
C
A N
S L
I M
|
SXCI
-
NASDAQ
S X C Health Solutions
COMPUTER SOFTWARE and SERVICES - Healthcare Information Service
|
$91.50
|
+0.11
0.12% |
$92.84
|
977,892
102.22% of 50 DAV
50 DAV is 956,700
|
$100.50
-8.96%
|
2/23/2012
|
$68.24
|
PP = $66.05
|
|
MB = $69.35
|
Most Recent Note - 5/3/2012 2:49:28 PM
G - Reported earnings +58% on +56% sales revenues for the quarter ended March 31, 2012 versus the year ago period. Volume and volatility often increase near earnings news. Pulling back toward recent lows, still too extended from its prior base to be buyable under the investment system's guidelines.
>>> The latest Featured Stock Update with an annotated graph appeared on 3/6/2012. Click here.
View all notes |
Alert me of new notes |
CANSLIM.net Company Profile |
SEC |
Zacks Reports |
StockTalk |
News |
Chart |
Request a new note
C
A N
S L
I M
|
TDC
-
NYSE
Teradata Corp
COMPUTER SOFTWARE and SERVICES - Technical and; System Software
|
$73.14
|
-4.00
-5.19% |
$76.59
|
3,527,391
259.02% of 50 DAV
50 DAV is 1,361,800
|
$79.89
-8.45%
|
5/3/2012
|
$79.06
|
PP = $70.73
|
|
MB = $74.27
|
Most Recent Note - 5/4/2012 12:51:53 PM
Y - Pulling back today near its "max buy" level following 3 consecutive volume-driven gains into new high territory. The 5/03/12 mid-day report noted - "Volume-driven gains this week have it rallying from a tight consolidation and "square box" base above its 50 DMA line. Color code is changed to yellow with pivot point based on its 4/03/12 high plus 10 cents. Hit a new 52-week high today with a gap up and considerable volume-driven gain, quickly getting extended from an ideal buy range. Technically, on 2/09/11 it broke out from a 15-week cup shaped base without a handle. The 4 latest quarterly comparisons showed earnings increases satisfying the C criteria and it has a good annual earnings (A criteria) history."
There are no Featured Stock Updates™ available for this stock at this time. You may request one by clicking the Request a New Note link below
View all notes |
Alert me of new notes |
CANSLIM.net Company Profile |
SEC |
Zacks Reports |
StockTalk |
News |
Chart |
Request a new note
C
A N
S L
I M
|
TDG
-
NYSE
Transdigm Group Inc
AEROSPACE/DEFENSE - Aerospace/Defense Products and; Services
|
$127.56
|
-1.82
-1.41% |
$128.21
|
563,055
131.31% of 50 DAV
50 DAV is 428,800
|
$130.09
-1.94%
|
2/29/2012
|
$120.10
|
PP = $118.93
|
|
MB = $124.88
|
Most Recent Note - 5/1/2012 6:52:02 PM
G - Color code is changed to green after rallying beyond its "max buy" level with above average volume behind its 4th gain in the span of 5 sessions. Prior highs in the $118-121 area define initial chart support to watch on pullbacks.
>>> The latest Featured Stock Update with an annotated graph appeared on 3/30/2012. Click here.
View all notes |
Alert me of new notes |
CANSLIM.net Company Profile |
SEC |
Zacks Reports |
StockTalk |
News |
Chart |
Request a new note
C
A N
S L
I M
|
TIBX
-
NASDAQ
Tibco Software Inc
COMPUTER SOFTWARE and SERVICES - Business Software and Services
|
$32.70
|
-0.62
-1.86% |
$33.09
|
2,645,451
90.06% of 50 DAV
50 DAV is 2,937,400
|
$34.67
-5.68%
|
3/30/2012
|
$31.01
|
PP = $31.25
|
|
MB = $32.81
|
Most Recent Note - 5/3/2012 2:51:58 PM
G - Consolidating well above support at prior highs in the $31 area and its 50 DMA line. It is extended from its prior base.
>>> The latest Featured Stock Update with an annotated graph appeared on 4/5/2012. Click here.
View all notes |
Alert me of new notes |
CANSLIM.net Company Profile |
SEC |
Zacks Reports |
StockTalk |
News |
Chart |
Request a new note
C
A N
S L
I M
|
Symbol/Exchange
Company Name
Industry Group |
PRICE |
CHANGE
(%Change) |
Day High |
Volume
(% DAV)
(% 50 day avg vol) |
52 Wk Hi
% From Hi |
Featured
Date |
Price
Featured |
Pivot Featured |
|
Max Buy |
TNGO
-
NASDAQ
Tangoe Inc
COMPUTER SOFTWARE and SERVICES - Technical and System Software
|
$19.80
|
-0.93
-4.49% |
$20.49
|
654,225
109.92% of 50 DAV
50 DAV is 595,200
|
$21.74
-8.92%
|
3/27/2012
|
$19.35
|
PP = $20.00
|
|
MB = $21.00
|
Most Recent Note - 5/4/2012 1:21:18 PM
Y - Loss today has it retreating below its pivot point again. A close below its recent low close ($19.53 on 4/24/12) would raise more serious concerns of technical deterioration while negating its 4/19/12 breakout. The 50 DMA line defines important near-term support to watch.
>>> The latest Featured Stock Update with an annotated graph appeared on 4/3/2012. Click here.
View all notes |
Alert me of new notes |
CANSLIM.net Company Profile |
SEC |
Zacks Reports |
StockTalk |
News |
Chart |
Request a new note
C
A N
S L
I M
|
TSCO
-
NASDAQ
Tractor Supply Co
SPECIALTY RETAIL - Specialty Retail, Other
|
$96.48
|
-2.50
-2.53% |
$98.76
|
1,111,478
144.57% of 50 DAV
50 DAV is 768,800
|
$101.20
-4.66%
|
5/1/2012
|
$98.38
|
PP = $101.30
|
|
MB = $106.37
|
Most Recent Note - 5/1/2012 6:20:55 PM
Y - Color code is changed to yellow with new pivot point cited based on its 4/19/12 high plus 10 cents after forming an advanced "3-weeks tight" base pattern. Volume-driven gains to new highs may trigger a new (or add-on) technical buy signal. Its 50 DMA line defines support to watch on pullbacks.
>>> The latest Featured Stock Update with an annotated graph appeared on 4/17/2012. Click here.
View all notes |
Alert me of new notes |
CANSLIM.net Company Profile |
SEC |
Zacks Reports |
StockTalk |
News |
Chart |
Request a new note
C
A N
S L
I M
|
UA
-
NYSE
Under Armour Inc Cl A
CONSUMER NON-DURABLES - Textile - Apparel Clothing
|
$96.53
|
-2.84
-2.86% |
$98.93
|
653,555
67.33% of 50 DAV
50 DAV is 970,700
|
$102.86
-6.15%
|
2/15/2012
|
$85.77
|
PP = $84.86
|
|
MB = $89.10
|
Most Recent Note - 5/1/2012 6:23:25 PM
G - Remains perched above its 50 DMA line very near its all-time high. No overhead supply remains to act as resistance, however no new pivot point was cited following its latest base. Concerns were raised by weaker fundamentals. Reported earnings +22% on +23% sales revenues for the quarter ended March 31, 2012 versus the year ago period, its first quarterly earnings increase below the +25% minimum guideline in more than 2 years.
>>> The latest Featured Stock Update with an annotated graph appeared on 4/4/2012. Click here.
View all notes |
Alert me of new notes |
CANSLIM.net Company Profile |
SEC |
Zacks Reports |
StockTalk |
News |
Chart |
Request a new note
C
A N
S L
I M
|
UBNT
-
NASDAQ
Ubiquiti Networks Inc
TELECOMMUNICATIONS - Diversified Communication Serv
|
$26.99
|
-1.79
-6.22% |
$28.87
|
999,215
204.25% of 50 DAV
50 DAV is 489,200
|
$35.99
-25.01%
|
4/12/2012
|
$33.89
|
PP = $34.07
|
|
MB = $35.77
|
Most Recent Note - 5/4/2012 1:28:33 PM
It will be dropped from the Featured Stocks list tonight. Damaging technical action negated its breakout with a gap down on 5/02/12 as it violated its recent lows and undercut its 50 DMA line triggering sell signals with its largest point loss on the highest volume ever.
>>> The latest Featured Stock Update with an annotated graph appeared on 4/20/2012. Click here.
View all notes |
Alert me of new notes |
CANSLIM.net Company Profile |
SEC |
Zacks Reports |
StockTalk |
News |
Chart |
Request a new note
C
A N
S L
I M
|
ULTA
-
NASDAQ
Ulta Salon Cosm & Frag
SPECIALTY RETAIL - Specialty Retail, Other
|
$87.49
|
-3.36
-3.70% |
$90.53
|
688,959
101.39% of 50 DAV
50 DAV is 679,500
|
$96.65
-9.48%
|
1/11/2012
|
$71.97
|
PP = $75.80
|
|
MB = $79.59
|
Most Recent Note - 5/1/2012 6:28:53 PM
G - After its damaging loss violating its 50 DMA line on 4/24/12 raised concerns and triggered a technical sell signal that short-term average has been acting as resistance. Prior highs in the $75 area are the next important support level to watch.
>>> The latest Featured Stock Update with an annotated graph appeared on 4/23/2012. Click here.
View all notes |
Alert me of new notes |
CANSLIM.net Company Profile |
SEC |
Zacks Reports |
StockTalk |
News |
Chart |
Request a new note
C
A N
S L
I M
|
Symbol/Exchange
Company Name
Industry Group |
PRICE |
CHANGE
(%Change) |
Day High |
Volume
(% DAV)
(% 50 day avg vol) |
52 Wk Hi
% From Hi |
Featured
Date |
Price
Featured |
Pivot Featured |
|
Max Buy |
V
-
NYSE
Visa Inc Cl A
DIVERSIFIED SERVICES - Business/Management Services
|
$117.79
|
+1.38
1.19% |
$118.89
|
5,852,429
178.23% of 50 DAV
50 DAV is 3,283,600
|
$125.35
-6.03%
|
3/12/2012
|
$116.53
|
PP = $119.46
|
|
MB = $125.43
|
Most Recent Note - 5/4/2012 12:57:25 PM
Y - Rebounding near its 50 DMA line which may now act as a resistance level after the technical violation on the prior session. Previously noted - "Reported earnings +30% on +15% sales revenues for the quarter ended March 31, 2012 versus the year ago period. It dipped below its 50 DMA line with today's 2nd consecutive loss with above average volume, trading to its lowest level since its 4/13/12 gain backed by +49% above average volume technically confirmed a buy signal."
>>> The latest Featured Stock Update with an annotated graph appeared on 3/7/2012. Click here.
View all notes |
Alert me of new notes |
CANSLIM.net Company Profile |
SEC |
Zacks Reports |
StockTalk |
News |
Chart |
Request a new note
C
A N
S L
I M
|
VMW
-
NYSE
Vmware Inc Cl A
COMPUTER SOFTWARE andamp; SERVICES - Technical andamp; System Software
|
$108.02
|
-4.44
-3.95% |
$111.47
|
1,529,990
96.34% of 50 DAV
50 DAV is 1,588,100
|
$118.79
-9.07%
|
4/18/2012
|
$110.04
|
PP = $115.29
|
|
MB = $121.05
|
Most Recent Note - 5/4/2012 6:01:22 PM
Y - Pulled back with near average but higher volume today, finishing near its 50 DMA line. It recently attracted institutional support near that important short-term average. Subsequent losses may raise greater concerns, and its prior low ($102.66 on 4/24/12) defines the next important near-term support level.
>>> The latest Featured Stock Update with an annotated graph appeared on 4/18/2012. Click here.
View all notes |
Alert me of new notes |
CANSLIM.net Company Profile |
SEC |
Zacks Reports |
StockTalk |
News |
Chart |
Request a new note
C
A N
S L
I M
|
VSI
-
NYSE
Vitamin Shoppe Inc
SPECIALTY RETAIL - Specialty Retail, Other
|
$45.42
|
-1.53
-3.26% |
$48.01
|
405,073
117.65% of 50 DAV
50 DAV is 344,300
|
$49.27
-7.81%
|
4/25/2012
|
$47.77
|
PP = $48.46
|
|
MB = $50.88
|
Most Recent Note - 5/4/2012 6:04:04 PM
Y - Lost ground today with higher volume and finished near the session low following a negative reversal on the prior session. Encountering distributional pressure (losses on higher volume) near its 52-week high and pivot point, not yet triggering a technical buy signal.
>>> The latest Featured Stock Update with an annotated graph appeared on 4/25/2012. Click here.
View all notes |
Alert me of new notes |
CANSLIM.net Company Profile |
SEC |
Zacks Reports |
StockTalk |
News |
Chart |
Request a new note
C
A N
S L
I M
|
WFM
-
NASDAQ
Whole Foods Market Inc
RETAIL - Grocery Stores
|
$89.96
|
-0.73
-0.80% |
$91.50
|
2,654,772
179.09% of 50 DAV
50 DAV is 1,482,400
|
$91.06
-1.21%
|
5/3/2012
|
$90.28
|
PP = $86.45
|
|
MB = $90.77
|
Most Recent Note - 5/4/2012 1:09:32 PM
Y - Holding its ground today after highlighted in yellow in the 5/03/12 mid-day report while breaking out above the pivot point based on its 52-week high plus 10 cents. Its considerable "breakaway gap" for a new 52-week high was backed by 5 times average volume as it cleared an orderly flat base pattern. The is no resistance remaining due to overhead supply. Reported earnings +25% on +14% sales revenues for the quarter ended March 31, 2012 versus the year ago period. Quarterly comparisons have shown strong earnings increases above the +25% guideline. Its annual earnings (A criteria) history has been improving since a downturn in FY '08.

There are no Featured Stock Updates™ available for this stock at this time. You may request one by clicking the Request a New Note link below
View all notes |
Alert me of new notes |
CANSLIM.net Company Profile |
SEC |
Zacks Reports |
StockTalk |
News |
Chart |
Request a new note
C
A N
S L
I M
|