You are not logged in.
This means you
CAN ONLY VIEW reports that were published prior to Monday, April 14, 2025.
You
MUST UPGRADE YOUR MEMBERSHIP if you want to see any current reports.
AFTER MARKET UPDATE - TUESDAY, MAY 3RD, 2011
Previous After Market Report Next After Market Report >>>
|
|
|
|
DOW |
+0.15 |
12,807.51 |
+0.00% |
|
Volume |
1,004,254,220 |
+7% |
|
Volume |
2,168,757,480 |
+7% |
|
NASDAQ |
-22.46 |
2,841.62 |
-0.78% |
|
Advancers |
1,047 |
33% |
|
Advancers |
787 |
29% |
|
S&P 500 |
-4.60 |
1,356.62 |
-0.34% |
|
Decliners |
1,973 |
63% |
|
Decliners |
1,843 |
68% |
|
Russell 2000 |
-11.00 |
843.77 |
-1.29% |
|
52 Wk Highs |
141 |
|
|
52 Wk Highs |
60 |
|
|
S&P 600 |
-5.32 |
448.66 |
-1.17% |
|
52 Wk Lows |
22 |
|
|
52 Wk Lows |
39 |
|
|
 |
Decliners Outnumber Advancers as Major Averages Endure Pressure
Kenneth J. Gruneisen - Passed the CAN SLIM® Master's Exam
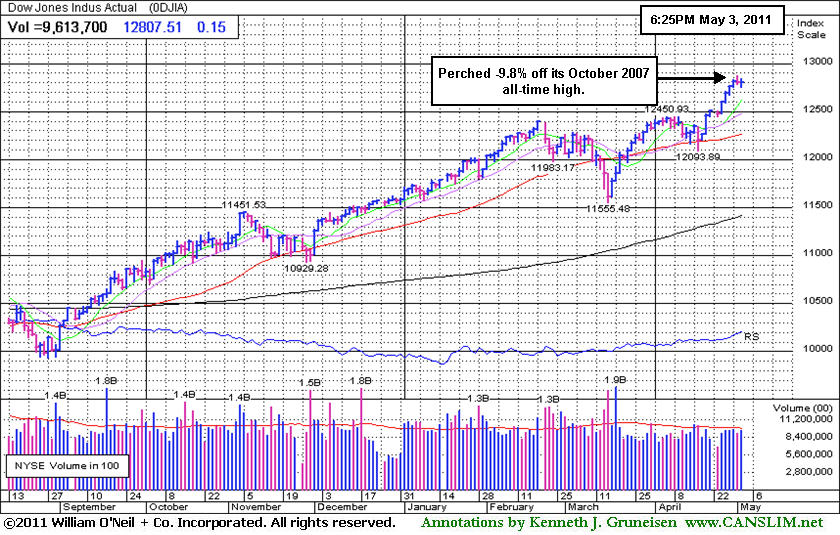
The major averages ended lower on Tuesday, except the Dow Jones Industrial Average which barely finished the session above unchanged. Declining issues beat advancers by 11-6 on the NYSE and by 5-2 on the Nasdaq. Volume totals were reported slightly above the prior session totals on both major stock exchanges, indicating that stocks were enduring distributional pressure. New 52-week highs still solidly outnumbered new 52-week lows on the NYSE and on the Nasdaq exchange. However, there were 17 high-ranked companies from the CANSLIM.net Leaders List that made new 52-week highs and appeared on the CANSLIM.net BreakOuts Page, down from the total of 86 on the prior session. On the Featured Stocks Page there were unanimous losses from all of the 19 high-ranked market leaders currently listed. Recent commentaries have repeatedly observed, "New set-ups with strong characteristics and fresh breakouts from high-ranked leaders have been scarce in recent weeks, even while the major averages have rallied."
A better-than-expected report on March factory orders gave the market only a mild boost. Factory orders rose for the fifth straight month in March as businesses ordered more large goods, orders rose 3.0%, above estimates for a gain of 1.9%. A sharp sell-off in commodities and weak earnings gave traders a reason to take profits. Choppy trading led to gains in utilities and telecommunications stocks, however those positives were offset by weakness in energy and mining shares. Crude oil fell more than $2 a barrel. Silver has dropped more than -12% in the past two days.
The new General Motors Company (GM +2.5%) posted a gain after its U.S. car sales jumped 26% in April. Fuel-efficient models led the way. Ford Motor Company (F -0.45%)was down after its April sales gained 16%. Dow component Pfizer Inc (PFE -2.76%) posted better-than-expected profits, but Lipitor sales were a disappointment and the company failed to increase its earnings estimate. Clorox Company (CLX -3.6%) results disappointed. Deutsche Bank AG (DB -1.77%) of Germany fell in New York trading. The U.S. is seeking $1 billion from the bank in a mortgage fraud suit. Sears Holdings Corp (SHLD -9.86%) dropped the most in almost a year after comparable-store sales fell and the company predicted a first-quarter loss. Financial stocks got a boost from MasterCard Inc (MA +2.58%) after the credit-card company's profits topped estimates.
Pundits have said that valuations are an increasing concern after last week's rally lifted the benchmark S&P 500 Index close to a three-year high. On Wednesday last week the Nasdaq Composite Index topped its October 2007 high. The S&P Mid-Cap 400 Index and S&P Small-Cap 600 Index both are at all-time highs.
Be ready for the May 2011 issue of CANSLIM.net News to be released soon! CANSLIM.net News includes a comprehensive summary of market action, leading industry groups, the most action-worthy leaders, and more. Only upgraded members can access CANSLIM.net News.
PICTURED: The Dow Jones Industrial Average is now perched -9.8% off its October 2007 all-time high.
|
 Kenneth J. Gruneisen started out as a licensed stockbroker in August 1987, a couple of months prior to the historic stock market crash that took the Dow Jones Industrial Average down -22.6% in a single day. He has published daily fact-based fundamental and technical analysis on high-ranked stocks online for two decades. Through FACTBASEDINVESTING.COM, Kenneth provides educational articles, news, market commentary, and other information regarding proven investment systems that work in good times and bad.
Comments contained in the body of this report are technical opinions only and are not necessarily those of Gruneisen Growth Corp. The material herein has been obtained from sources believed to be reliable and accurate, however, its accuracy and completeness cannot be guaranteed. Our firm, employees, and customers may effect transactions, including transactions contrary to any recommendation herein, or have positions in the securities mentioned herein or options with respect thereto. Any recommendation contained in this report may not be suitable for all investors and it is not to be deemed an offer or solicitation on our part with respect to the purchase or sale of any securities. |
|
 |
Bank Index Posts Standout Gain on Widely Negative Session
Kenneth J. Gruneisen - Passed the CAN SLIM® Master's Exam
Commodity-linked groups faced more downward pressure on Tuesday as the Oil Services Index ($OSX -2.84%), Integrated Oil Index ($XOI -2.50%), and Gold & Silver Index ($XAU -2.48%) suffered large losses. The tech sector also had a negative bias as the Semiconductor Index ($SOX -1.26%), Internet Index ($IIX -1.09%), Networking Index ($NWX -0.86%), and Biotechnology Index ($BTK -0.81%) ended unanimously lower. The Healthcare Index ($HMO -1.10%) backpedaled. The Broker/Dealer Index ($XBD -0.70%) and Retail Index ($RLX -0.49%) also suffered small losses that weighed on the major averages.
Charts courtesy www.stockcharts.com
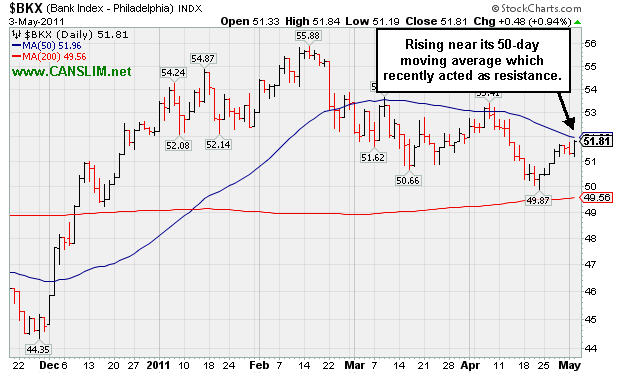
PICTURED: The Bank Index ($BKX +0.94%) was a standout gainer, rallying toward its 50-day moving average (DMA) line which recently acted as resistance. Subsequent gains above that short-term average would be an encouraging sign from this group long considered an important "leading indicator".
| Oil Services |
$OSX |
272.08 |
-7.94 |
-2.84% |
+11.00% |
| Healthcare |
$HMO |
2,316.15 |
-25.86 |
-1.10% |
+36.89% |
| Integrated Oil |
$XOI |
1,359.19 |
-34.81 |
-2.50% |
+12.04% |
| Semiconductor |
$SOX |
439.43 |
-5.63 |
-1.26% |
+6.70% |
| Networking |
$NWX |
332.85 |
-2.90 |
-0.86% |
+18.64% |
| Internet |
$IIX |
323.08 |
-3.55 |
-1.09% |
+4.99% |
| Broker/Dealer |
$XBD |
120.33 |
-0.85 |
-0.70% |
-0.97% |
| Retail |
$RLX |
540.92 |
-2.65 |
-0.49% |
+6.40% |
| Gold & Silver |
$XAU |
210.05 |
-5.35 |
-2.48% |
-7.30% |
| Bank |
$BKX |
51.81 |
+0.48 |
+0.94% |
-0.77% |
| Biotech |
$BTK |
1,467.72 |
-11.95 |
-0.81% |
+13.11% |
|
|
|
 |
Distributional Pressure After +115% Rally In Under 7 Months
Kenneth J. Gruneisen - Passed the CAN SLIM® Master's Exam
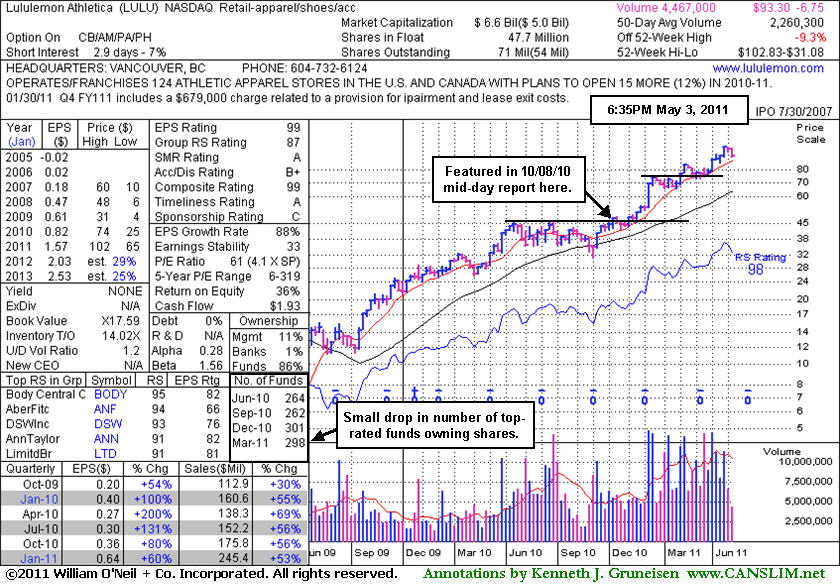
Lululemon Athletica (LULU -$3.05 or -3.17% to $93.30) was down again today with a loss on higher volume indicative of distributional pressure. Recently this high-ranked Retail-Apparel firm has been noted as extended from any sound base pattern. Prior highs and its 50-day moving average (DMA) line in the $85 area define important chart support to watch. Following its last appearance in this FSU section on 3/31/11 with an annotated graph under the headline, "Consolidating After Breakout Above New Pivot Point", it only briefly dipped below its "max buy" level while it went on rallying to hit a new all-time high of $102.83. Since this high-ranked Retail - Apparel/Shoes/Accessories firm was first featured in yellow at $47.66 in the October 8, 2010 mid-day report report (read here) it has traded up as much as +115.7% in less than 7 months. While it could go on to produce more climactic gains, its recent weakness suggests that it may be due for a longer and deeper consolidation.
The number of top-rated funds owning its shares fell to 298 in Mar '11 from 301 in Dec '10, which is a slightly disconcerting indication concerning the I criteria. Its board of directors recently approved a 2-for-1 stock split (pending). The 5 latest quarterly comparisons showed strong sales revenues and impressive earnings increases (C criteria), and it maintained a good annual earnings history (A criteria) despite a patch of negative comparisons in early '09.
|
|
|
Color Codes Explained :
Y - Better candidates highlighted by our
staff of experts.
G - Previously featured
in past reports as yellow but may no longer be buyable under the
guidelines.
***Last / Change / Volume data in this table is the closing quote data***
Symbol/Exchange
Company Name
Industry Group |
PRICE |
CHANGE
(%Change) |
Day High |
Volume
(% DAV)
(% 50 day avg vol) |
52 Wk Hi
% From Hi |
Featured
Date |
Price
Featured |
Pivot Featured |
|
Max Buy |
AIXG
-
NASDAQ
Aixtron Se
ELECTRONICS - Semiconductor Equipment andamp; Mate
|
$41.40
|
-1.01
-2.38% |
$41.85
|
95,537
36.33% of 50 DAV
50 DAV is 263,000
|
$44.96
-7.92%
|
4/5/2011
|
$44.14
|
PP = $44.64
|
|
MB = $46.87
|
 Most Recent Note - 5/3/2011 4:44:05 PM
G - Gapped down today, again slumping below its 50 DMA line. Now perched -7.9% off its all-time high. It recently found support near prior lows in the $38 area.
>>> The latest Featured Stock Update with an annotated graph appeared on 4/5/2011. Click here.
View all notes |
Alert me of new notes |
CANSLIM.net Company Profile |
SEC |
Zacks Reports |
StockTalk |
News |
Chart |
Request a new note
C
A N
S L
I M


|
BIDU
-
NASDAQ
Baidu Inc Ads
INTERNET - Internet Information Providers
|
$139.84
|
-7.63
-5.17% |
$148.40
|
15,589,313
210.96% of 50 DAV
50 DAV is 7,389,700
|
$156.04
-10.38%
|
3/17/2011
|
$121.97
|
PP = $131.73
|
|
MB = $138.32
|
Most Recent Note - 5/3/2011 3:58:03 PM
G - Considerable loss on heavy volume today marks its 3rd distribution day in the span of 5 trading sessions. Recently reported earnings +129% on +96% sales revenues for the quarter ended March 31, 2011 versus the year ago period. Prior high near $131 defines initial chart support to watch near its rising 50 DMA line.
>>> The latest Featured Stock Update with an annotated graph appeared on 4/7/2011. Click here.
View all notes |
Alert me of new notes |
CANSLIM.net Company Profile |
SEC |
Zacks Reports |
StockTalk |
News |
Chart |
Request a new note
C
A N
S L
I M
|
CMG
-
NYSE
Chipotle Mexican Grill
LEISURE - Restaurants
|
$260.41
|
-6.67
-2.50% |
$267.76
|
914,119
79.08% of 50 DAV
50 DAV is 1,155,900
|
$289.35
-10.00%
|
4/1/2011
|
$274.00
|
PP = $275.10
|
|
MB = $288.86
|
Most Recent Note - 5/3/2011 4:30:19 PM
G - Loss today with below average volume led to a close below its 50 DMA line, raising concerns. It recently negated its latest technical breakout, and it is now perched -10% off its 52-week high.
>>> The latest Featured Stock Update with an annotated graph appeared on 4/13/2011. Click here.
View all notes |
Alert me of new notes |
CANSLIM.net Company Profile |
SEC |
Zacks Reports |
StockTalk |
News |
Chart |
Request a new note
C
A N
S L
I M
|
CTSH
-
NASDAQ
Cognizant Tech Sol Cl A
COMPUTER SOFTWARE and SERVICES - Business Software and Services
|
$77.52
|
-4.69
-5.70% |
$78.26
|
14,302,547
647.41% of 50 DAV
50 DAV is 2,209,200
|
$83.48
-7.14%
|
2/7/2011
|
$75.09
|
PP = $76.46
|
|
MB = $80.28
|
Most Recent Note - 5/3/2011 4:34:55 PM
G - Gapped down today following news it increased earnings +34% on +43% sales revenues for the quarter ended March 31, 2011 versus the year ago period. Raised concerns by trading well below its 50 DMA line and well below recent chart low ($76.77 on April 18th) defining near term support, however it found prompt support and finished near the session high.
>>> The latest Featured Stock Update with an annotated graph appeared on 4/15/2011. Click here.
View all notes |
Alert me of new notes |
CANSLIM.net Company Profile |
SEC |
Zacks Reports |
StockTalk |
News |
Chart |
Request a new note
C
A N
S L
I M
|
EZPW
-
NASDAQ
Ezcorp Inc Cl A
SPECIALTY RETAIL - Specialty Retail, Other
|
$30.67
|
-0.40
-1.29% |
$31.11
|
317,949
85.49% of 50 DAV
50 DAV is 371,900
|
$33.08
-7.29%
|
2/18/2011
|
$27.94
|
PP = $30.04
|
|
MB = $31.54
|
Most Recent Note - 4/28/2011 5:20:24 PM
G - Closed near the session high today, rebounding further above its 50 DMA line and prior highs in the $29-30 area after negating its recent breakout. It has not formed a sound new base pattern. Reported earnings +31% on +21% sales revenues for the quarter ended March 31, 2011 versus the year ago period.
>>> The latest Featured Stock Update with an annotated graph appeared on 4/11/2011. Click here.
View all notes |
Alert me of new notes |
CANSLIM.net Company Profile |
SEC |
Zacks Reports |
StockTalk |
News |
Chart |
Request a new note
C
A N
S L
I M
|
Symbol/Exchange
Company Name
Industry Group |
PRICE |
CHANGE
(%Change) |
Day High |
Volume
(% DAV)
(% 50 day avg vol) |
52 Wk Hi
% From Hi |
Featured
Date |
Price
Featured |
Pivot Featured |
|
Max Buy |
FOSL
-
NASDAQ
Fossil Inc
CONSUMER DURABLES - Recreational Goods, Other
|
$91.01
|
-0.53
-0.58% |
$92.50
|
551,843
63.38% of 50 DAV
50 DAV is 870,700
|
$96.99
-6.17%
|
2/1/2011
|
$73.30
|
PP = $74.44
|
|
MB = $78.16
|
Most Recent Note - 5/2/2011 6:57:56 PM
G - Down today on higher volume. It could produce more climactic gains, but it is extended from any sound base. Its 50 DMA line now defines support above prior chart highs. See latest FSU analysis for more details and a new annotated graph.
>>> The latest Featured Stock Update with an annotated graph appeared on 5/2/2011. Click here.
View all notes |
Alert me of new notes |
CANSLIM.net Company Profile |
SEC |
Zacks Reports |
StockTalk |
News |
Chart |
Request a new note
C
A N
S L
I M
|
HMSY
-
NASDAQ
H M S Holdings Corp
COMPUTER SOFTWARE and SERVICES - Healthcare Information Service
|
$76.39
|
-1.81
-2.31% |
$80.00
|
282,991
158.89% of 50 DAV
50 DAV is 178,100
|
$84.82
-9.94%
|
11/19/2010
|
$61.89
|
PP = $63.01
|
|
MB = $66.16
|
Most Recent Note - 5/3/2011 4:47:17 PM
G - Closed near the session low today with a 3rd consecutive loss with above average volume Violated its 50 DMA line last week with a loss on heavy volume triggering a technical sell signal. Reported earnings +26% on +27% sales revenues for the quarter ended March 31, 2011 versus the year ago period.
>>> The latest Featured Stock Update with an annotated graph appeared on 4/26/2011. Click here.
View all notes |
Alert me of new notes |
CANSLIM.net Company Profile |
SEC |
Zacks Reports |
StockTalk |
News |
Chart |
Request a new note
C
A N
S L
I M
|
HS
-
NYSE
Healthspring Inc
HEALTH SERVICES - Health Care Plans
|
$43.27
|
-0.47
-1.07% |
$44.37
|
1,407,274
153.28% of 50 DAV
50 DAV is 918,100
|
$43.97
-1.59%
|
3/22/2011
|
$38.29
|
PP = $38.85
|
|
MB = $40.79
|
Most Recent Note - 5/2/2011 12:51:43 PM
G - Up today for a considerable gain with above average volume, getting more extended from a sound base. Its 50 DMA line defines important chart support.
>>> The latest Featured Stock Update with an annotated graph appeared on 4/21/2011. Click here.
View all notes |
Alert me of new notes |
CANSLIM.net Company Profile |
SEC |
Zacks Reports |
StockTalk |
News |
Chart |
Request a new note
C
A N
S L
I M
|
INFA
-
NASDAQ
Informatica Corp
COMPUTER SOFTWARE and SERVICES - Business Software and Services
|
$52.78
|
-2.15
-3.91% |
$54.92
|
1,474,862
145.49% of 50 DAV
50 DAV is 1,013,700
|
$56.49
-6.57%
|
3/24/2011
|
$50.04
|
PP = $49.86
|
|
MB = $52.35
|
Most Recent Note - 5/3/2011 4:00:10 PM
G - Down today with higher volume indicative of distributional pressure following a negative reversal on 5/02/11 after touching a new 52-week high. Extended from its latest base. Prior highs in the $49 area define support to watch coinciding with its 50 DMA line.
>>> The latest Featured Stock Update with an annotated graph appeared on 4/27/2011. Click here.
View all notes |
Alert me of new notes |
CANSLIM.net Company Profile |
SEC |
Zacks Reports |
StockTalk |
News |
Chart |
Request a new note
C
A N
S L
I M
|
LULU
-
NASDAQ
Lululemon Athletica
MANUFACTURING - Textile Manufacturing
|
$93.30
|
-3.05
-3.17% |
$95.58
|
2,524,823
112.64% of 50 DAV
50 DAV is 2,241,500
|
$102.83
-9.27%
|
3/28/2011
|
$68.11
|
PP = $85.38
|
|
MB = $89.65
|
Most Recent Note - 5/3/2011 6:55:30 PM
G - Down again today, with higher volume indicative of distributional pressure. This high-ranked Retail-Apparel firm has been noted as extended from any sound base pattern. Prior highs and its 50 DMA line in the $85 area define important chart support to watch. See the latest FSU analysis for more details and a new annotated graph.
>>> The latest Featured Stock Update with an annotated graph appeared on 5/3/2011. Click here.
View all notes |
Alert me of new notes |
CANSLIM.net Company Profile |
SEC |
Zacks Reports |
StockTalk |
News |
Chart |
Request a new note
C
A N
S L
I M
|
Symbol/Exchange
Company Name
Industry Group |
PRICE |
CHANGE
(%Change) |
Day High |
Volume
(% DAV)
(% 50 day avg vol) |
52 Wk Hi
% From Hi |
Featured
Date |
Price
Featured |
Pivot Featured |
|
Max Buy |
MG
-
NYSE
Mistras Group Inc
DIVERSIFIED SERVICES - Bulding and Faci;ity Management Services
|
$16.82
|
-1.41
-7.73% |
$18.00
|
182,489
142.46% of 50 DAV
50 DAV is 128,100
|
$18.46
-8.88%
|
3/15/2011
|
$15.48
|
PP = $15.90
|
|
MB = $16.70
|
Most Recent Note - 5/3/2011 4:06:06 PM
G - Gapped down today and undercut prior highs after announcing plans for a new Public Offering. It tested its 50 DMA line which defines important support to watch.
>>> The latest Featured Stock Update with an annotated graph appeared on 4/12/2011. Click here.
View all notes |
Alert me of new notes |
CANSLIM.net Company Profile |
SEC |
Zacks Reports |
StockTalk |
News |
Chart |
Request a new note
C
A N
S L
I M
|
MWIV
-
NASDAQ
M W I Veterinary Supply
HEALTH SERVICES - Medical Instruments and; Supplies
|
$80.69
|
-2.42
-2.91% |
$83.51
|
95,499
92.63% of 50 DAV
50 DAV is 103,100
|
$84.97
-5.04%
|
11/4/2010
|
$61.79
|
PP = $59.60
|
|
MB = $62.58
|
Most Recent Note - 5/3/2011 4:17:13 PM
G - Down today with higher (near average) volume indicative of distributional pressure, finishing -5% off its all-time high. Due to report earnings on the morning of Thursday, May 5th. It is extended from any sound base pattern, and its 50 DMA line defines important support to watch. Since first featured in yellow on 7/29/10 it has traded as much as +63% higher.
>>> The latest Featured Stock Update with an annotated graph appeared on 4/8/2011. Click here.
View all notes |
Alert me of new notes |
CANSLIM.net Company Profile |
SEC |
Zacks Reports |
StockTalk |
News |
Chart |
Request a new note
C
A N
S L
I M
|
OPEN
-
NASDAQ
Opentable Inc
INTERNET - Internet Software and Services
|
$105.00
|
-8.83
-7.76% |
$113.97
|
2,734,586
230.59% of 50 DAV
50 DAV is 1,185,900
|
$118.66
-11.51%
|
3/17/2011
|
$90.71
|
PP = $96.07
|
|
MB = $100.87
|
Most Recent Note - 5/3/2011 3:49:41 PM
G - Damaging loss today with heavy volume, slumping toward its recent lows and 50 DMA line. Reporting earnings after today's close for the quarter ended March 31, 2011. It could produce more climactic gains, but currently it is not near any sound base pattern.
>>> The latest Featured Stock Update with an annotated graph appeared on 4/25/2011. Click here.
View all notes |
Alert me of new notes |
CANSLIM.net Company Profile |
SEC |
Zacks Reports |
StockTalk |
News |
Chart |
Request a new note
C
A N
S L
I M
|
PAY
-
NYSE
Verifone Systems Inc
COMPUTER HARDWARE - Transaction Automation Systems
|
$50.68
|
-2.28
-4.31% |
$52.95
|
4,272,898
178.78% of 50 DAV
50 DAV is 2,390,000
|
$58.88
-13.93%
|
4/29/2011
|
$54.73
|
PP = $58.98
|
|
MB = $61.93
|
Most Recent Note - 5/3/2011 3:51:57 PM
Y - Violated its 50 DMA line today with a damaging loss on above average volume, raising concerns. It has recently formed a short flat base, considered a riskier "late-stage" base, and its color code was changed to yellow with a new pivot point cited based on its 52-week high plus 10 cents. The "Ken's Mailbag" Q&A in the 4/29/11 After Market Update included more details about late-stage bases (read here).
>>> The latest Featured Stock Update with an annotated graph appeared on 4/4/2011. Click here.
View all notes |
Alert me of new notes |
CANSLIM.net Company Profile |
SEC |
Zacks Reports |
StockTalk |
News |
Chart |
Request a new note
C
A N
S L
I M
|
PCLN
-
NASDAQ
Priceline.Com Inc
INTERNET - Internet Software and Services
|
$540.11
|
-15.54
-2.80% |
$561.00
|
1,162,522
98.15% of 50 DAV
50 DAV is 1,184,400
|
$561.88
-3.87%
|
1/3/2011
|
$399.55
|
PP = $428.20
|
|
MB = $449.61
|
Most Recent Note - 5/3/2011 4:42:05 PM
G - Pulling back from a new 52-week high this week without great volume conviction. It may go on to produce more climactic gains, yet it has been repeatedly noted - "Extended from any sound base pattern. Its 50 DMA line has defined support throughout its advance."
>>> The latest Featured Stock Update with an annotated graph appeared on 4/20/2011. Click here.
View all notes |
Alert me of new notes |
CANSLIM.net Company Profile |
SEC |
Zacks Reports |
StockTalk |
News |
Chart |
Request a new note
C
A N
S L
I M
|
Symbol/Exchange
Company Name
Industry Group |
PRICE |
CHANGE
(%Change) |
Day High |
Volume
(% DAV)
(% 50 day avg vol) |
52 Wk Hi
% From Hi |
Featured
Date |
Price
Featured |
Pivot Featured |
|
Max Buy |
RAX
-
NYSE
Rackspace Hosting Inc
INTERNET - Internet Software and; Services
|
$42.41
|
-2.01
-4.52% |
$44.42
|
2,200,193
137.05% of 50 DAV
50 DAV is 1,605,400
|
$46.50
-8.79%
|
3/16/2011
|
$36.28
|
PP = $40.72
|
|
MB = $42.76
|
Most Recent Note - 5/3/2011 3:55:27 PM
G - Down today on higher volume indicative of distributional pressure, pulling back from its all-time high. Due to report earnings news. Prior highs near $40 define support along with its 50 DMA line.
>>> The latest Featured Stock Update with an annotated graph appeared on 4/18/2011. Click here.
View all notes |
Alert me of new notes |
CANSLIM.net Company Profile |
SEC |
Zacks Reports |
StockTalk |
News |
Chart |
Request a new note
C
A N
S L
I M
|
TIBX
-
NASDAQ
Tibco Software Inc
COMPUTER SOFTWARE and SERVICES - Business Software and Services
|
$29.01
|
-0.65
-2.19% |
$29.72
|
2,760,794
110.58% of 50 DAV
50 DAV is 2,496,700
|
$30.45
-4.73%
|
3/18/2011
|
$23.88
|
PP = $26.04
|
|
MB = $27.34
|
Most Recent Note - 5/3/2011 6:52:55 PM
G - Pulling back from its all-time high today with a small loss on slightly above average volume. Repeatedly noted as extended from any sound base, meanwhile prior highs and its 50 DMA line define chart support near the $26 level.
>>> The latest Featured Stock Update with an annotated graph appeared on 4/14/2011. Click here.
View all notes |
Alert me of new notes |
CANSLIM.net Company Profile |
SEC |
Zacks Reports |
StockTalk |
News |
Chart |
Request a new note
C
A N
S L
I M
|
UA
-
NYSE
Under Armour Inc Cl A
CONSUMER NON-DURABLES - Textile - Apparel Clothing
|
$64.75
|
-2.05
-3.07% |
$66.74
|
1,258,888
143.01% of 50 DAV
50 DAV is 880,300
|
$80.00
-19.06%
|
3/31/2011
|
$68.04
|
PP = $70.79
|
|
MB = $74.33
|
Most Recent Note - 5/3/2011 4:21:26 PM
Down again today for a 3rd consecutive loss with above average volume, slumping further below its 50 DMA line and under prior chart highs after triggering technical sell signals noted last week. Based on weakness it will be dropped from the Featured Stocks list tonight. See the latest FSU analysis for details and a new annotated graph.
>>> The latest Featured Stock Update with an annotated graph appeared on 4/29/2011. Click here.
View all notes |
Alert me of new notes |
CANSLIM.net Company Profile |
SEC |
Zacks Reports |
StockTalk |
News |
Chart |
Request a new note
C
A N
S L
I M
|
ULTA
-
NASDAQ
Ulta Salon Cosm & Frag
SPECIALTY RETAIL - Specialty Retail, Other
|
$52.40
|
-0.96
-1.80% |
$53.36
|
359,276
58.69% of 50 DAV
50 DAV is 612,200
|
$53.99
-2.94%
|
1/6/2011
|
$36.12
|
PP = $37.34
|
|
MB = $39.21
|
Most Recent Note - 4/28/2011 6:54:20 PM
G - Extended from any sound base now. Its 50 DMA line defines chart support to watch well above prior highs. See the latest FSU analysis for more details and a new annotated graph.
>>> The latest Featured Stock Update with an annotated graph appeared on 4/28/2011. Click here.
View all notes |
Alert me of new notes |
CANSLIM.net Company Profile |
SEC |
Zacks Reports |
StockTalk |
News |
Chart |
Request a new note
C
A N
S L
I M
|
|
|
|
THESE ARE NOT BUY RECOMMENDATIONS!
Comments contained in the body of this report are technical
opinions only. The material herein has been obtained
from sources believed to be reliable and accurate, however,
its accuracy and completeness cannot be guaranteed.
This site is not an investment advisor, hence it does
not endorse or recommend any securities or other investments.
Any recommendation contained in this report may not
be suitable for all investors and it is not to be deemed
an offer or solicitation on our part with respect to
the purchase or sale of any securities. All trademarks,
service marks and trade names appearing in this report
are the property of their respective owners, and are
likewise used for identification purposes only.
This report is a service available
only to active Paid Premium Members.
You may opt-out of receiving report notifications
at any time. Questions or comments may be submitted
by writing to Premium Membership Services 665 S.E. 10 Street, Suite 201 Deerfield Beach, FL 33441-5634 or by calling 1-800-965-8307
or 954-785-1121.
|
|
|

