Symbol/Exchange
Company Name
Industry Group |
PRICE |
CHANGE
(%Change) |
Day High |
Volume
(% DAV)
(% 50 day avg vol) |
52 Wk Hi
% From Hi |
Featured
Date |
Price
Featured |
Pivot Featured |
|
Max Buy |
ACN
-
NYSE
Accenture Plc
DIVERSIFIED SERVICES - Business/Management Services
|
$65.13
|
+0.13
0.20% |
$65.40
|
2,637,120
80.73% of 50 DAV
50 DAV is 3,266,600
|
$65.89
-1.15%
|
3/23/2012
|
$64.13
|
PP = $63.76
|
|
MB = $66.95
|
Most Recent Note - 4/30/2012 5:38:39 PM
Y - Recently consolidating above prior highs in the $62-63 area and its 50 DMA line defining important near-term support. A subsequent violation of its recent low would trigger a worrisome technical sell signal.
>>> The latest Featured Stock Update with an annotated graph appeared on 3/23/2012. Click here.
View all notes |
Alert me of new notes |
CANSLIM.net Company Profile |
SEC |
Zacks Reports |
StockTalk |
News |
Chart |
Request a new note
C
A N
S L
I M


|
ADS
-
NYSE
Alliance Data Sys Corp
COMPUTER SOFTWARE and SERVICES - Information and Delivery Service
|
$129.67
|
+0.62
0.48% |
$129.96
|
294,945
50.98% of 50 DAV
50 DAV is 578,600
|
$130.66
-0.76%
|
1/17/2012
|
$108.24
|
PP = $107.43
|
|
MB = $112.80
|
Most Recent Note - 5/1/2012 6:31:47 PM
G - Still holding its ground near its all-time high today even after sub par earnings increases raised fundamental concerns. Its 50 DMA line defines important support to watch where any violation would trigger a technical sell signal.
>>> The latest Featured Stock Update with an annotated graph appeared on 4/24/2012. Click here.
View all notes |
Alert me of new notes |
CANSLIM.net Company Profile |
SEC |
Zacks Reports |
StockTalk |
News |
Chart |
Request a new note
C
A N
S L
I M
|
ALLT
-
NASDAQ
Allot Communications Ltd
COMPUTER SOFTWARE andamp; SERVICES - Technical andamp; System Software
|
$26.62
|
+0.32
1.22% |
$26.97
|
396,142
84.86% of 50 DAV
50 DAV is 466,800
|
$26.92
-1.11%
|
3/13/2012
|
$19.72
|
PP = $18.91
|
|
MB = $19.86
|
Most Recent Note - 5/1/2012 11:52:40 AM
G - Gapped up today for a considerable gain and new all-time high, getting more extended from its prior base. Reported earnings +88% on +41% sales revenues for the quarter ended March 31, 2012 versus the year ago period. Recent lows ($22.46 on 4/23/12) define near-term support above its 50 DMA line.
>>> The latest Featured Stock Update with an annotated graph appeared on 3/19/2012. Click here.
View all notes |
Alert me of new notes |
CANSLIM.net Company Profile |
SEC |
Zacks Reports |
StockTalk |
News |
Chart |
Request a new note
C
A N
S L
I M
|
ALXN
-
NASDAQ
Alexion Pharmaceuticals
DRUGS - Drug Manufacturers - Other
|
$92.26
|
+0.53
0.58% |
$92.56
|
830,439
66.99% of 50 DAV
50 DAV is 1,239,600
|
$95.01
-2.89%
|
5/1/2012
|
$91.73
|
PP = $95.11
|
|
MB = $99.87
|
Most Recent Note - 5/1/2012 6:36:07 PM
Y - Color code is changed to yellow with new pivot point cited based on its 3/26/12 high plus 10 cents after building an orderly flat base above support at its 50 DMA line. The late-stage base may be a riskier set-up, yet volume-driven gains could trigger a new (or add-on) technical buy signal. .
>>> The latest Featured Stock Update with an annotated graph appeared on 4/16/2012. Click here.
View all notes |
Alert me of new notes |
CANSLIM.net Company Profile |
SEC |
Zacks Reports |
StockTalk |
News |
Chart |
Request a new note
C
A N
S L
I M
|
ARBA
-
NASDAQ
Ariba Inc
INTERNET - Internet Software and Services
|
$38.82
|
-0.35
-0.89% |
$39.20
|
768,943
78.63% of 50 DAV
50 DAV is 977,900
|
$40.45
-4.03%
|
4/27/2012
|
$38.53
|
PP = $37.24
|
|
MB = $39.10
|
Most Recent Note - 4/30/2012 7:01:48 PM
Y - Pulled back today with above average volume following the prior session's technical breakout on 5 times average volume. Support to watch is at prior highs in the $35-37 area. ARBA was highlighted in yellow in the 4/27/12 mid-day breakouts report (read here) when breaking out above the pivot point cited based on its 7/11/11 high plus 10 cents. See the latest FSU analysis for more details and a new annotated graph.
>>> The latest Featured Stock Update with an annotated graph appeared on 4/30/2012. Click here.
View all notes |
Alert me of new notes |
CANSLIM.net Company Profile |
SEC |
Zacks Reports |
StockTalk |
News |
Chart |
Request a new note
C
A N
S L
I M
|
Symbol/Exchange
Company Name
Industry Group |
PRICE |
CHANGE
(%Change) |
Day High |
Volume
(% DAV)
(% 50 day avg vol) |
52 Wk Hi
% From Hi |
Featured
Date |
Price
Featured |
Pivot Featured |
|
Max Buy |
BODY
-
NASDAQ
Body Central Corp
RETAIL - Catalog andamp; Mail Order Houses
|
$29.60
|
+0.24
0.82% |
$29.61
|
217,928
117.54% of 50 DAV
50 DAV is 185,400
|
$30.93
-4.31%
|
4/18/2012
|
$27.44
|
PP = $29.59
|
|
MB = $31.07
|
Most Recent Note - 5/1/2012 6:48:37 PM
Y - Pulled back toward prior highs today on lighter volume. Gains above the pivot point backed by a minimum of +40% above average volume are still needed to trigger a proper new (or add-on) technical buy signal.
>>> The latest Featured Stock Update with an annotated graph appeared on 3/13/2012. Click here.
View all notes |
Alert me of new notes |
CANSLIM.net Company Profile |
SEC |
Zacks Reports |
StockTalk |
News |
Chart |
Request a new note
C
A N
S L
I M
|
CDNS
-
NASDAQ
Cadence Design Systems
COMPUTER SOFTWARE and SERVICES - Technical and System Software
|
$11.61
|
-0.07
-0.60% |
$11.69
|
2,991,719
106.44% of 50 DAV
50 DAV is 2,810,600
|
$12.60
-7.86%
|
2/3/2012
|
$11.66
|
PP = $11.15
|
|
MB = $11.71
|
 Most Recent Note - 5/2/2012 4:04:14 PM
G - Its 50 DMA line has been acting as resistance and a rebound above that important short-term average is needed for its technical stance and outlook to improve.
>>> The latest Featured Stock Update with an annotated graph appeared on 3/28/2012. Click here.
View all notes |
Alert me of new notes |
CANSLIM.net Company Profile |
SEC |
Zacks Reports |
StockTalk |
News |
Chart |
Request a new note
C
A N
S L
I M
|
CELG
-
NASDAQ
Celgene Corp
DRUGS - Drug Manufacturers - Major
|
$71.97
|
-0.61
-0.84% |
$72.47
|
5,065,318
174.40% of 50 DAV
50 DAV is 2,904,400
|
$80.42
-10.51%
|
2/2/2012
|
$74.16
|
PP = $75.21
|
|
MB = $78.97
|
Most Recent Note - 5/2/2012 4:06:47 PM
G - Suffered another small loss on heavy volume today, slumping further since violating its 50 DMA line and triggering a technical sell signal. A rebound above its 50 DMA line is necessary for its outlook improve. Reported earnings +30% on +13% sales revenues for the quarter ended March 31, 2012 versus the year ago period.
>>> The latest Featured Stock Update with an annotated graph appeared on 3/26/2012. Click here.
View all notes |
Alert me of new notes |
CANSLIM.net Company Profile |
SEC |
Zacks Reports |
StockTalk |
News |
Chart |
Request a new note
C
A N
S L
I M
|
CERN
-
NASDAQ
Cerner Corp
COMPUTER SOFTWARE and SERVICES - Healthcare Information Service
|
$83.00
|
+0.20
0.24% |
$83.27
|
1,675,254
153.55% of 50 DAV
50 DAV is 1,091,000
|
$84.10
-1.31%
|
4/27/2012
|
$77.23
|
PP = $78.63
|
|
MB = $82.56
|
Most Recent Note - 5/1/2012 6:14:21 PM
G - This Computer Software - Medical firm rallied above its "max buy" level with today's 5th consecutive volume-driven gain and its color code was changed to green. See the latest FSU analysis for more details and a new annotated graph.
>>> The latest Featured Stock Update with an annotated graph appeared on 5/1/2012. Click here.
View all notes |
Alert me of new notes |
CANSLIM.net Company Profile |
SEC |
Zacks Reports |
StockTalk |
News |
Chart |
Request a new note
C
A N
S L
I M
|
CMCSA
-
NASDAQ
Comcast Corp Cl A
MEDIA - CATV Systems
|
$30.42
|
-0.19
-0.60% |
$30.56
|
28,301,397
223.09% of 50 DAV
50 DAV is 12,686,100
|
$30.88
-1.49%
|
5/2/2012
|
$30.04
|
PP = $30.51
|
|
MB = $32.04
|
Most Recent Note - 5/2/2012 12:30:12 PM
Y - Small gap down today tested support at its nearby 50 DMA line. Color code is changed to yellow with pivot point cited based on its 3/27/12 high plus 10 cents after a flat base. Technically, its volume driven-gain on the prior session triggered a technical buy signal capping a streak of 6 consecutive gains with an above average volume gain as it hit a new 52-week high and traded above its 2007 high within close range of its all-time high ($31.92 Dec '99). Reported earnings +25% on +23% sales for the quarter ended March 31, 2012 versus the year ago period. The 3 prior quarterly comparisons (through Dec '11) showed sales revenues increases above the year ago periods by +50%, and earnings increases were above the +25% guideline in 3 of the past 4 comparisons.
There are no Featured Stock Updates™ available for this stock at this time. You may request one by clicking the Request a New Note link below
View all notes |
Alert me of new notes |
CANSLIM.net Company Profile |
SEC |
Zacks Reports |
StockTalk |
News |
Chart |
Request a new note
C
A N
S L
I M
|
Symbol/Exchange
Company Name
Industry Group |
PRICE |
CHANGE
(%Change) |
Day High |
Volume
(% DAV)
(% 50 day avg vol) |
52 Wk Hi
% From Hi |
Featured
Date |
Price
Featured |
Pivot Featured |
|
Max Buy |
COO
-
NYSE
Cooper Companies Inc
HEALTH SERVICES - Medical Instruments and Supplies
|
$87.78
|
-0.45
-0.51% |
$88.35
|
483,616
110.39% of 50 DAV
50 DAV is 438,100
|
$89.23
-1.63%
|
3/9/2012
|
$83.05
|
PP = $81.02
|
|
MB = $85.07
|
Most Recent Note - 5/2/2012 4:09:51 PM
G - Small loss today with average volume conviction while trading at its 52-week and all-time highs above its "max buy" level. It is extended from its prior base. Prior highs in the $83-84 area define near-term support above its 50 DMA line.
>>> The latest Featured Stock Update with an annotated graph appeared on 3/9/2012. Click here.
View all notes |
Alert me of new notes |
CANSLIM.net Company Profile |
SEC |
Zacks Reports |
StockTalk |
News |
Chart |
Request a new note
C
A N
S L
I M
|
DISH
-
NASDAQ
Dish Network Corp Cl A
CONSUMER DURABLES - Electronic Equipment
|
$32.13
|
+0.15
0.47% |
$32.38
|
1,652,425
66.18% of 50 DAV
50 DAV is 2,497,000
|
$35.64
-9.85%
|
3/7/2012
|
$30.83
|
PP = $30.10
|
|
MB = $31.61
|
Most Recent Note - 5/2/2012 4:14:10 PM
G - Today's gain on light volume helped it again bounce from important support at its 50 DMA line. Continued support near that important short-term average would help its outlook, but deterioration below the 50 DMA or below recent lows ($29.93 on 4/18/12) would raise more serious concerns. Due to report its latest earnings on Monday, May 7, 2012.
>>> The latest Featured Stock Update with an annotated graph appeared on 3/14/2012. Click here.
View all notes |
Alert me of new notes |
CANSLIM.net Company Profile |
SEC |
Zacks Reports |
StockTalk |
News |
Chart |
Request a new note
C
A N
S L
I M
|
EXPE
-
NASDAQ
Expedia Inc
INTERNET - Internet Information Providers
|
$42.45
|
+0.81
1.95% |
$42.73
|
4,090,908
98.30% of 50 DAV
50 DAV is 4,161,700
|
$43.92
-3.35%
|
4/27/2012
|
$41.80
|
PP = $35.57
|
|
MB = $37.35
|
Most Recent Note - 5/1/2012 12:10:17 PM
G - Color code was changed to green after getting extended from its prior base with consecutive volume-driven gains. EXPE was highlighted in yellow in the 4/27/12 mid-day breakouts report (read here) when its considerable "breakaway gap" up above the pivot point cited based on its 3/26/12 high plus 10 cents. Reported earnings +63% on +12% sales revenues for the quarter ended March 31, 2012 versus the year ago period. Quarterly earnings have been above the +25% minimum guideline in 3 of the past 4 comparisons and its annual earnings (A criteria) history has been good.
There are no Featured Stock Updates™ available for this stock at this time. You may request one by clicking the Request a New Note link below
View all notes |
Alert me of new notes |
CANSLIM.net Company Profile |
SEC |
Zacks Reports |
StockTalk |
News |
Chart |
Request a new note
C
A N
S L
I M
|
FEIC
-
NASDAQ
F E I Co
ELECTRONICS - Diversified Electronics
|
$51.97
|
+1.18
2.32% |
$52.01
|
1,076,569
355.19% of 50 DAV
50 DAV is 303,100
|
$51.34
1.23%
|
12/7/2011
|
$41.41
|
PP = $42.35
|
|
MB = $44.47
|
Most Recent Note - 5/2/2012 12:38:04 PM
G - Rebounding quickly from the session's earlier lows. It traded down considerably today after reporting earnings +17% on +10% sales revenues for the quarter ended March 31, 2012 versus the year ago period, marking a second consecutive quarter below the +25% minimum guideline for earnings growth. Disciplined investors make sell decisions based upon technical action alone, whereas buy decisions are to be made only when both fundamental and technical criteria met.
>>> The latest Featured Stock Update with an annotated graph appeared on 3/12/2012. Click here.
View all notes |
Alert me of new notes |
CANSLIM.net Company Profile |
SEC |
Zacks Reports |
StockTalk |
News |
Chart |
Request a new note
C
A N
S L
I M
|
GNC
-
NYSE
G N C Holdings Inc
RETAIL - Drug Stores
|
$39.30
|
+0.77
2.00% |
$39.62
|
1,553,003
82.17% of 50 DAV
50 DAV is 1,890,100
|
$41.95
-6.32%
|
1/19/2012
|
$28.99
|
PP = $29.60
|
|
MB = $31.08
|
Most Recent Note - 4/30/2012 10:02:36 AM
G - Gapped down today, retreating from its all-time high. Reported earnings +82% on +23% sales revenues for the quarter ended March 31, 2012 versus the year ago period. See the latest FSU analysis for more details and a new annotated graph.
>>> The latest Featured Stock Update with an annotated graph appeared on 4/26/2012. Click here.
View all notes |
Alert me of new notes |
CANSLIM.net Company Profile |
SEC |
Zacks Reports |
StockTalk |
News |
Chart |
Request a new note
C
A N
S L
I M
|
Symbol/Exchange
Company Name
Industry Group |
PRICE |
CHANGE
(%Change) |
Day High |
Volume
(% DAV)
(% 50 day avg vol) |
52 Wk Hi
% From Hi |
Featured
Date |
Price
Featured |
Pivot Featured |
|
Max Buy |
ISRG
-
NASDAQ
Intuitive Surgical Inc
HEALTH SERVICES - Medical Appliances and Equipment
|
$586.16
|
-2.12
-0.36% |
$591.64
|
179,380
64.29% of 50 DAV
50 DAV is 279,000
|
$594.89
-1.47%
|
12/20/2011
|
$442.43
|
PP = $449.16
|
|
MB = $471.62
|
Most Recent Note - 4/26/2012 4:05:31 PM
G - Hovering near its all-time high with volume totals cooling since a considerable gap up gain on 4/18/12. It may produce more climactic gains, however it has not spent much time basing since its last "Featured Date" when highlighted in yellow on 12/23/11. Disciplined investors always limit losses if any stock falls -7% from their purchase price. It is on track for an 11th consecutive weekly gain.
>>> The latest Featured Stock Update with an annotated graph appeared on 3/1/2012. Click here.
View all notes |
Alert me of new notes |
CANSLIM.net Company Profile |
SEC |
Zacks Reports |
StockTalk |
News |
Chart |
Request a new note
C
A N
S L
I M
|
JAZZ
-
NASDAQ
Jazz Pharmaceuticals Plc
DRUGS - Biotechnology
|
$51.51
|
+0.51
1.00% |
$51.57
|
724,020
70.80% of 50 DAV
50 DAV is 1,022,600
|
$54.50
-5.49%
|
4/27/2012
|
$51.93
|
PP = $51.39
|
|
MB = $53.96
|
Most Recent Note - 4/27/2012 6:07:32 PM
Y - Considerable gap up gain today backed by 4 times average volume, rising from a "double bottom" base and touching a new all-time high. Color code was changed to yellow and pivot point cited is based on its 4/10/12 high in the mid-day report. See the latest FSU analysis for more details and a new annotated graph.
>>> The latest Featured Stock Update with an annotated graph appeared on 4/27/2012. Click here.
View all notes |
Alert me of new notes |
CANSLIM.net Company Profile |
SEC |
Zacks Reports |
StockTalk |
News |
Chart |
Request a new note
C
A N
S L
I M
|
LULU
-
NASDAQ
Lululemon Athletica
MANUFACTURING - Textile Manufacturing
|
$79.43
|
+3.38
4.44% |
$79.90
|
3,831,643
191.06% of 50 DAV
50 DAV is 2,005,500
|
$77.13
2.98%
|
5/1/2012
|
$76.05
|
PP = $77.23
|
|
MB = $81.09
|
Most Recent Note - 5/2/2012 1:00:46 PM
Y - Recently found prompt support at its 50 DMA line. Volume is running at an above average pace today as it is hitting a new high. Gains backed by at least +40% above average volume while rising above the new pivot point cited based on its 4/05/12 high plus 10 cents may trigger a proper new (or add-on) technical buy signal.
>>> The latest Featured Stock Update with an annotated graph appeared on 4/12/2012. Click here.
View all notes |
Alert me of new notes |
CANSLIM.net Company Profile |
SEC |
Zacks Reports |
StockTalk |
News |
Chart |
Request a new note
C
A N
S L
I M
|
MA
-
NYSE
Mastercard Inc Cl A
DIVERSIFIED SERVICES - Business/Management Services
|
$451.45
|
-4.45
-0.98% |
$458.20
|
2,163,962
251.19% of 50 DAV
50 DAV is 861,500
|
$466.98
-3.33%
|
3/12/2012
|
$419.86
|
PP = $428.67
|
|
MB = $450.10
|
Most Recent Note - 5/2/2012 1:02:25 PM
G - It is extended from a sound base and churning heavy volume at its 52-week and all-time highs this week. Last week it found support at its 50 DMA line.
>>> The latest Featured Stock Update with an annotated graph appeared on 4/11/2012. Click here.
View all notes |
Alert me of new notes |
CANSLIM.net Company Profile |
SEC |
Zacks Reports |
StockTalk |
News |
Chart |
Request a new note
C
A N
S L
I M
|
MELI
-
NASDAQ
Mercadolibre Inc
INTERNET - Internet Software and; Services
|
$97.61
|
-1.73
-1.74% |
$99.09
|
637,038
134.03% of 50 DAV
50 DAV is 475,300
|
$104.50
-6.59%
|
5/1/2012
|
$99.34
|
PP = $102.98
|
|
MB = $108.13
|
Most Recent Note - 5/1/2012 6:55:15 PM
Y - Volume-driven gains helped it rebound above its 50 DMA line, improving its technical stance. A new pivot point is cited based on its 3/27/12 high after forming a "double bottom" base. There is limited resistance due to overhead supply up through the $104 level.
>>> The latest Featured Stock Update with an annotated graph appeared on 3/29/2012. Click here.
View all notes |
Alert me of new notes |
CANSLIM.net Company Profile |
SEC |
Zacks Reports |
StockTalk |
News |
Chart |
Request a new note
C
A N
S L
I M
|
Symbol/Exchange
Company Name
Industry Group |
PRICE |
CHANGE
(%Change) |
Day High |
Volume
(% DAV)
(% 50 day avg vol) |
52 Wk Hi
% From Hi |
Featured
Date |
Price
Featured |
Pivot Featured |
|
Max Buy |
MG
-
NYSE
Mistras Group Inc
DIVERSIFIED SERVICES - Bulding and Faci;ity Management Services
|
$23.38
|
+0.31
1.34% |
$23.51
|
63,639
65.81% of 50 DAV
50 DAV is 96,700
|
$26.24
-10.90%
|
3/22/2012
|
$24.96
|
PP = $26.34
|
|
MB = $27.66
|
Most Recent Note - 4/30/2012 5:25:10 PM
G - Encountered distributional pressure today after a gap up, negatively reversing and closing near its 50 DMA line. The recent low ($22.60 on 4/19/12) defines the next near-term support above its 200 DMA line. Previously noted - "A volume-driven gain above its recent chart high ($25.49 on 3/21/12) may help trigger a proper technical buy signal after a new base formation, however no new (lower) pivot point is currently being cited, and it may continue encountering stubborn resistance."
>>> The latest Featured Stock Update with an annotated graph appeared on 4/2/2012. Click here.
View all notes |
Alert me of new notes |
CANSLIM.net Company Profile |
SEC |
Zacks Reports |
StockTalk |
News |
Chart |
Request a new note
C
A N
S L
I M
|
MKTX
-
NASDAQ
Marketaxess Holdings Inc
FINANCIAL SERVICES - Investment Brokerage - Nationa
|
$33.69
|
-0.75
-2.18% |
$34.11
|
363,701
111.63% of 50 DAV
50 DAV is 325,800
|
$37.95
-11.23%
|
3/8/2012
|
$35.80
|
PP = $35.52
|
|
MB = $37.30
|
Most Recent Note - 5/2/2012 3:51:07 PM
G - Volume has not been above average behind any of its gains since 3/22/12. Down again today, sinking -11% off its 52-week high, and slumping further below its 50 DMA line and below its pivot point.
>>> The latest Featured Stock Update with an annotated graph appeared on 3/8/2012. Click here.
View all notes |
Alert me of new notes |
CANSLIM.net Company Profile |
SEC |
Zacks Reports |
StockTalk |
News |
Chart |
Request a new note
C
A N
S L
I M
|
NTES
-
NASDAQ
Netease Inc Adr
INTERNET - Internet Information Providers
|
$60.16
|
+0.20
0.33% |
$60.35
|
460,744
71.11% of 50 DAV
50 DAV is 647,900
|
$61.45
-2.10%
|
3/19/2012
|
$56.18
|
PP = $55.10
|
|
MB = $57.86
|
Most Recent Note - 4/30/2012 5:46:43 PM
G - Overcame early weakness today and finished near the session high with a small gain for its second-best close ever. Recent lows and its 50 DMA line define support to watch in the $55 area.
>>> The latest Featured Stock Update with an annotated graph appeared on 3/27/2012. Click here.
View all notes |
Alert me of new notes |
CANSLIM.net Company Profile |
SEC |
Zacks Reports |
StockTalk |
News |
Chart |
Request a new note
C
A N
S L
I M
|
PCLN
-
NASDAQ
Priceline.Com Inc
INTERNET - Internet Software and Services
|
$761.06
|
+5.89
0.78% |
$762.40
|
1,129,288
94.48% of 50 DAV
50 DAV is 1,195,300
|
$774.96
-1.79%
|
4/27/2012
|
$539.46
|
PP = $774.96
|
|
MB = $813.71
|
Most Recent Note - 4/27/2012 12:53:39 PM
Y - Gapped up today, rallying from support at its 50 DMA line to within close striking distance of its 52-week high. Color code is changed to yellow while rallying from its first test of its 10-week moving average (WMA) since breaking out above resistance in the $554 area in February. In the Certification they teach that after an earlier breakout a secondary buy point exists between the first successful test of the 10 WMA up to +5% above its latest high. The 2-week consolidation is not considered a sound base pattern, yet the pivot point cited is based on that recent high. Prior mid-day reports noted - "Technically, it broke out on 2/13/12 with a volume-driven gain, and now it is getting extended from its prior base. Fundamentals have remained strong since dropped from the Featured Stocks list on 9/29/11. Patient investors may watch for secondary buy points to possibly develop and be noted."
>>> The latest Featured Stock Update with an annotated graph appeared on 9/22/2011. Click here.
View all notes |
Alert me of new notes |
CANSLIM.net Company Profile |
SEC |
Zacks Reports |
StockTalk |
News |
Chart |
Request a new note
C
A N
S L
I M
|
RAX
-
NYSE
Rackspace Hosting Inc
INTERNET - Internet Software and; Services
|
$58.78
|
+0.23
0.39% |
$59.25
|
1,137,795
67.27% of 50 DAV
50 DAV is 1,691,400
|
$60.00
-2.03%
|
4/26/2012
|
$58.39
|
PP = $59.53
|
|
MB = $62.51
|
Most Recent Note - 5/1/2012 7:00:46 PM
Y - Holding its ground within close striking distance of its 52-week high. Color code was recently changed to yellow with new pivot point cited based on its 3/27/12 high plus 10 cents following a 5-week consolidation. Volume-driven gains for new highs may trigger a new (or add-on) technical buy signal.
>>> The latest Featured Stock Update with an annotated graph appeared on 4/10/2012. Click here.
View all notes |
Alert me of new notes |
CANSLIM.net Company Profile |
SEC |
Zacks Reports |
StockTalk |
News |
Chart |
Request a new note
C
A N
S L
I M
|
Symbol/Exchange
Company Name
Industry Group |
PRICE |
CHANGE
(%Change) |
Day High |
Volume
(% DAV)
(% 50 day avg vol) |
52 Wk Hi
% From Hi |
Featured
Date |
Price
Featured |
Pivot Featured |
|
Max Buy |
RGR
-
NYSE
Sturm Ruger & Co Inc
CONSUMER DURABLES - Sporting Goods
|
$57.55
|
+2.41
4.37% |
$58.19
|
1,577,125
342.04% of 50 DAV
50 DAV is 461,100
|
$58.42
-1.49%
|
3/22/2012
|
$46.49
|
PP = $46.78
|
|
MB = $49.12
|
Most Recent Note - 5/2/2012 1:10:51 PM
G - Churning heavy volume yet holding its ground this week. It has been repeatedly noted - "Extended from any sound base and the 50 DMA line defines support to watch on pullbacks."
>>> The latest Featured Stock Update with an annotated graph appeared on 3/22/2012. Click here.
View all notes |
Alert me of new notes |
CANSLIM.net Company Profile |
SEC |
Zacks Reports |
StockTalk |
News |
Chart |
Request a new note
C
A N
S L
I M
|
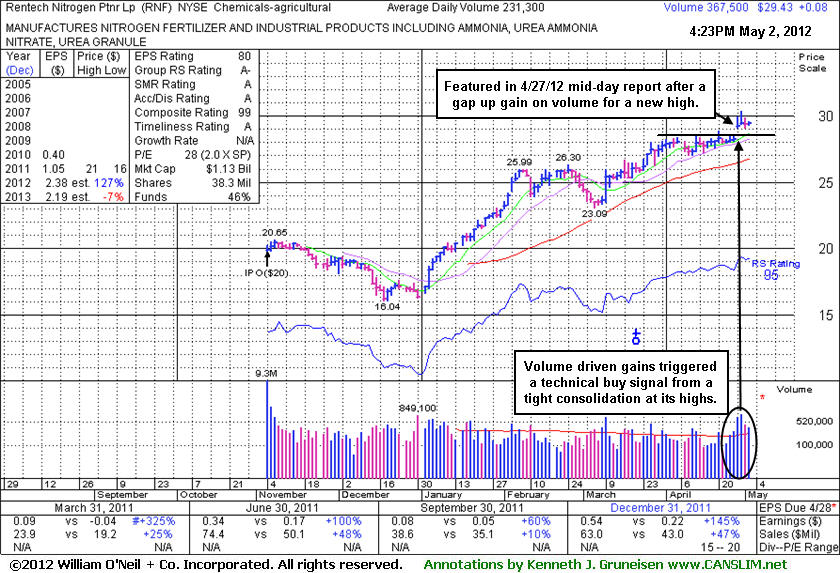
RNF
-
NYSE
Rentech Nitrogen Ptnr Lp
CHEMICALS - Agricultural Chemicals
|
$29.43
|
+0.08
0.27% |
$29.57
|
367,563
158.91% of 50 DAV
50 DAV is 231,300
|
$30.39
-3.17%
|
4/27/2012
|
$29.32
|
PP = $28.60
|
|
MB = $30.03
|
Most Recent Note - 5/2/2012 4:47:04 PM
Y - Is hovering near its 52-week high since highlighted in yellow in the 4/27/12 mid-day breakouts report (read here) when it gapped up above the pivot point cited based on its 4/12/12 high plus 10 cents. Reporting earnings on Friday, May 11, 2012. See the latest FSU analysis for more details and a new annotated graph.
>>> The latest Featured Stock Update with an annotated graph appeared on 5/2/2012. Click here.
View all notes |
Alert me of new notes |
CANSLIM.net Company Profile |
SEC |
Zacks Reports |
StockTalk |
News |
Chart |
Request a new note
C
A N
S L
I M
|
RRTS
-
NYSE
Roadrunner Trans Systems
TRANSPORTATION - Air Delivery and Freight Service
|
$17.42
|
+0.02
0.11% |
$17.44
|
157,040
163.24% of 50 DAV
50 DAV is 96,200
|
$18.59
-6.29%
|
2/10/2012
|
$17.40
|
PP = $17.50
|
|
MB = $18.38
|
Most Recent Note - 4/30/2012 5:31:03 PM
G - Up today with heavy volume, rising toward its 50 DMA line which recently acted as resistance. Subsequent deterioration below the prior low ($16.65 on 4/10/12) would raise more serious concerns and trigger more worrisome sell signals.
>>> The latest Featured Stock Update with an annotated graph appeared on 4/9/2012. Click here.
View all notes |
Alert me of new notes |
CANSLIM.net Company Profile |
SEC |
Zacks Reports |
StockTalk |
News |
Chart |
Request a new note
C
A N
S L
I M
|
SHFL
-
NASDAQ
Shuffle Master Inc
MANUFACTURING - Diversified Machinery
|
$17.62
|
+0.47
2.74% |
$17.68
|
561,192
83.15% of 50 DAV
50 DAV is 674,900
|
$18.77
-6.13%
|
3/6/2012
|
$17.07
|
PP = $15.25
|
|
MB = $16.01
|
Most Recent Note - 5/2/2012 4:02:01 PM
G - Rebounded from lows near its 50 DMA and managed a positive reversal today. Its consolidation is not a sufficient length to be considered a sound new base pattern. It already has tested support at its 10-week moving average line multiple times this year, so it may not be considered an ideal "secondary buy point" now.
>>> The latest Featured Stock Update with an annotated graph appeared on 3/15/2012. Click here.
View all notes |
Alert me of new notes |
CANSLIM.net Company Profile |
SEC |
Zacks Reports |
StockTalk |
News |
Chart |
Request a new note
C
A N
S L
I M
|
SHOO
-
NASDAQ
Steven Madden Limited
CONSUMER NON-DURABLES - Textile - Apparel Footwear
|
$44.27
|
+1.07
2.48% |
$45.00
|
626,053
180.73% of 50 DAV
50 DAV is 346,400
|
$45.70
-3.13%
|
4/27/2012
|
$43.20
|
PP = $45.32
|
|
MB = $47.59
|
Most Recent Note - 5/2/2012 4:00:16 PM
Y - Up today with lighter but above average volume, rising near its pivot point and 52-week high. Due to report earnings on Thursday, may 3rd. Color code was changed to yellow with pivot point cited based on its 3/26/12 high while it is still working on a "double bottom" base pattern. Sales revenues showed impressive acceleration in the Jun, Sep, and Dec '11 quarterly comparisons with earnings increases above the +25% minimum guideline in the 2 latest comparisons. Subsequent volume-driven gains above the pivot point may trigger a technical buy signal, meanwhile it is ideal for investors' watchlists.
>>> The latest Featured Stock Update with an annotated graph appeared on 1/4/2011. Click here.
View all notes |
Alert me of new notes |
CANSLIM.net Company Profile |
SEC |
Zacks Reports |
StockTalk |
News |
Chart |
Request a new note
C
A N
S L
I M
|
Symbol/Exchange
Company Name
Industry Group |
PRICE |
CHANGE
(%Change) |
Day High |
Volume
(% DAV)
(% 50 day avg vol) |
52 Wk Hi
% From Hi |
Featured
Date |
Price
Featured |
Pivot Featured |
|
Max Buy |
SWI
-
NYSE
Solarwinds Inc
COMPUTER SOFTWARE and SERVICES - Application Software
|
$46.96
|
+0.27
0.58% |
$47.42
|
828,411
75.72% of 50 DAV
50 DAV is 1,094,100
|
$47.66
-1.47%
|
4/26/2012
|
$45.15
|
PP = $42.32
|
|
MB = $44.44
|
Most Recent Note - 4/27/2012 6:58:59 PM
G - Color code is changed to green after getting more extended from its prior highs with today's 3rd consecutive volume-driven gain. The volume-driven gain to new highs triggered a new buy signal on 4/26/12 as it was featured in the mid-day report and noted - "Reported earnings +43% on +39% sales revenues for the quarter ended March 31, 2012 versus the year ago period. It held its ground stubbornly after violating its 50 DMA line when a damaging loss with above average volume triggered technical sell signals on 4/10/12 and it was dropped from the Featured Stocks list. Earnings below the +25% guideline for the Dec '11 quarter (+21%) had also raised fundamental concerns at that time, however the stock's resilience and impressive acceleration means that 3 of the past 4 quarterly comparisons are now above the minimum guideline concerning the C criteria. Its annual earnings (A criteria) history has been strong."
>>> The latest Featured Stock Update with an annotated graph appeared on 3/16/2012. Click here.
View all notes |
Alert me of new notes |
CANSLIM.net Company Profile |
SEC |
Zacks Reports |
StockTalk |
News |
Chart |
Request a new note
C
A N
S L
I M
|
SXCI
-
NASDAQ
S X C Health Solutions
COMPUTER SOFTWARE and SERVICES - Healthcare Information Service
|
$95.84
|
+4.62
5.06% |
$96.49
|
1,528,629
165.28% of 50 DAV
50 DAV is 924,900
|
$100.50
-4.64%
|
2/23/2012
|
$68.24
|
PP = $66.05
|
|
MB = $69.35
|
Most Recent Note - 5/2/2012 10:36:53 AM
G - Rising within close striking distance of its best-ever close with today's early gains. Due to report financial results on Thursday (tomorrow) before the open. Volume and volatility often increase near earnings news. It is extended from its prior base.
>>> The latest Featured Stock Update with an annotated graph appeared on 3/6/2012. Click here.
View all notes |
Alert me of new notes |
CANSLIM.net Company Profile |
SEC |
Zacks Reports |
StockTalk |
News |
Chart |
Request a new note
C
A N
S L
I M
|
TDG
-
NYSE
Transdigm Group Inc
AEROSPACE/DEFENSE - Aerospace/Defense Products and; Services
|
$127.83
|
+0.76
0.60% |
$128.20
|
686,737
165.56% of 50 DAV
50 DAV is 414,800
|
$128.29
-0.36%
|
2/29/2012
|
$120.10
|
PP = $118.93
|
|
MB = $124.88
|
Most Recent Note - 5/1/2012 6:52:02 PM
G - Color code is changed to green after rallying beyond its "max buy" level with above average volume behind its 4th gain in the span of 5 sessions. Prior highs in the $118-121 area define initial chart support to watch on pullbacks.
>>> The latest Featured Stock Update with an annotated graph appeared on 3/30/2012. Click here.
View all notes |
Alert me of new notes |
CANSLIM.net Company Profile |
SEC |
Zacks Reports |
StockTalk |
News |
Chart |
Request a new note
C
A N
S L
I M
|
TIBX
-
NASDAQ
Tibco Software Inc
COMPUTER SOFTWARE and SERVICES - Business Software and Services
|
$33.62
|
+0.59
1.77% |
$33.79
|
1,977,180
67.79% of 50 DAV
50 DAV is 2,916,700
|
$34.67
-3.04%
|
3/30/2012
|
$31.01
|
PP = $31.25
|
|
MB = $32.81
|
Most Recent Note - 4/26/2012 4:01:26 PM
G - Up today for a 2nd consecutive gain on lighter volume. Traded under its "max buy" level this week yet found support above prior highs in the $31 area and its 50 DMA line. More damaging losses would raise serious concerns.
>>> The latest Featured Stock Update with an annotated graph appeared on 4/5/2012. Click here.
View all notes |
Alert me of new notes |
CANSLIM.net Company Profile |
SEC |
Zacks Reports |
StockTalk |
News |
Chart |
Request a new note
C
A N
S L
I M
|
TNGO
-
NASDAQ
Tangoe Inc
COMPUTER SOFTWARE and SERVICES - Technical and System Software
|
$21.31
|
-0.04
-0.19% |
$21.55
|
455,341
76.30% of 50 DAV
50 DAV is 596,800
|
$21.74
-1.98%
|
3/27/2012
|
$19.35
|
PP = $20.00
|
|
MB = $21.00
|
Most Recent Note - 5/1/2012 6:17:37 PM
G - Up today on light volume, closing above its "max buy" level and its color code is changed to green. Recently found support near prior highs in the $20 area previously noted as initial support to watch on pullbacks following its 4/19/12 breakout. The 50 DMA line defines important support to watch.
>>> The latest Featured Stock Update with an annotated graph appeared on 4/3/2012. Click here.
View all notes |
Alert me of new notes |
CANSLIM.net Company Profile |
SEC |
Zacks Reports |
StockTalk |
News |
Chart |
Request a new note
C
A N
S L
I M
|
Symbol/Exchange
Company Name
Industry Group |
PRICE |
CHANGE
(%Change) |
Day High |
Volume
(% DAV)
(% 50 day avg vol) |
52 Wk Hi
% From Hi |
Featured
Date |
Price
Featured |
Pivot Featured |
|
Max Buy |
TSCO
-
NASDAQ
Tractor Supply Co
SPECIALTY RETAIL - Specialty Retail, Other
|
$99.77
|
+1.39
1.41% |
$100.75
|
832,348
108.39% of 50 DAV
50 DAV is 767,900
|
$101.20
-1.41%
|
5/1/2012
|
$98.38
|
PP = $101.30
|
|
MB = $106.37
|
Most Recent Note - 5/1/2012 6:20:55 PM
Y - Color code is changed to yellow with new pivot point cited based on its 4/19/12 high plus 10 cents after forming an advanced "3-weeks tight" base pattern. Volume-driven gains to new highs may trigger a new (or add-on) technical buy signal. Its 50 DMA line defines support to watch on pullbacks.
>>> The latest Featured Stock Update with an annotated graph appeared on 4/17/2012. Click here.
View all notes |
Alert me of new notes |
CANSLIM.net Company Profile |
SEC |
Zacks Reports |
StockTalk |
News |
Chart |
Request a new note
C
A N
S L
I M
|
UA
-
NYSE
Under Armour Inc Cl A
CONSUMER NON-DURABLES - Textile - Apparel Clothing
|
$101.11
|
+2.80
2.85% |
$101.77
|
917,147
95.49% of 50 DAV
50 DAV is 960,500
|
$102.86
-1.70%
|
2/15/2012
|
$85.77
|
PP = $84.86
|
|
MB = $89.10
|
Most Recent Note - 5/1/2012 6:23:25 PM
G - Remains perched above its 50 DMA line very near its all-time high. No overhead supply remains to act as resistance, however no new pivot point was cited following its latest base. Concerns were raised by weaker fundamentals. Reported earnings +22% on +23% sales revenues for the quarter ended March 31, 2012 versus the year ago period, its first quarterly earnings increase below the +25% minimum guideline in more than 2 years.
>>> The latest Featured Stock Update with an annotated graph appeared on 4/4/2012. Click here.
View all notes |
Alert me of new notes |
CANSLIM.net Company Profile |
SEC |
Zacks Reports |
StockTalk |
News |
Chart |
Request a new note
C
A N
S L
I M
|
UBNT
-
NASDAQ
Ubiquiti Networks Inc
TELECOMMUNICATIONS - Diversified Communication Serv
|
$28.90
|
-6.10
-17.43% |
$33.18
|
4,060,399
1,018.67% of 50 DAV
50 DAV is 398,600
|
$35.99
-19.70%
|
4/12/2012
|
$33.89
|
PP = $34.07
|
|
MB = $35.77
|
Most Recent Note - 5/2/2012 3:56:32 PM
G - Reported earnings +100% on +79% sales revenues for the quarter ended March 31, 2012 versus the year ago period. Gapped down today and violated its recent lows then quickly undercut its 50 DMA line, raising concerns and triggering a technical sell signal with its largest point loss on the highest volume ever. The prior gain backed by more than 3 times average volume had confirmed a technical buy signal as it rallied from an advanced "ascending base" pattern. Volume and volatility often increase near earnings news.
>>> The latest Featured Stock Update with an annotated graph appeared on 4/20/2012. Click here.
View all notes |
Alert me of new notes |
CANSLIM.net Company Profile |
SEC |
Zacks Reports |
StockTalk |
News |
Chart |
Request a new note
C
A N
S L
I M
|
ULTA
-
NASDAQ
Ulta Salon Cosm & Frag
SPECIALTY RETAIL - Specialty Retail, Other
|
$91.33
|
+2.25
2.53% |
$91.49
|
572,153
83.70% of 50 DAV
50 DAV is 683,600
|
$96.65
-5.50%
|
1/11/2012
|
$71.97
|
PP = $75.80
|
|
MB = $79.59
|
Most Recent Note - 5/1/2012 6:28:53 PM
G - After its damaging loss violating its 50 DMA line on 4/24/12 raised concerns and triggered a technical sell signal that short-term average has been acting as resistance. Prior highs in the $75 area are the next important support level to watch.
>>> The latest Featured Stock Update with an annotated graph appeared on 4/23/2012. Click here.
View all notes |
Alert me of new notes |
CANSLIM.net Company Profile |
SEC |
Zacks Reports |
StockTalk |
News |
Chart |
Request a new note
C
A N
S L
I M
|
V
-
NYSE
Visa Inc Cl A
DIVERSIFIED SERVICES - Business/Management Services
|
$122.19
|
-0.90
-0.73% |
$123.19
|
6,078,594
199.72% of 50 DAV
50 DAV is 3,043,600
|
$125.35
-2.52%
|
3/12/2012
|
$116.53
|
PP = $119.46
|
|
MB = $125.43
|
Most Recent Note - 4/26/2012 4:07:37 PM
Y - Gain today on light volume helped it finish a penny below its best-ever close. Found support near its 50 DMA line this week. Sputtering since its 4/13/12 gain backed by +49% above average volume technically confirmed a buy signal. Its 50 DMA line defines support to watch well above prior highs in the $103-104 area.
>>> The latest Featured Stock Update with an annotated graph appeared on 3/7/2012. Click here.
View all notes |
Alert me of new notes |
CANSLIM.net Company Profile |
SEC |
Zacks Reports |
StockTalk |
News |
Chart |
Request a new note
C
A N
S L
I M
|
Symbol/Exchange
Company Name
Industry Group |
PRICE |
CHANGE
(%Change) |
Day High |
Volume
(% DAV)
(% 50 day avg vol) |
52 Wk Hi
% From Hi |
Featured
Date |
Price
Featured |
Pivot Featured |
|
Max Buy |
VMW
-
NYSE
Vmware Inc Cl A
COMPUTER SOFTWARE andamp; SERVICES - Technical andamp; System Software
|
$114.62
|
+1.99
1.77% |
$115.00
|
1,379,314
87.18% of 50 DAV
50 DAV is 1,582,100
|
$118.79
-3.51%
|
4/18/2012
|
$110.04
|
PP = $115.29
|
|
MB = $121.05
|
Most Recent Note - 4/26/2012 3:40:08 PM
Y - Color code is changed to yellow after promptly repairing a brief 50 DMA line breach, technically showing signs it attracted institutional support near that important short-term average. Reported +38% earnings on +25% sales revenues for the quarter ended March 31, 2012 versus the year ago period.
>>> The latest Featured Stock Update with an annotated graph appeared on 4/18/2012. Click here.
View all notes |
Alert me of new notes |
CANSLIM.net Company Profile |
SEC |
Zacks Reports |
StockTalk |
News |
Chart |
Request a new note
C
A N
S L
I M
|
VSI
-
NYSE
Vitamin Shoppe Inc
SPECIALTY RETAIL - Specialty Retail, Other
|
$47.25
|
+1.35
2.94% |
$47.42
|
483,992
141.31% of 50 DAV
50 DAV is 342,500
|
$49.05
-3.67%
|
4/25/2012
|
$47.77
|
PP = $48.46
|
|
MB = $50.88
|
Most Recent Note - 5/1/2012 6:46:46 PM
Y - Encountered more damaging distributional pressure and finished near the session low today with volume more than 2 times average as it retreated from its 52-week high and pivot point. Did not trigger a technical buy signal since last week when its color code was changed to yellow with pivot point based on its 7/05/11 high after a near 10-month cup shaped base.
>>> The latest Featured Stock Update with an annotated graph appeared on 4/25/2012. Click here.
View all notes |
Alert me of new notes |
CANSLIM.net Company Profile |
SEC |
Zacks Reports |
StockTalk |
News |
Chart |
Request a new note
C
A N
S L
I M
|