You are not logged in.
This means you
CAN ONLY VIEW reports that were published prior to Monday, April 14, 2025.
You
MUST UPGRADE YOUR MEMBERSHIP if you want to see any current reports.
AFTER MARKET UPDATE - MONDAY, MAY 2ND, 2011
Previous After Market Report Next After Market Report >>>
|
|
|
|
DOW |
-3.18 |
12,807.36 |
-0.02% |
|
Volume |
935,263,830 |
-4% |
|
Volume |
2,017,992,400 |
-15% |
|
NASDAQ |
-9.46 |
2,864.08 |
-0.33% |
|
Advancers |
1,236 |
39% |
|
Advancers |
840 |
31% |
|
S&P 500 |
-2.39 |
1,361.22 |
-0.18% |
|
Decliners |
1,779 |
57% |
|
Decliners |
1,820 |
66% |
|
Russell 2000 |
-10.52 |
854.77 |
-1.22% |
|
52 Wk Highs |
337 |
|
|
52 Wk Highs |
177 |
|
|
S&P 600 |
-3.97 |
453.98 |
-0.87% |
|
52 Wk Lows |
13 |
|
|
52 Wk Lows |
28 |
|
|
 |
US Dollar Strengthened and Early Gains Faded
Kenneth J. Gruneisen - Passed the CAN SLIM® Master's Exam
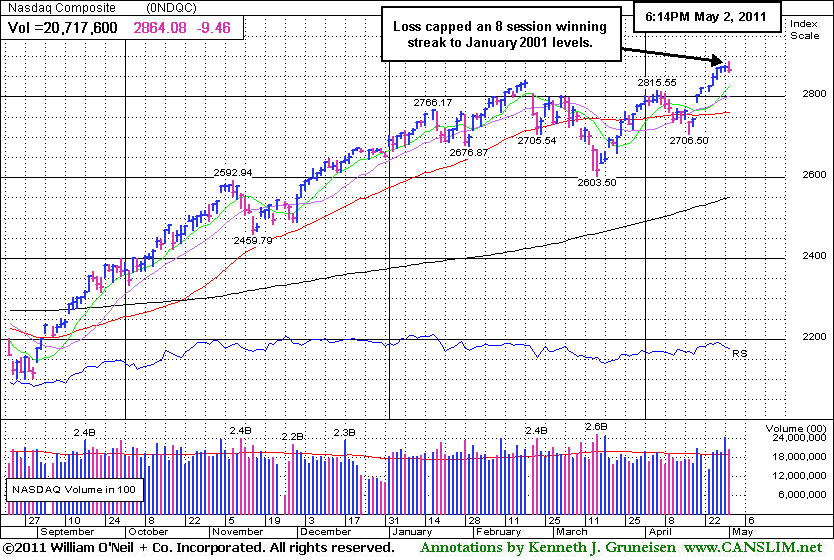
After a fast start, the stock market drifted steadily to the downside and the major averages closed slightly lower on Monday. Volume totals were reported lighter than the prior session totals on both major stock exchanges. Declining issues beat advancers by 4-3 on the NYSE and by 2-1 on the Nasdaq. New 52-week highs solidly outnumbered new 52-week lows on the NYSE and on the Nasdaq exchange. There were 86 high-ranked companies from the CANSLIM.net Leaders List that made new 52-week highs and appeared on the CANSLIM.net BreakOuts Page, down from the total of 101 on the prior session. On the Featured Stocks Page there were gains from only 5 of the 19 high-ranked market leaders currently listed. New set-ups with strong characteristics and fresh breakouts from high-ranked leaders have been scarce in recent weeks, even while the major averages have rallied.
Energy, technology and financial companies pulled back while many speculated on possible retaliation by extremists to news of Osama bin Laden's death in a fire-fight in Pakistan. Economic reports signaled a very modest recovery. The ISM April manufacturing index showed a smaller expansion compared to March, while construction spending in March rose 1.4%, above expectations.
Merger news gave the market an early lift. Teva Pharmaceutical Industries (TEVA +3.4%) said it will buy Cephalon inc (CEPH +4%) for $6.8 billion. That deal helped boost the drug sector. Meanwhile, Arch Coal Inc (ACI -2.2%) will buy International Coal Group Inc (ICO +30.74%) for $3.4 billion to become the second-largest U.S. coal producer.
Pundits also said that valuations are an increasing concern, after last week's rally lifted the benchmark S&P 500 Index close to a three-year high. On Wednesday last week the Nasdaq Composite Index topped its October 2007 high. The S&P Mid-Cap 400 Index and S&P Small-Cap 600 Index both are at all-time highs.
Be ready for the May 2011 issue of CANSLIM.net News to be released soon! CANSLIM.net News includes a comprehensive summary of market action, leading industry groups, the most action-worthy leaders, and more. Only upgraded members can access CANSLIM.net News.
PICTURED: The Nasdaq Composite Index's loss today broke a streak of 8 consecutive gains after last week it rallied above its October 31, 2007 high to levels not seen since January 2001.
|
 Kenneth J. Gruneisen started out as a licensed stockbroker in August 1987, a couple of months prior to the historic stock market crash that took the Dow Jones Industrial Average down -22.6% in a single day. He has published daily fact-based fundamental and technical analysis on high-ranked stocks online for two decades. Through FACTBASEDINVESTING.COM, Kenneth provides educational articles, news, market commentary, and other information regarding proven investment systems that work in good times and bad.
Comments contained in the body of this report are technical opinions only and are not necessarily those of Gruneisen Growth Corp. The material herein has been obtained from sources believed to be reliable and accurate, however, its accuracy and completeness cannot be guaranteed. Our firm, employees, and customers may effect transactions, including transactions contrary to any recommendation herein, or have positions in the securities mentioned herein or options with respect thereto. Any recommendation contained in this report may not be suitable for all investors and it is not to be deemed an offer or solicitation on our part with respect to the purchase or sale of any securities. |
|
 |
Commodity-Linked Groups Led Decliners
Kenneth J. Gruneisen - Passed the CAN SLIM® Master's Exam
Commodity-linked groups faced pressure and the Gold & Silver Index ($XAU -3.07%) and the Oil Services Index ($OSX -2.88%) led decliners on Monday. The Integrated Oil Index ($XOI -0.64%) finished with a smaller loss. The influential Bank Index ($BKX -0.39%) and Broker/Dealer Index ($XBD -0.21%) created a drag on the major averages as they also edged lower. Gains for the Biotechnology Index ($BTK +1.20%), Healthcare Index ($HMO +0.47%), and Retail Index ($RLX +0.57%) helped partially offset other weaker groups. The Networking Index ($NWX -1.41%) and Semiconductor Index ($SOX -1.00%) fell, and the Internet Index ($IIX -0.02%) finished flat.
Charts courtesy www.stockcharts.com
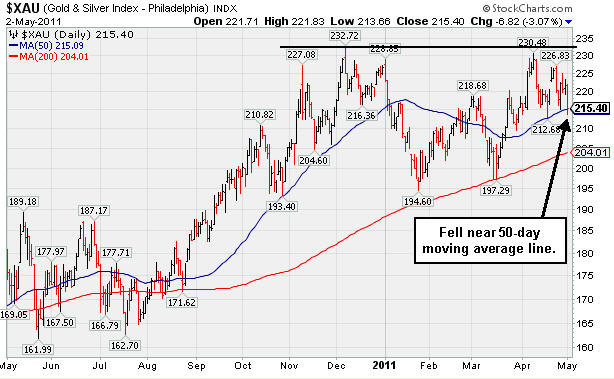
PICTURED: The Gold & Silver Index ($XAU -3.07%) fell near its 50-day moving average (DMA) line. Since it almost challenged its December 2010 high in early April, the index of 16 companies found support above its 50 DMA line.
| Oil Services |
$OSX |
280.02 |
-8.31 |
-2.88% |
+14.24% |
| Healthcare |
$HMO |
2,342.01 |
+10.97 |
+0.47% |
+38.42% |
| Integrated Oil |
$XOI |
1,393.99 |
-8.97 |
-0.64% |
+14.91% |
| Semiconductor |
$SOX |
445.06 |
-4.50 |
-1.00% |
+8.07% |
| Networking |
$NWX |
335.75 |
-4.79 |
-1.41% |
+19.67% |
| Internet |
$IIX |
326.63 |
-0.06 |
-0.02% |
+6.14% |
| Broker/Dealer |
$XBD |
121.19 |
-0.26 |
-0.21% |
-0.27% |
| Retail |
$RLX |
543.57 |
+3.07 |
+0.57% |
+6.92% |
| Gold & Silver |
$XAU |
215.40 |
-6.82 |
-3.07% |
-4.93% |
| Bank |
$BKX |
51.33 |
-0.20 |
-0.39% |
-1.69% |
| Biotech |
$BTK |
1,479.68 |
+17.58 |
+1.20% |
+14.03% |
|
|
|
 |
Consolidating After Later Gains Lacked Volume
Kenneth J. Gruneisen - Passed the CAN SLIM® Master's Exam
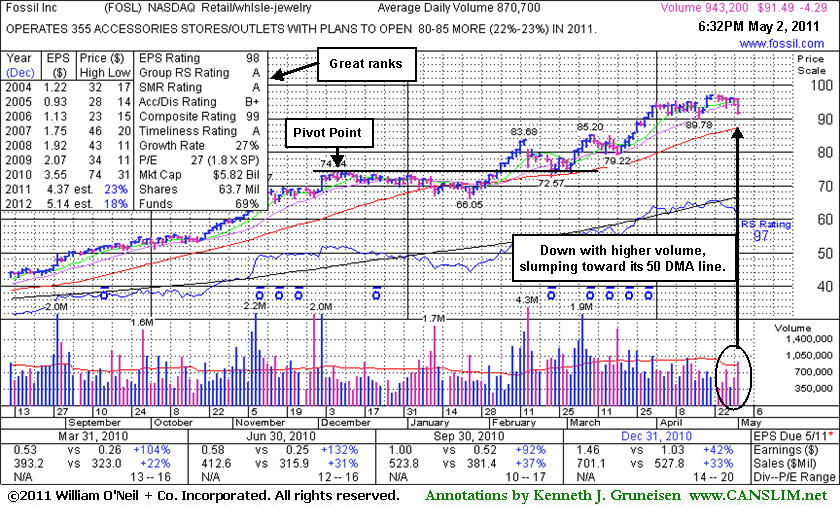
Fossil Inc (FOSL -$4.24 or -4.43% to $91.54) has been quietly consolidating near its all-time high, but finished down today on slightly higher volume. Its 50-day moving average (DMA) line now defines support above prior chart highs. Since last shown in this FSU section on 3/30/11 with an annotated graph under the headline, "Wedging Higher Getting Extended From Prior Base", it gradually worked its way even higher without great volume conviction. Disciplined investors avoid chasing extended stocks. It could produce more climactic gains, but it is extended from any sound base.
It is scheduled to release earnings news on May 10th. Sales revenues and earnings increases showed impressive acceleration in the 5 latest quarters (Dec '09, Mar, Jun, Sep, Dec '10) following a streak of 4 negative comparisons versus the year ago period. Much earlier, FOSL appeared in this section near $44 on 8/11/10 under the headline, "Breakaway Gap On More Than Triple Average Volume". It was featured in yellow in the 8/10/10 mid-day report (read here) and has subsequently traded as much as +113% higher. The number of top-rated funds owning its shares rose from 512 in Mar '10 to 582 in Mar '11 a reassuring sign concerning the I criteria of the investment system.
 |
|
|
Color Codes Explained :
Y - Better candidates highlighted by our
staff of experts.
G - Previously featured
in past reports as yellow but may no longer be buyable under the
guidelines.
***Last / Change / Volume data in this table is the closing quote data***
Symbol/Exchange
Company Name
Industry Group |
PRICE |
CHANGE
(%Change) |
Day High |
Volume
(% DAV)
(% 50 day avg vol) |
52 Wk Hi
% From Hi |
Featured
Date |
Price
Featured |
Pivot Featured |
|
Max Buy |
AIXG
-
NASDAQ
Aixtron Se
ELECTRONICS - Semiconductor Equipment andamp; Mate
|
$42.41
|
-0.04
-0.09% |
$43.06
|
147,465
56.07% of 50 DAV
50 DAV is 263,000
|
$44.96
-5.67%
|
4/5/2011
|
$44.14
|
PP = $44.64
|
|
MB = $46.87
|
Most Recent Note - 4/28/2011 10:54:28 AM
G - Gapped down today after a solid gain and strong close on the prior session, slumping back near its 50 DMA line. Still perched only -6.1% off its all-time high. Rebound above its 50 DMA was noted as a technical improvement that helped its outlook after it recently found support near prior lows in the $38 area.
>>> The latest Featured Stock Update with an annotated graph appeared on 4/5/2011. Click here.
View all notes |
Alert me of new notes |
CANSLIM.net Company Profile |
SEC |
Zacks Reports |
StockTalk |
News |
Chart |
Request a new note
C
A N
S L
I M


|
BIDU
-
NASDAQ
Baidu Inc Ads
INTERNET - Internet Information Providers
|
$147.47
|
-1.05
-0.71% |
$150.50
|
5,962,246
80.68% of 50 DAV
50 DAV is 7,389,700
|
$156.04
-5.49%
|
3/17/2011
|
$121.97
|
PP = $131.73
|
|
MB = $138.32
|
Most Recent Note - 4/28/2011 12:26:21 PM
G - Reported earnings +129% on +96% sales revenues for the quarter ended March 31, 2011 versus the year ago period. Touched another new all-time high early today then reversed into the red. It has been repeatedly noted - "Extended from its latest base. Prior high near $131 defines initial chart support to watch near its rising 50 DMA line."
>>> The latest Featured Stock Update with an annotated graph appeared on 4/7/2011. Click here.
View all notes |
Alert me of new notes |
CANSLIM.net Company Profile |
SEC |
Zacks Reports |
StockTalk |
News |
Chart |
Request a new note
C
A N
S L
I M
|
CMG
-
NYSE
Chipotle Mexican Grill
LEISURE - Restaurants
|
$267.08
|
+0.29
0.11% |
$270.00
|
761,861
65.91% of 50 DAV
50 DAV is 1,155,900
|
$289.35
-7.70%
|
4/1/2011
|
$274.00
|
PP = $275.10
|
|
MB = $288.86
|
Most Recent Note - 4/27/2011 4:59:48 PM
G - Small loss today came on 8 times average volume while it nearly tested its 50 DMA line ($261.81 now), an important chart support level. Recently negated its latest technical breakout. Gapped down on 4/21/11 after reporting earnings +23% on +24% sales revenues for the quarter ended March 31, 2011 versus the year ago period, its weakest earnings increase in years, and below the +25% guideline.
>>> The latest Featured Stock Update with an annotated graph appeared on 4/13/2011. Click here.
View all notes |
Alert me of new notes |
CANSLIM.net Company Profile |
SEC |
Zacks Reports |
StockTalk |
News |
Chart |
Request a new note
C
A N
S L
I M
|
CTSH
-
NASDAQ
Cognizant Tech Sol Cl A
COMPUTER SOFTWARE and SERVICES - Business Software and Services
|
$82.21
|
-0.69
-0.83% |
$83.48
|
2,304,158
104.30% of 50 DAV
50 DAV is 2,209,200
|
$83.23
-1.23%
|
2/7/2011
|
$75.09
|
PP = $76.46
|
|
MB = $80.28
|
Most Recent Note - 4/27/2011 5:23:06 PM
G - Holding its ground -1.4% off its all-time high. Reporting earnings on Tuesday, May 3rd before the open. Last week it tested prior highs in the $77-78 area and its 50 DMA line and found prompt support.
>>> The latest Featured Stock Update with an annotated graph appeared on 4/15/2011. Click here.
View all notes |
Alert me of new notes |
CANSLIM.net Company Profile |
SEC |
Zacks Reports |
StockTalk |
News |
Chart |
Request a new note
C
A N
S L
I M
|
EZPW
-
NASDAQ
Ezcorp Inc Cl A
SPECIALTY RETAIL - Specialty Retail, Other
|
$31.07
|
-0.42
-1.33% |
$31.88
|
285,672
76.81% of 50 DAV
50 DAV is 371,900
|
$33.08
-6.08%
|
2/18/2011
|
$27.94
|
PP = $30.04
|
|
MB = $31.54
|
Most Recent Note - 4/28/2011 5:20:24 PM
G - Closed near the session high today, rebounding further above its 50 DMA line and prior highs in the $29-30 area after negating its recent breakout. It has not formed a sound new base pattern. Reported earnings +31% on +21% sales revenues for the quarter ended March 31, 2011 versus the year ago period.
>>> The latest Featured Stock Update with an annotated graph appeared on 4/11/2011. Click here.
View all notes |
Alert me of new notes |
CANSLIM.net Company Profile |
SEC |
Zacks Reports |
StockTalk |
News |
Chart |
Request a new note
C
A N
S L
I M
|
Symbol/Exchange
Company Name
Industry Group |
PRICE |
CHANGE
(%Change) |
Day High |
Volume
(% DAV)
(% 50 day avg vol) |
52 Wk Hi
% From Hi |
Featured
Date |
Price
Featured |
Pivot Featured |
|
Max Buy |
FOSL
-
NASDAQ
Fossil Inc
CONSUMER DURABLES - Recreational Goods, Other
|
$91.54
|
-4.24
-4.43% |
$95.99
|
979,115
112.45% of 50 DAV
50 DAV is 870,700
|
$96.99
-5.62%
|
2/1/2011
|
$73.30
|
PP = $74.44
|
|
MB = $78.16
|
 Most Recent Note - 5/2/2011 6:57:56 PM
G - Down today on higher volume. It could produce more climactic gains, but it is extended from any sound base. Its 50 DMA line now defines support above prior chart highs. See latest FSU analysis for more details and a new annotated graph.
>>> The latest Featured Stock Update with an annotated graph appeared on 5/2/2011. Click here.
View all notes |
Alert me of new notes |
CANSLIM.net Company Profile |
SEC |
Zacks Reports |
StockTalk |
News |
Chart |
Request a new note
C
A N
S L
I M
|
HMSY
-
NASDAQ
H M S Holdings Corp
COMPUTER SOFTWARE and SERVICES - Healthcare Information Service
|
$78.20
|
-0.51
-0.65% |
$79.46
|
297,374
166.97% of 50 DAV
50 DAV is 178,100
|
$84.82
-7.80%
|
11/19/2010
|
$61.89
|
PP = $63.01
|
|
MB = $66.16
|
Most Recent Note - 5/2/2011 7:01:38 PM
G - Down again with above average volume today, losing more ground after technically violating its 50 DMA line last week with a loss on heavy volume triggering a technical sell signal. Reported earnings +26% on +27% sales revenues for the quarter ended March 31, 2011 versus the year ago period.
>>> The latest Featured Stock Update with an annotated graph appeared on 4/26/2011. Click here.
View all notes |
Alert me of new notes |
CANSLIM.net Company Profile |
SEC |
Zacks Reports |
StockTalk |
News |
Chart |
Request a new note
C
A N
S L
I M
|
HS
-
NYSE
Healthspring Inc
HEALTH SERVICES - Health Care Plans
|
$43.74
|
+2.25
5.42% |
$43.97
|
2,120,291
230.94% of 50 DAV
50 DAV is 918,100
|
$41.53
5.32%
|
3/22/2011
|
$38.29
|
PP = $38.85
|
|
MB = $40.79
|
Most Recent Note - 5/2/2011 12:51:43 PM
G - Up today for a considerable gain with above average volume, getting more extended from a sound base. Its 50 DMA line defines important chart support.
>>> The latest Featured Stock Update with an annotated graph appeared on 4/21/2011. Click here.
View all notes |
Alert me of new notes |
CANSLIM.net Company Profile |
SEC |
Zacks Reports |
StockTalk |
News |
Chart |
Request a new note
C
A N
S L
I M
|
INFA
-
NASDAQ
Informatica Corp
COMPUTER SOFTWARE and SERVICES - Business Software and Services
|
$54.93
|
-1.08
-1.93% |
$56.49
|
903,380
89.12% of 50 DAV
50 DAV is 1,013,700
|
$56.33
-2.49%
|
3/24/2011
|
$50.04
|
PP = $49.86
|
|
MB = $52.35
|
Most Recent Note - 5/2/2011 7:03:15 PM
G - Touched a new 52-week high today but quietly reversed for a loss. Extended from its latest base. Prior highs in the $49 area define support to watch coinciding with its 50 DMA line.
>>> The latest Featured Stock Update with an annotated graph appeared on 4/27/2011. Click here.
View all notes |
Alert me of new notes |
CANSLIM.net Company Profile |
SEC |
Zacks Reports |
StockTalk |
News |
Chart |
Request a new note
C
A N
S L
I M
|
LULU
-
NASDAQ
Lululemon Athletica
MANUFACTURING - Textile Manufacturing
|
$96.35
|
-3.70
-3.70% |
$100.63
|
1,943,970
86.73% of 50 DAV
50 DAV is 2,241,500
|
$102.83
-6.30%
|
3/28/2011
|
$68.11
|
PP = $85.38
|
|
MB = $89.65
|
Most Recent Note - 5/2/2011 2:35:13 PM
G - Down considerably today, pulling back from all-time highs. This high-ranked Retail-Apparel firm has been noted as extended from any sound base pattern. Prior highs and its 50 DMA line in the $85 area define important chart support to watch.
>>> The latest Featured Stock Update with an annotated graph appeared on 3/31/2011. Click here.
View all notes |
Alert me of new notes |
CANSLIM.net Company Profile |
SEC |
Zacks Reports |
StockTalk |
News |
Chart |
Request a new note
C
A N
S L
I M
|
Symbol/Exchange
Company Name
Industry Group |
PRICE |
CHANGE
(%Change) |
Day High |
Volume
(% DAV)
(% 50 day avg vol) |
52 Wk Hi
% From Hi |
Featured
Date |
Price
Featured |
Pivot Featured |
|
Max Buy |
MG
-
NYSE
Mistras Group Inc
DIVERSIFIED SERVICES - Bulding and Faci;ity Management Services
|
$18.23
|
-0.09
-0.49% |
$18.40
|
117,644
91.84% of 50 DAV
50 DAV is 128,100
|
$18.46
-1.25%
|
3/15/2011
|
$15.48
|
PP = $15.90
|
|
MB = $16.70
|
Most Recent Note - 4/27/2011 5:34:52 PM
G - Stubbornly holding its ground, extended from any sound base pattern. Its 50 DMA line and prior highs define important support to watch.
>>> The latest Featured Stock Update with an annotated graph appeared on 4/12/2011. Click here.
View all notes |
Alert me of new notes |
CANSLIM.net Company Profile |
SEC |
Zacks Reports |
StockTalk |
News |
Chart |
Request a new note
C
A N
S L
I M
|
MWIV
-
NASDAQ
M W I Veterinary Supply
HEALTH SERVICES - Medical Instruments and; Supplies
|
$83.11
|
-0.06
-0.07% |
$83.63
|
66,679
64.67% of 50 DAV
50 DAV is 103,100
|
$84.97
-2.19%
|
11/4/2010
|
$61.79
|
PP = $59.60
|
|
MB = $62.58
|
Most Recent Note - 4/29/2011 4:24:38 PM
G - Gain today with quiet volume, finishing -2.2% off its all-time high. Extended from any sound base pattern, its 50 DMA line defines important support to watch. Since first featured in yellow on 7/29/10 it has traded as much as +63% higher.
>>> The latest Featured Stock Update with an annotated graph appeared on 4/8/2011. Click here.
View all notes |
Alert me of new notes |
CANSLIM.net Company Profile |
SEC |
Zacks Reports |
StockTalk |
News |
Chart |
Request a new note
C
A N
S L
I M
|
OPEN
-
NASDAQ
Opentable Inc
INTERNET - Internet Software and Services
|
$113.83
|
+2.54
2.28% |
$115.07
|
1,463,688
123.42% of 50 DAV
50 DAV is 1,185,900
|
$118.66
-4.07%
|
3/17/2011
|
$90.71
|
PP = $96.07
|
|
MB = $100.87
|
Most Recent Note - 5/2/2011 2:55:22 PM
G - Up today with higher volume, rallying near its best ever close ($115.62). Reporting earnings on Tuesday, May 3rd for the quarter ended March 31, 2011. It could produce more climactic gains, but has been repeatedly noted - "Extended from its latest base. Prior highs near $96 and its 50 DMA line define support to watch on pullbacks."
>>> The latest Featured Stock Update with an annotated graph appeared on 4/25/2011. Click here.
View all notes |
Alert me of new notes |
CANSLIM.net Company Profile |
SEC |
Zacks Reports |
StockTalk |
News |
Chart |
Request a new note
C
A N
S L
I M
|
PAY
-
NYSE
Verifone Systems Inc
COMPUTER HARDWARE - Transaction Automation Systems
|
$52.96
|
-1.86
-3.39% |
$55.16
|
1,888,533
79.02% of 50 DAV
50 DAV is 2,390,000
|
$58.88
-10.05%
|
4/29/2011
|
$54.73
|
PP = $58.98
|
|
MB = $61.93
|
Most Recent Note - 5/2/2011 2:58:23 PM
Y - Still quietly consolidating above its 50 DMA line ($51.63 now). It has formed a short flat base, considered a riskier "late-stage" base, and its color code was changed to yellow with a new pivot point cited based on its 52-week high plus 10 cents. The "Ken's Mailbag" Q&A in the 4/29/11 After Market Update included more details about late-stage bases (read here).
>>> The latest Featured Stock Update with an annotated graph appeared on 4/4/2011. Click here.
View all notes |
Alert me of new notes |
CANSLIM.net Company Profile |
SEC |
Zacks Reports |
StockTalk |
News |
Chart |
Request a new note
C
A N
S L
I M
|
PCLN
-
NASDAQ
Priceline.Com Inc
INTERNET - Internet Software and Services
|
$555.65
|
+8.64
1.58% |
$561.88
|
1,228,479
103.72% of 50 DAV
50 DAV is 1,184,400
|
$556.27
-0.11%
|
1/3/2011
|
$399.55
|
PP = $428.20
|
|
MB = $449.61
|
Most Recent Note - 5/2/2011 2:59:59 PM
G - Up today for yet another new 52-week high without great volume conviction. It may go on to produce more climactic gains, yet it has been repeatedly noted - "Extended from any sound base pattern. Its 50 DMA line has defined support throughout its advance."
>>> The latest Featured Stock Update with an annotated graph appeared on 4/20/2011. Click here.
View all notes |
Alert me of new notes |
CANSLIM.net Company Profile |
SEC |
Zacks Reports |
StockTalk |
News |
Chart |
Request a new note
C
A N
S L
I M
|
Symbol/Exchange
Company Name
Industry Group |
PRICE |
CHANGE
(%Change) |
Day High |
Volume
(% DAV)
(% 50 day avg vol) |
52 Wk Hi
% From Hi |
Featured
Date |
Price
Featured |
Pivot Featured |
|
Max Buy |
RAX
-
NYSE
Rackspace Hosting Inc
INTERNET - Internet Software and; Services
|
$44.42
|
-1.77
-3.83% |
$46.49
|
1,710,788
106.56% of 50 DAV
50 DAV is 1,605,400
|
$46.50
-4.46%
|
3/16/2011
|
$36.28
|
PP = $40.72
|
|
MB = $42.76
|
Most Recent Note - 5/2/2011 2:51:30 PM
G - Pulling back from its all-time high hit on the prior session. It is extended from any sound base, and prior highs near $40 define support above its 50 DMA line.
>>> The latest Featured Stock Update with an annotated graph appeared on 4/18/2011. Click here.
View all notes |
Alert me of new notes |
CANSLIM.net Company Profile |
SEC |
Zacks Reports |
StockTalk |
News |
Chart |
Request a new note
C
A N
S L
I M
|
TIBX
-
NASDAQ
Tibco Software Inc
COMPUTER SOFTWARE and SERVICES - Business Software and Services
|
$29.66
|
-0.33
-1.10% |
$30.40
|
2,551,121
102.18% of 50 DAV
50 DAV is 2,496,700
|
$30.45
-2.59%
|
3/18/2011
|
$23.88
|
PP = $26.04
|
|
MB = $27.34
|
Most Recent Note - 4/27/2011 5:16:43 PM
G - Quietly holding its ground near its all-time high, extended from any sound base after a spurt of volume-driven gains. As previously noted, support is defined by prior highs in the $25-26 area and its 50 DMA line.
>>> The latest Featured Stock Update with an annotated graph appeared on 4/14/2011. Click here.
View all notes |
Alert me of new notes |
CANSLIM.net Company Profile |
SEC |
Zacks Reports |
StockTalk |
News |
Chart |
Request a new note
C
A N
S L
I M
|
UA
-
NYSE
Under Armour Inc Cl A
CONSUMER NON-DURABLES - Textile - Apparel Clothing
|
$66.80
|
-1.66
-2.42% |
$68.59
|
1,722,560
195.68% of 50 DAV
50 DAV is 880,300
|
$80.00
-16.50%
|
3/31/2011
|
$68.04
|
PP = $70.79
|
|
MB = $74.33
|
Most Recent Note - 5/2/2011 2:27:33 PM
G - Down again today, slumping further below its 50 DMA line and under prior chart highs after triggering technical sell signals noted last week. See the latest FSU analysis for details and a new annotated graph.
>>> The latest Featured Stock Update with an annotated graph appeared on 4/29/2011. Click here.
View all notes |
Alert me of new notes |
CANSLIM.net Company Profile |
SEC |
Zacks Reports |
StockTalk |
News |
Chart |
Request a new note
C
A N
S L
I M
|
ULTA
-
NASDAQ
Ulta Salon Cosm & Frag
SPECIALTY RETAIL - Specialty Retail, Other
|
$53.36
|
+0.17
0.32% |
$53.97
|
412,667
67.41% of 50 DAV
50 DAV is 612,200
|
$53.99
-1.17%
|
1/6/2011
|
$36.12
|
PP = $37.34
|
|
MB = $39.21
|
Most Recent Note - 4/28/2011 6:54:20 PM
G - Extended from any sound base now. Its 50 DMA line defines chart support to watch well above prior highs. See the latest FSU analysis for more details and a new annotated graph.
>>> The latest Featured Stock Update with an annotated graph appeared on 4/28/2011. Click here.
View all notes |
Alert me of new notes |
CANSLIM.net Company Profile |
SEC |
Zacks Reports |
StockTalk |
News |
Chart |
Request a new note
C
A N
S L
I M
|
|
|
|
THESE ARE NOT BUY RECOMMENDATIONS!
Comments contained in the body of this report are technical
opinions only. The material herein has been obtained
from sources believed to be reliable and accurate, however,
its accuracy and completeness cannot be guaranteed.
This site is not an investment advisor, hence it does
not endorse or recommend any securities or other investments.
Any recommendation contained in this report may not
be suitable for all investors and it is not to be deemed
an offer or solicitation on our part with respect to
the purchase or sale of any securities. All trademarks,
service marks and trade names appearing in this report
are the property of their respective owners, and are
likewise used for identification purposes only.
This report is a service available
only to active Paid Premium Members.
You may opt-out of receiving report notifications
at any time. Questions or comments may be submitted
by writing to Premium Membership Services 665 S.E. 10 Street, Suite 201 Deerfield Beach, FL 33441-5634 or by calling 1-800-965-8307
or 954-785-1121.
|
|
|

