***Last / Change / Volume data in this table is the closing quote data***
Symbol/Exchange
Company Name
Industry Group |
PRICE |
CHANGE
(%Change) |
Day High |
Volume
(% DAV)
(% 50 day avg vol) |
52 Wk Hi
% From Hi |
Featured
Date |
Price
Featured |
Pivot Featured |
|
Max Buy |
ACN
-
NYSE
Accenture Plc
DIVERSIFIED SERVICES - Business/Management Services
|
$65.00
|
+0.05
0.08% |
$65.64
|
2,234,362
68.59% of 50 DAV
50 DAV is 3,257,700
|
$65.89
-1.35%
|
3/23/2012
|
$64.13
|
PP = $63.76
|
|
MB = $66.95
|
Most Recent Note - 4/30/2012 5:38:39 PM
Y - Recently consolidating above prior highs in the $62-63 area and its 50 DMA line defining important near-term support. A subsequent violation of its recent low would trigger a worrisome technical sell signal.
>>> The latest Featured Stock Update with an annotated graph appeared on 3/23/2012. Click here.
View all notes |
Alert me of new notes |
CANSLIM.net Company Profile |
SEC |
Zacks Reports |
StockTalk |
News |
Chart |
Request a new note
C
A N
S L
I M


|
ADS
-
NYSE
Alliance Data Sys Corp
COMPUTER SOFTWARE and SERVICES - Information and Delivery Service
|
$129.05
|
+0.56
0.44% |
$130.13
|
399,228
69.08% of 50 DAV
50 DAV is 577,900
|
$130.66
-1.23%
|
1/17/2012
|
$108.24
|
PP = $107.43
|
|
MB = $112.80
|
 Most Recent Note - 5/1/2012 6:31:47 PM
G - Still holding its ground near its all-time high today even after sub par earnings increases raised fundamental concerns. Its 50 DMA line defines important support to watch where any violation would trigger a technical sell signal.
>>> The latest Featured Stock Update with an annotated graph appeared on 4/24/2012. Click here.
View all notes |
Alert me of new notes |
CANSLIM.net Company Profile |
SEC |
Zacks Reports |
StockTalk |
News |
Chart |
Request a new note
C
A N
S L
I M
|
ALLT
-
NASDAQ
Allot Communications Ltd
COMPUTER SOFTWARE andamp; SERVICES - Technical andamp; System Software
|
$26.30
|
+1.76
7.17% |
$26.92
|
1,371,943
305.90% of 50 DAV
50 DAV is 448,500
|
$25.36
3.71%
|
3/13/2012
|
$19.72
|
PP = $18.91
|
|
MB = $19.86
|
Most Recent Note - 5/1/2012 11:52:40 AM
G - Gapped up today for a considerable gain and new all-time high, getting more extended from its prior base. Reported earnings +88% on +41% sales revenues for the quarter ended March 31, 2012 versus the year ago period. Recent lows ($22.46 on 4/23/12) define near-term support above its 50 DMA line.
>>> The latest Featured Stock Update with an annotated graph appeared on 3/19/2012. Click here.
View all notes |
Alert me of new notes |
CANSLIM.net Company Profile |
SEC |
Zacks Reports |
StockTalk |
News |
Chart |
Request a new note
C
A N
S L
I M
|
ALXN
-
NASDAQ
Alexion Pharmaceuticals
DRUGS - Drug Manufacturers - Other
|
$91.73
|
+1.41
1.56% |
$92.39
|
1,027,915
82.66% of 50 DAV
50 DAV is 1,243,500
|
$95.01
-3.45%
|
5/1/2012
|
$91.73
|
PP = $95.11
|
|
MB = $99.87
|
Most Recent Note - 5/1/2012 6:36:07 PM
Y - Color code is changed to yellow with new pivot point cited based on its 3/26/12 high plus 10 cents after building an orderly flat base above support at its 50 DMA line. The late-stage base may be a riskier set-up, yet volume-driven gains could trigger a new (or add-on) technical buy signal. .
>>> The latest Featured Stock Update with an annotated graph appeared on 4/16/2012. Click here.
View all notes |
Alert me of new notes |
CANSLIM.net Company Profile |
SEC |
Zacks Reports |
StockTalk |
News |
Chart |
Request a new note
C
A N
S L
I M
|
ARBA
-
NASDAQ
Ariba Inc
INTERNET - Internet Software and Services
|
$39.17
|
+0.97
2.54% |
$39.43
|
1,813,104
188.37% of 50 DAV
50 DAV is 962,500
|
$40.45
-3.16%
|
4/27/2012
|
$38.53
|
PP = $37.24
|
|
MB = $39.10
|
Most Recent Note - 4/30/2012 7:01:48 PM
Y - Pulled back today with above average volume following the prior session's technical breakout on 5 times average volume. Support to watch is at prior highs in the $35-37 area. ARBA was highlighted in yellow in the 4/27/12 mid-day breakouts report (read here) when breaking out above the pivot point cited based on its 7/11/11 high plus 10 cents. See the latest FSU analysis for more details and a new annotated graph.
>>> The latest Featured Stock Update with an annotated graph appeared on 4/30/2012. Click here.
View all notes |
Alert me of new notes |
CANSLIM.net Company Profile |
SEC |
Zacks Reports |
StockTalk |
News |
Chart |
Request a new note
C
A N
S L
I M
|
Symbol/Exchange
Company Name
Industry Group |
PRICE |
CHANGE
(%Change) |
Day High |
Volume
(% DAV)
(% 50 day avg vol) |
52 Wk Hi
% From Hi |
Featured
Date |
Price
Featured |
Pivot Featured |
|
Max Buy |
BODY
-
NASDAQ
Body Central Corp
RETAIL - Catalog andamp; Mail Order Houses
|
$29.36
|
-1.01
-3.33% |
$30.93
|
132,815
71.48% of 50 DAV
50 DAV is 185,800
|
$30.88
-4.92%
|
4/18/2012
|
$27.44
|
PP = $29.59
|
|
MB = $31.07
|
Most Recent Note - 5/1/2012 6:48:37 PM
Y - Pulled back toward prior highs today on lighter volume. Gains above the pivot point backed by a minimum of +40% above average volume are still needed to trigger a proper new (or add-on) technical buy signal.
>>> The latest Featured Stock Update with an annotated graph appeared on 3/13/2012. Click here.
View all notes |
Alert me of new notes |
CANSLIM.net Company Profile |
SEC |
Zacks Reports |
StockTalk |
News |
Chart |
Request a new note
C
A N
S L
I M
|
CDNS
-
NASDAQ
Cadence Design Systems
COMPUTER SOFTWARE and SERVICES - Technical and System Software
|
$11.68
|
+0.01
0.09% |
$11.87
|
2,136,249
75.43% of 50 DAV
50 DAV is 2,832,100
|
$12.60
-7.30%
|
2/3/2012
|
$11.66
|
PP = $11.15
|
|
MB = $11.71
|
Most Recent Note - 4/25/2012 10:25:25 AM
G - Up today following a streak of 5 consecutive losses and distributional pressure that briefly undercut the prior low ($11.20 on 4/10/12) and raised more serious concerns. Its 50 DMA line acted as resistance since last noted, and a rebound above that important short-term average is needed for its technical stance and outlook to improve.
>>> The latest Featured Stock Update with an annotated graph appeared on 3/28/2012. Click here.
View all notes |
Alert me of new notes |
CANSLIM.net Company Profile |
SEC |
Zacks Reports |
StockTalk |
News |
Chart |
Request a new note
C
A N
S L
I M
|
CELG
-
NASDAQ
Celgene Corp
DRUGS - Drug Manufacturers - Major
|
$72.58
|
-0.35
-0.47% |
$73.31
|
4,827,749
168.73% of 50 DAV
50 DAV is 2,861,300
|
$80.42
-9.75%
|
2/2/2012
|
$74.16
|
PP = $75.21
|
|
MB = $78.97
|
Most Recent Note - 4/26/2012 12:09:02 PM
G - Reported earnings +30% on +13% sales revenues for the quarter ended March 31, 2012 versus the year ago period. Volume and volatility often increase near earnings news. It gapped down today, violating its 50 DMA line and triggering a technical sell signal. Only a prompt rebound above its 50 DMA line would help its outlook improve.
>>> The latest Featured Stock Update with an annotated graph appeared on 3/26/2012. Click here.
View all notes |
Alert me of new notes |
CANSLIM.net Company Profile |
SEC |
Zacks Reports |
StockTalk |
News |
Chart |
Request a new note
C
A N
S L
I M
|
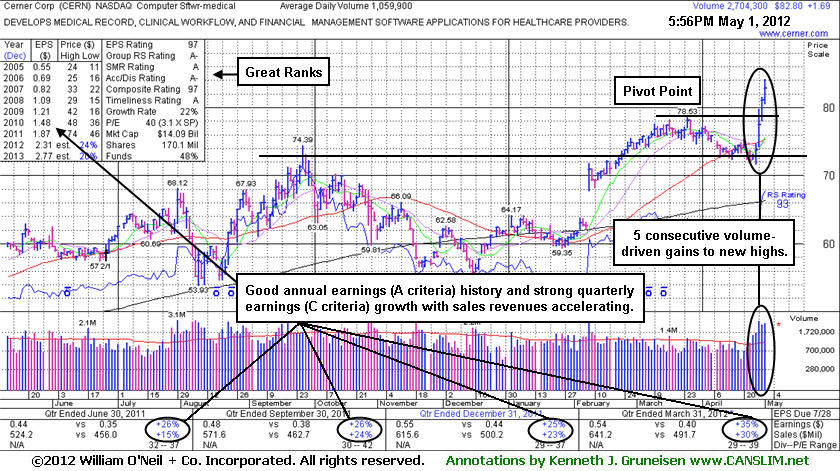
CERN
-
NASDAQ
Cerner Corp
COMPUTER SOFTWARE and SERVICES - Healthcare Information Service
|
$82.80
|
+1.69
2.08% |
$84.10
|
2,709,491
255.64% of 50 DAV
50 DAV is 1,059,900
|
$81.48
1.62%
|
4/27/2012
|
$77.23
|
PP = $78.63
|
|
MB = $82.56
|
Most Recent Note - 5/1/2012 6:14:21 PM
G - This Computer Software - Medical firm rallied above its "max buy" level with today's 5th consecutive volume-driven gain and its color code was changed to green. See the latest FSU analysis for more details and a new annotated graph.
>>> The latest Featured Stock Update with an annotated graph appeared on 5/1/2012. Click here.
View all notes |
Alert me of new notes |
CANSLIM.net Company Profile |
SEC |
Zacks Reports |
StockTalk |
News |
Chart |
Request a new note
C
A N
S L
I M
|
COO
-
NYSE
Cooper Companies Inc
HEALTH SERVICES - Medical Instruments and Supplies
|
$88.23
|
+0.06
0.07% |
$89.23
|
299,792
68.51% of 50 DAV
50 DAV is 437,600
|
$88.74
-0.57%
|
3/9/2012
|
$83.05
|
PP = $81.02
|
|
MB = $85.07
|
Most Recent Note - 4/25/2012 10:32:17 AM
G - Up today without great volume conviction while trading to new 52-week and all-time highs above its "max buy" level. Color code is changed to green after getting extended from its prior base.
>>> The latest Featured Stock Update with an annotated graph appeared on 3/9/2012. Click here.
View all notes |
Alert me of new notes |
CANSLIM.net Company Profile |
SEC |
Zacks Reports |
StockTalk |
News |
Chart |
Request a new note
C
A N
S L
I M
|
Symbol/Exchange
Company Name
Industry Group |
PRICE |
CHANGE
(%Change) |
Day High |
Volume
(% DAV)
(% 50 day avg vol) |
52 Wk Hi
% From Hi |
Featured
Date |
Price
Featured |
Pivot Featured |
|
Max Buy |
DISH
-
NASDAQ
Dish Network Corp Cl A
CONSUMER DURABLES - Electronic Equipment
|
$31.98
|
+0.01
0.03% |
$32.58
|
1,965,821
78.53% of 50 DAV
50 DAV is 2,503,200
|
$35.64
-10.27%
|
3/7/2012
|
$30.83
|
PP = $30.10
|
|
MB = $31.61
|
Most Recent Note - 4/25/2012 8:13:52 PM
G - Today's gain on light volume helped it bounce from important support at its 50 DMA line. Continued support near that important short-term average would help its outlook, but further deterioration would raise more serious concerns.
>>> The latest Featured Stock Update with an annotated graph appeared on 3/14/2012. Click here.
View all notes |
Alert me of new notes |
CANSLIM.net Company Profile |
SEC |
Zacks Reports |
StockTalk |
News |
Chart |
Request a new note
C
A N
S L
I M
|
EXPE
-
NASDAQ
Expedia Inc
INTERNET - Internet Information Providers
|
$41.64
|
-1.01
-2.37% |
$42.67
|
8,152,038
201.57% of 50 DAV
50 DAV is 4,044,300
|
$43.92
-5.19%
|
4/27/2012
|
$41.80
|
PP = $35.57
|
|
MB = $37.35
|
Most Recent Note - 5/1/2012 12:10:17 PM
G - Color code was changed to green after getting extended from its prior base with consecutive volume-driven gains. EXPE was highlighted in yellow in the 4/27/12 mid-day breakouts report (read here) when its considerable "breakaway gap" up above the pivot point cited based on its 3/26/12 high plus 10 cents. Reported earnings +63% on +12% sales revenues for the quarter ended March 31, 2012 versus the year ago period. Quarterly earnings have been above the +25% minimum guideline in 3 of the past 4 comparisons and its annual earnings (A criteria) history has been good.
There are no Featured Stock Updates™ available for this stock at this time. You may request one by clicking the Request a New Note link below
View all notes |
Alert me of new notes |
CANSLIM.net Company Profile |
SEC |
Zacks Reports |
StockTalk |
News |
Chart |
Request a new note
C
A N
S L
I M
|
FEIC
-
NASDAQ
F E I Co
ELECTRONICS - Diversified Electronics
|
$50.79
|
+0.62
1.24% |
$51.34
|
400,721
133.53% of 50 DAV
50 DAV is 300,100
|
$50.39
0.79%
|
12/7/2011
|
$41.41
|
PP = $42.35
|
|
MB = $44.47
|
Most Recent Note - 4/25/2012 10:19:54 AM
G - Consolidating above its 50 DMA line, building a new base. The latest quarterly report showed +21% earnings for the Dec '11 quarter, below the +25% minimum guideline for earnings growth.
>>> The latest Featured Stock Update with an annotated graph appeared on 3/12/2012. Click here.
View all notes |
Alert me of new notes |
CANSLIM.net Company Profile |
SEC |
Zacks Reports |
StockTalk |
News |
Chart |
Request a new note
C
A N
S L
I M
|
GNC
-
NYSE
G N C Holdings Inc
RETAIL - Drug Stores
|
$38.53
|
-0.53
-1.36% |
$40.36
|
4,999,436
272.95% of 50 DAV
50 DAV is 1,831,600
|
$41.95
-8.15%
|
1/19/2012
|
$28.99
|
PP = $29.60
|
|
MB = $31.08
|
Most Recent Note - 4/30/2012 10:02:36 AM
G - Gapped down today, retreating from its all-time high. Reported earnings +82% on +23% sales revenues for the quarter ended March 31, 2012 versus the year ago period. See the latest FSU analysis for more details and a new annotated graph.
>>> The latest Featured Stock Update with an annotated graph appeared on 4/26/2012. Click here.
View all notes |
Alert me of new notes |
CANSLIM.net Company Profile |
SEC |
Zacks Reports |
StockTalk |
News |
Chart |
Request a new note
C
A N
S L
I M
|
HLF
-
NYSE
Herbalife Ltd
DRUGS - Nutrition and Weight Management
|
$56.30
|
-14.02
-19.94% |
$70.75
|
30,751,338
2,058.18% of 50 DAV
50 DAV is 1,494,100
|
$73.00
-22.88%
|
4/18/2012
|
$71.19
|
PP = $72.21
|
|
MB = $75.82
|
Most Recent Note - 5/1/2012 5:10:10 PM
Reported earnings +24% on +21% sales for the quarter ended March 31, 2012 versus the year ago period. After a weak start today its shares fell precipitously, violating its 50 DMA line, recent lows, and its 200 DMA line, triggering technical sell signals. Based on damaging action it will be dropped from the Featured Stocks list tonight. It did not trigger a recent buy signal, so disciplined investors avoided any setback.
>>> The latest Featured Stock Update with an annotated graph appeared on 4/13/2012. Click here.
View all notes |
Alert me of new notes |
CANSLIM.net Company Profile |
SEC |
Zacks Reports |
StockTalk |
News |
Chart |
Request a new note
C
A N
S L
I M
|
Symbol/Exchange
Company Name
Industry Group |
PRICE |
CHANGE
(%Change) |
Day High |
Volume
(% DAV)
(% 50 day avg vol) |
52 Wk Hi
% From Hi |
Featured
Date |
Price
Featured |
Pivot Featured |
|
Max Buy |
ISRG
-
NASDAQ
Intuitive Surgical Inc
HEALTH SERVICES - Medical Appliances and Equipment
|
$588.28
|
+10.08
1.74% |
$590.11
|
256,395
91.90% of 50 DAV
50 DAV is 279,000
|
$594.89
-1.11%
|
12/20/2011
|
$442.43
|
PP = $449.16
|
|
MB = $471.62
|
Most Recent Note - 4/26/2012 4:05:31 PM
G - Hovering near its all-time high with volume totals cooling since a considerable gap up gain on 4/18/12. It may produce more climactic gains, however it has not spent much time basing since its last "Featured Date" when highlighted in yellow on 12/23/11. Disciplined investors always limit losses if any stock falls -7% from their purchase price. It is on track for an 11th consecutive weekly gain.
>>> The latest Featured Stock Update with an annotated graph appeared on 3/1/2012. Click here.
View all notes |
Alert me of new notes |
CANSLIM.net Company Profile |
SEC |
Zacks Reports |
StockTalk |
News |
Chart |
Request a new note
C
A N
S L
I M
|
JAZZ
-
NASDAQ
Jazz Pharmaceuticals Plc
DRUGS - Biotechnology
|
$51.00
|
-0.03
-0.06% |
$51.53
|
652,972
62.40% of 50 DAV
50 DAV is 1,046,400
|
$54.50
-6.42%
|
4/27/2012
|
$51.93
|
PP = $51.39
|
|
MB = $53.96
|
Most Recent Note - 4/27/2012 6:07:32 PM
Y - Considerable gap up gain today backed by 4 times average volume, rising from a "double bottom" base and touching a new all-time high. Color code was changed to yellow and pivot point cited is based on its 4/10/12 high in the mid-day report. See the latest FSU analysis for more details and a new annotated graph.
>>> The latest Featured Stock Update with an annotated graph appeared on 4/27/2012. Click here.
View all notes |
Alert me of new notes |
CANSLIM.net Company Profile |
SEC |
Zacks Reports |
StockTalk |
News |
Chart |
Request a new note
C
A N
S L
I M
|
LULU
-
NASDAQ
Lululemon Athletica
MANUFACTURING - Textile Manufacturing
|
$76.05
|
+1.91
2.58% |
$76.87
|
1,965,669
98.84% of 50 DAV
50 DAV is 1,988,700
|
$77.13
-1.40%
|
5/1/2012
|
$76.05
|
PP = $77.23
|
|
MB = $81.09
|
Most Recent Note - 5/1/2012 6:40:35 PM
Y - Recently found prompt support at its 50 DMA line. The brief consolidation may be considered a new "square box" base. A subsequent gain above the new pivot point cited based on its 4/05/12 high plus 10 cents may trigger a new (or add-on) technical buy signal.
>>> The latest Featured Stock Update with an annotated graph appeared on 4/12/2012. Click here.
View all notes |
Alert me of new notes |
CANSLIM.net Company Profile |
SEC |
Zacks Reports |
StockTalk |
News |
Chart |
Request a new note
C
A N
S L
I M
|
MA
-
NYSE
Mastercard Inc Cl A
DIVERSIFIED SERVICES - Business/Management Services
|
$455.90
|
+3.63
0.80% |
$466.98
|
1,758,788
208.96% of 50 DAV
50 DAV is 841,700
|
$462.34
-1.39%
|
3/12/2012
|
$419.86
|
PP = $428.67
|
|
MB = $450.10
|
Most Recent Note - 5/1/2012 6:58:19 PM
G - Finished in the lower third of its intra-day range today after hitting new 52-week and all-time highs. Color code is changed to green after volume-driven gains lifted it beyond its "max buy" level. Last week it found support at its 50 DMA line.
>>> The latest Featured Stock Update with an annotated graph appeared on 4/11/2012. Click here.
View all notes |
Alert me of new notes |
CANSLIM.net Company Profile |
SEC |
Zacks Reports |
StockTalk |
News |
Chart |
Request a new note
C
A N
S L
I M
|
MELI
-
NASDAQ
Mercadolibre Inc
INTERNET - Internet Software and; Services
|
$99.34
|
+2.60
2.69% |
$101.35
|
700,274
148.84% of 50 DAV
50 DAV is 470,500
|
$104.50
-4.94%
|
5/1/2012
|
$99.34
|
PP = $102.98
|
|
MB = $108.13
|
Most Recent Note - 5/1/2012 6:55:15 PM
Y - Volume-driven gains helped it rebound above its 50 DMA line, improving its technical stance. A new pivot point is cited based on its 3/27/12 high after forming a "double bottom" base. There is limited resistance due to overhead supply up through the $104 level.
>>> The latest Featured Stock Update with an annotated graph appeared on 3/29/2012. Click here.
View all notes |
Alert me of new notes |
CANSLIM.net Company Profile |
SEC |
Zacks Reports |
StockTalk |
News |
Chart |
Request a new note
C
A N
S L
I M
|
Symbol/Exchange
Company Name
Industry Group |
PRICE |
CHANGE
(%Change) |
Day High |
Volume
(% DAV)
(% 50 day avg vol) |
52 Wk Hi
% From Hi |
Featured
Date |
Price
Featured |
Pivot Featured |
|
Max Buy |
MG
-
NYSE
Mistras Group Inc
DIVERSIFIED SERVICES - Bulding and Faci;ity Management Services
|
$23.07
|
-0.40
-1.70% |
$24.07
|
71,842
73.84% of 50 DAV
50 DAV is 97,300
|
$26.24
-12.08%
|
3/22/2012
|
$24.96
|
PP = $26.34
|
|
MB = $27.66
|
Most Recent Note - 4/30/2012 5:25:10 PM
G - Encountered distributional pressure today after a gap up, negatively reversing and closing near its 50 DMA line. The recent low ($22.60 on 4/19/12) defines the next near-term support above its 200 DMA line. Previously noted - "A volume-driven gain above its recent chart high ($25.49 on 3/21/12) may help trigger a proper technical buy signal after a new base formation, however no new (lower) pivot point is currently being cited, and it may continue encountering stubborn resistance."
>>> The latest Featured Stock Update with an annotated graph appeared on 4/2/2012. Click here.
View all notes |
Alert me of new notes |
CANSLIM.net Company Profile |
SEC |
Zacks Reports |
StockTalk |
News |
Chart |
Request a new note
C
A N
S L
I M
|
MKTX
-
NASDAQ
Marketaxess Holdings Inc
FINANCIAL SERVICES - Investment Brokerage - Nationa
|
$34.44
|
+0.13
0.38% |
$35.05
|
325,885
101.21% of 50 DAV
50 DAV is 322,000
|
$37.95
-9.25%
|
3/8/2012
|
$35.80
|
PP = $35.52
|
|
MB = $37.30
|
Most Recent Note - 4/30/2012 5:27:30 PM
G - Volume driven-gains would be a welcome sign after recent distributional action. Sank further below its 50 DMA line and below its pivot point with today's 4th consecutive loss and its color code is changed to green.
>>> The latest Featured Stock Update with an annotated graph appeared on 3/8/2012. Click here.
View all notes |
Alert me of new notes |
CANSLIM.net Company Profile |
SEC |
Zacks Reports |
StockTalk |
News |
Chart |
Request a new note
C
A N
S L
I M
|
NTES
-
NASDAQ
Netease Inc Adr
INTERNET - Internet Information Providers
|
$59.96
|
-0.36
-0.60% |
$60.42
|
673,374
102.04% of 50 DAV
50 DAV is 659,900
|
$61.45
-2.42%
|
3/19/2012
|
$56.18
|
PP = $55.10
|
|
MB = $57.86
|
Most Recent Note - 4/30/2012 5:46:43 PM
G - Overcame early weakness today and finished near the session high with a small gain for its second-best close ever. Recent lows and its 50 DMA line define support to watch in the $55 area.
>>> The latest Featured Stock Update with an annotated graph appeared on 3/27/2012. Click here.
View all notes |
Alert me of new notes |
CANSLIM.net Company Profile |
SEC |
Zacks Reports |
StockTalk |
News |
Chart |
Request a new note
C
A N
S L
I M
|
PCLN
-
NASDAQ
Priceline.Com Inc
INTERNET - Internet Software and Services
|
$755.17
|
-5.65
-0.74% |
$766.89
|
1,049,211
88.21% of 50 DAV
50 DAV is 1,189,500
|
$774.96
-2.55%
|
4/27/2012
|
$539.46
|
PP = $774.96
|
|
MB = $813.71
|
Most Recent Note - 4/27/2012 12:53:39 PM
Y - Gapped up today, rallying from support at its 50 DMA line to within close striking distance of its 52-week high. Color code is changed to yellow while rallying from its first test of its 10-week moving average (WMA) since breaking out above resistance in the $554 area in February. In the Certification they teach that after an earlier breakout a secondary buy point exists between the first successful test of the 10 WMA up to +5% above its latest high. The 2-week consolidation is not considered a sound base pattern, yet the pivot point cited is based on that recent high. Prior mid-day reports noted - "Technically, it broke out on 2/13/12 with a volume-driven gain, and now it is getting extended from its prior base. Fundamentals have remained strong since dropped from the Featured Stocks list on 9/29/11. Patient investors may watch for secondary buy points to possibly develop and be noted."
>>> The latest Featured Stock Update with an annotated graph appeared on 9/22/2011. Click here.
View all notes |
Alert me of new notes |
CANSLIM.net Company Profile |
SEC |
Zacks Reports |
StockTalk |
News |
Chart |
Request a new note
C
A N
S L
I M
|
RAX
-
NYSE
Rackspace Hosting Inc
INTERNET - Internet Software and; Services
|
$58.55
|
+0.46
0.79% |
$59.90
|
1,105,817
64.76% of 50 DAV
50 DAV is 1,707,500
|
$60.00
-2.42%
|
4/26/2012
|
$58.39
|
PP = $59.53
|
|
MB = $62.51
|
Most Recent Note - 5/1/2012 7:00:46 PM
Y - Holding its ground within close striking distance of its 52-week high. Color code was recently changed to yellow with new pivot point cited based on its 3/27/12 high plus 10 cents following a 5-week consolidation. Volume-driven gains for new highs may trigger a new (or add-on) technical buy signal.
>>> The latest Featured Stock Update with an annotated graph appeared on 4/10/2012. Click here.
View all notes |
Alert me of new notes |
CANSLIM.net Company Profile |
SEC |
Zacks Reports |
StockTalk |
News |
Chart |
Request a new note
C
A N
S L
I M
|
Symbol/Exchange
Company Name
Industry Group |
PRICE |
CHANGE
(%Change) |
Day High |
Volume
(% DAV)
(% 50 day avg vol) |
52 Wk Hi
% From Hi |
Featured
Date |
Price
Featured |
Pivot Featured |
|
Max Buy |
RGR
-
NYSE
Sturm Ruger & Co Inc
CONSUMER DURABLES - Sporting Goods
|
$55.14
|
-1.93
-3.38% |
$58.42
|
1,165,278
263.34% of 50 DAV
50 DAV is 442,500
|
$57.70
-4.44%
|
3/22/2012
|
$46.49
|
PP = $46.78
|
|
MB = $49.12
|
Most Recent Note - 5/1/2012 6:43:07 PM
G - After touching another new 52-week high today there was a negative reversal for a loss with heavy volume indicative of distributional pressure. It is extended from any sound base and the 50 DMA line defines support to watch on pullbacks.
>>> The latest Featured Stock Update with an annotated graph appeared on 3/22/2012. Click here.
View all notes |
Alert me of new notes |
CANSLIM.net Company Profile |
SEC |
Zacks Reports |
StockTalk |
News |
Chart |
Request a new note
C
A N
S L
I M
|
RNF
-
NYSE
Rentech Nitrogen Ptnr Lp
CHEMICALS - Agricultural Chemicals
|
$29.35
|
-0.12
-0.41% |
$29.90
|
437,729
194.55% of 50 DAV
50 DAV is 225,000
|
$30.39
-3.43%
|
4/27/2012
|
$29.32
|
PP = $28.60
|
|
MB = $30.03
|
Most Recent Note - 5/1/2012 12:30:13 PM
Y - Hovering near its 52-week high today, pausing after 5 consecutive gains on ever-increasing volume. The recent orderly consolidation in a tight range was longer than a "3-weeks tight" base pattern and RNF was highlighted in yellow in the 4/27/12 mid-day breakouts report (read here) when rallying above the pivot point cited based on its 4/12/12 high plus 10 cents. It has sufficient ranks and showed strong earnings increases satisfying the C criteria. Its 11/04/11 IPO was priced at $20, and its limited history is a concern.
There are no Featured Stock Updates™ available for this stock at this time. You may request one by clicking the Request a New Note link below
View all notes |
Alert me of new notes |
CANSLIM.net Company Profile |
SEC |
Zacks Reports |
StockTalk |
News |
Chart |
Request a new note
C
A N
S L
I M
|
RRTS
-
NYSE
Roadrunner Trans Systems
TRANSPORTATION - Air Delivery and Freight Service
|
$17.40
|
+0.05
0.29% |
$17.58
|
145,985
153.67% of 50 DAV
50 DAV is 95,000
|
$18.59
-6.40%
|
2/10/2012
|
$17.40
|
PP = $17.50
|
|
MB = $18.38
|
Most Recent Note - 4/30/2012 5:31:03 PM
G - Up today with heavy volume, rising toward its 50 DMA line which recently acted as resistance. Subsequent deterioration below the prior low ($16.65 on 4/10/12) would raise more serious concerns and trigger more worrisome sell signals.
>>> The latest Featured Stock Update with an annotated graph appeared on 4/9/2012. Click here.
View all notes |
Alert me of new notes |
CANSLIM.net Company Profile |
SEC |
Zacks Reports |
StockTalk |
News |
Chart |
Request a new note
C
A N
S L
I M
|
SHFL
-
NASDAQ
Shuffle Master Inc
MANUFACTURING - Diversified Machinery
|
$17.15
|
-0.52
-2.94% |
$17.88
|
550,938
81.83% of 50 DAV
50 DAV is 673,300
|
$18.77
-8.63%
|
3/6/2012
|
$17.07
|
PP = $15.25
|
|
MB = $16.01
|
Most Recent Note - 4/30/2012 12:57:36 PM
G - Its consolidation is not a sufficient length to be considered a sound new base pattern. It already has tested support at its 10-week moving average line multiple times this year, so it may not be considered an ideal "secondary buy point" now.
>>> The latest Featured Stock Update with an annotated graph appeared on 3/15/2012. Click here.
View all notes |
Alert me of new notes |
CANSLIM.net Company Profile |
SEC |
Zacks Reports |
StockTalk |
News |
Chart |
Request a new note
C
A N
S L
I M
|
SHOO
-
NASDAQ
Steven Madden Limited
CONSUMER NON-DURABLES - Textile - Apparel Footwear
|
$43.20
|
-0.01
-0.02% |
$44.16
|
714,355
208.21% of 50 DAV
50 DAV is 343,100
|
$45.70
-5.47%
|
4/27/2012
|
$43.20
|
PP = $45.32
|
|
MB = $47.59
|
Most Recent Note - 4/27/2012 1:11:00 PM
Y - Color code is changed to yellow with pivot point cited based on its 3/26/12 high while it is still working on a "double bottom" base pattern. Sales revenues showed impressive acceleration in the Jun, Sep, and Dec '11 quarterly comparisons with earnings increases above the +25% minimum guideline in the 2 latest comparisons. Subsequent volume-driven gains above the pivot point may trigger a technical buy signal, meanwhile it is ideal for investors' watchlists.
>>> The latest Featured Stock Update with an annotated graph appeared on 1/4/2011. Click here.
View all notes |
Alert me of new notes |
CANSLIM.net Company Profile |
SEC |
Zacks Reports |
StockTalk |
News |
Chart |
Request a new note
C
A N
S L
I M
|
Symbol/Exchange
Company Name
Industry Group |
PRICE |
CHANGE
(%Change) |
Day High |
Volume
(% DAV)
(% 50 day avg vol) |
52 Wk Hi
% From Hi |
Featured
Date |
Price
Featured |
Pivot Featured |
|
Max Buy |
SWI
-
NYSE
Solarwinds Inc
COMPUTER SOFTWARE and SERVICES - Application Software
|
$46.69
|
-0.22
-0.47% |
$47.34
|
1,060,136
97.07% of 50 DAV
50 DAV is 1,092,100
|
$47.66
-2.04%
|
4/26/2012
|
$45.15
|
PP = $42.32
|
|
MB = $44.44
|
Most Recent Note - 4/27/2012 6:58:59 PM
G - Color code is changed to green after getting more extended from its prior highs with today's 3rd consecutive volume-driven gain. The volume-driven gain to new highs triggered a new buy signal on 4/26/12 as it was featured in the mid-day report and noted - "Reported earnings +43% on +39% sales revenues for the quarter ended March 31, 2012 versus the year ago period. It held its ground stubbornly after violating its 50 DMA line when a damaging loss with above average volume triggered technical sell signals on 4/10/12 and it was dropped from the Featured Stocks list. Earnings below the +25% guideline for the Dec '11 quarter (+21%) had also raised fundamental concerns at that time, however the stock's resilience and impressive acceleration means that 3 of the past 4 quarterly comparisons are now above the minimum guideline concerning the C criteria. Its annual earnings (A criteria) history has been strong."
>>> The latest Featured Stock Update with an annotated graph appeared on 3/16/2012. Click here.
View all notes |
Alert me of new notes |
CANSLIM.net Company Profile |
SEC |
Zacks Reports |
StockTalk |
News |
Chart |
Request a new note
C
A N
S L
I M
|
SXCI
-
NASDAQ
S X C Health Solutions
COMPUTER SOFTWARE and SERVICES - Healthcare Information Service
|
$91.22
|
+0.64
0.71% |
$91.79
|
539,969
58.81% of 50 DAV
50 DAV is 918,200
|
$100.50
-9.23%
|
2/23/2012
|
$68.24
|
PP = $66.05
|
|
MB = $69.35
|
Most Recent Note - 4/30/2012 5:54:28 PM
G - Consolidating -9.9% off its all-time high today, very extended from its prior base. The market cheered the 4/18/12 news it will acquire and merge with Catalyst Health Solutions Inc (CHSI), rallying with volume-driven gains.
>>> The latest Featured Stock Update with an annotated graph appeared on 3/6/2012. Click here.
View all notes |
Alert me of new notes |
CANSLIM.net Company Profile |
SEC |
Zacks Reports |
StockTalk |
News |
Chart |
Request a new note
C
A N
S L
I M
|
TDG
-
NYSE
Transdigm Group Inc
AEROSPACE/DEFENSE - Aerospace/Defense Products and; Services
|
$127.07
|
+0.95
0.75% |
$128.00
|
488,681
118.12% of 50 DAV
50 DAV is 413,700
|
$128.29
-0.95%
|
2/29/2012
|
$120.10
|
PP = $118.93
|
|
MB = $124.88
|
Most Recent Note - 5/1/2012 6:52:02 PM
G - Color code is changed to green after rallying beyond its "max buy" level with above average volume behind its 4th gain in the span of 5 sessions. Prior highs in the $118-121 area define initial chart support to watch on pullbacks.
>>> The latest Featured Stock Update with an annotated graph appeared on 3/30/2012. Click here.
View all notes |
Alert me of new notes |
CANSLIM.net Company Profile |
SEC |
Zacks Reports |
StockTalk |
News |
Chart |
Request a new note
C
A N
S L
I M
|
TIBX
-
NASDAQ
Tibco Software Inc
COMPUTER SOFTWARE and SERVICES - Business Software and Services
|
$33.03
|
+0.13
0.40% |
$33.69
|
1,590,361
54.48% of 50 DAV
50 DAV is 2,919,000
|
$34.67
-4.73%
|
3/30/2012
|
$31.01
|
PP = $31.25
|
|
MB = $32.81
|
Most Recent Note - 4/26/2012 4:01:26 PM
G - Up today for a 2nd consecutive gain on lighter volume. Traded under its "max buy" level this week yet found support above prior highs in the $31 area and its 50 DMA line. More damaging losses would raise serious concerns.
>>> The latest Featured Stock Update with an annotated graph appeared on 4/5/2012. Click here.
View all notes |
Alert me of new notes |
CANSLIM.net Company Profile |
SEC |
Zacks Reports |
StockTalk |
News |
Chart |
Request a new note
C
A N
S L
I M
|
TNGO
-
NASDAQ
Tangoe Inc
COMPUTER SOFTWARE and SERVICES - Technical and System Software
|
$21.35
|
+0.87
4.25% |
$21.56
|
348,123
57.13% of 50 DAV
50 DAV is 609,400
|
$21.74
-1.79%
|
3/27/2012
|
$19.35
|
PP = $20.00
|
|
MB = $21.00
|
Most Recent Note - 5/1/2012 6:17:37 PM
G - Up today on light volume, closing above its "max buy" level and its color code is changed to green. Recently found support near prior highs in the $20 area previously noted as initial support to watch on pullbacks following its 4/19/12 breakout. The 50 DMA line defines important support to watch.
>>> The latest Featured Stock Update with an annotated graph appeared on 4/3/2012. Click here.
View all notes |
Alert me of new notes |
CANSLIM.net Company Profile |
SEC |
Zacks Reports |
StockTalk |
News |
Chart |
Request a new note
C
A N
S L
I M
|
Symbol/Exchange
Company Name
Industry Group |
PRICE |
CHANGE
(%Change) |
Day High |
Volume
(% DAV)
(% 50 day avg vol) |
52 Wk Hi
% From Hi |
Featured
Date |
Price
Featured |
Pivot Featured |
|
Max Buy |
TSCO
-
NASDAQ
Tractor Supply Co
SPECIALTY RETAIL - Specialty Retail, Other
|
$98.38
|
-0.03
-0.03% |
$99.91
|
560,748
73.18% of 50 DAV
50 DAV is 766,300
|
$101.20
-2.79%
|
5/1/2012
|
$98.38
|
PP = $101.30
|
|
MB = $106.37
|
Most Recent Note - 5/1/2012 6:20:55 PM
Y - Color code is changed to yellow with new pivot point cited based on its 4/19/12 high plus 10 cents after forming an advanced "3-weeks tight" base pattern. Volume-driven gains to new highs may trigger a new (or add-on) technical buy signal. Its 50 DMA line defines support to watch on pullbacks.
>>> The latest Featured Stock Update with an annotated graph appeared on 4/17/2012. Click here.
View all notes |
Alert me of new notes |
CANSLIM.net Company Profile |
SEC |
Zacks Reports |
StockTalk |
News |
Chart |
Request a new note
C
A N
S L
I M
|
UA
-
NYSE
Under Armour Inc Cl A
CONSUMER NON-DURABLES - Textile - Apparel Clothing
|
$98.31
|
+0.38
0.39% |
$99.44
|
963,085
100.58% of 50 DAV
50 DAV is 957,500
|
$102.86
-4.42%
|
2/15/2012
|
$85.77
|
PP = $84.86
|
|
MB = $89.10
|
Most Recent Note - 5/1/2012 6:23:25 PM
G - Remains perched above its 50 DMA line very near its all-time high. No overhead supply remains to act as resistance, however no new pivot point was cited following its latest base. Concerns were raised by weaker fundamentals. Reported earnings +22% on +23% sales revenues for the quarter ended March 31, 2012 versus the year ago period, its first quarterly earnings increase below the +25% minimum guideline in more than 2 years.
>>> The latest Featured Stock Update with an annotated graph appeared on 4/4/2012. Click here.
View all notes |
Alert me of new notes |
CANSLIM.net Company Profile |
SEC |
Zacks Reports |
StockTalk |
News |
Chart |
Request a new note
C
A N
S L
I M
|
UBNT
-
NASDAQ
Ubiquiti Networks Inc
TELECOMMUNICATIONS - Diversified Communication Serv
|
$35.00
|
+1.98
6.00% |
$35.99
|
1,254,000
332.80% of 50 DAV
50 DAV is 376,800
|
$35.32
-0.91%
|
4/12/2012
|
$33.89
|
PP = $34.07
|
|
MB = $35.77
|
Most Recent Note - 5/1/2012 6:26:05 PM
Y - Hit a new 52-week high with today's gain backed by more than 3 times average volume confirming a technical buy signal. Volume-driven gains helped it rally above the pivot point of the previously noted advanced "ascending base" pattern. Prior low ($30.25 on 4/09/12) defines initial support above its 50 DMA line.
>>> The latest Featured Stock Update with an annotated graph appeared on 4/20/2012. Click here.
View all notes |
Alert me of new notes |
CANSLIM.net Company Profile |
SEC |
Zacks Reports |
StockTalk |
News |
Chart |
Request a new note
C
A N
S L
I M
|
ULTA
-
NASDAQ
Ulta Salon Cosm & Frag
SPECIALTY RETAIL - Specialty Retail, Other
|
$89.08
|
+0.90
1.02% |
$90.65
|
418,344
61.33% of 50 DAV
50 DAV is 682,100
|
$96.65
-7.83%
|
1/11/2012
|
$71.97
|
PP = $75.80
|
|
MB = $79.59
|
Most Recent Note - 5/1/2012 6:28:53 PM
G - After its damaging loss violating its 50 DMA line on 4/24/12 raised concerns and triggered a technical sell signal that short-term average has been acting as resistance. Prior highs in the $75 area are the next important support level to watch.
>>> The latest Featured Stock Update with an annotated graph appeared on 4/23/2012. Click here.
View all notes |
Alert me of new notes |
CANSLIM.net Company Profile |
SEC |
Zacks Reports |
StockTalk |
News |
Chart |
Request a new note
C
A N
S L
I M
|
V
-
NYSE
Visa Inc Cl A
DIVERSIFIED SERVICES - Business/Management Services
|
$123.09
|
+0.11
0.09% |
$125.35
|
4,295,134
141.51% of 50 DAV
50 DAV is 3,035,300
|
$124.21
-0.90%
|
3/12/2012
|
$116.53
|
PP = $119.46
|
|
MB = $125.43
|
Most Recent Note - 4/26/2012 4:07:37 PM
Y - Gain today on light volume helped it finish a penny below its best-ever close. Found support near its 50 DMA line this week. Sputtering since its 4/13/12 gain backed by +49% above average volume technically confirmed a buy signal. Its 50 DMA line defines support to watch well above prior highs in the $103-104 area.
>>> The latest Featured Stock Update with an annotated graph appeared on 3/7/2012. Click here.
View all notes |
Alert me of new notes |
CANSLIM.net Company Profile |
SEC |
Zacks Reports |
StockTalk |
News |
Chart |
Request a new note
C
A N
S L
I M
|
Symbol/Exchange
Company Name
Industry Group |
PRICE |
CHANGE
(%Change) |
Day High |
Volume
(% DAV)
(% 50 day avg vol) |
52 Wk Hi
% From Hi |
Featured
Date |
Price
Featured |
Pivot Featured |
|
Max Buy |
VMW
-
NYSE
Vmware Inc Cl A
COMPUTER SOFTWARE andamp; SERVICES - Technical andamp; System Software
|
$112.63
|
+0.91
0.81% |
$113.88
|
1,287,386
81.16% of 50 DAV
50 DAV is 1,586,300
|
$118.79
-5.19%
|
4/18/2012
|
$110.04
|
PP = $115.29
|
|
MB = $121.05
|
Most Recent Note - 4/26/2012 3:40:08 PM
Y - Color code is changed to yellow after promptly repairing a brief 50 DMA line breach, technically showing signs it attracted institutional support near that important short-term average. Reported +38% earnings on +25% sales revenues for the quarter ended March 31, 2012 versus the year ago period.
>>> The latest Featured Stock Update with an annotated graph appeared on 4/18/2012. Click here.
View all notes |
Alert me of new notes |
CANSLIM.net Company Profile |
SEC |
Zacks Reports |
StockTalk |
News |
Chart |
Request a new note
C
A N
S L
I M
|
VSI
-
NYSE
Vitamin Shoppe Inc
SPECIALTY RETAIL - Specialty Retail, Other
|
$45.90
|
-1.17
-2.49% |
$47.67
|
798,254
241.09% of 50 DAV
50 DAV is 331,100
|
$49.05
-6.42%
|
4/25/2012
|
$47.77
|
PP = $48.46
|
|
MB = $50.88
|
Most Recent Note - 5/1/2012 6:46:46 PM
Y - Encountered more damaging distributional pressure and finished near the session low today with volume more than 2 times average as it retreated from its 52-week high and pivot point. Did not trigger a technical buy signal since last week when its color code was changed to yellow with pivot point based on its 7/05/11 high after a near 10-month cup shaped base.
>>> The latest Featured Stock Update with an annotated graph appeared on 4/25/2012. Click here.
View all notes |
Alert me of new notes |
CANSLIM.net Company Profile |
SEC |
Zacks Reports |
StockTalk |
News |
Chart |
Request a new note
C
A N
S L
I M
|