You are not logged in.
This means you
CAN ONLY VIEW reports that were published prior to Monday, April 14, 2025.
You
MUST UPGRADE YOUR MEMBERSHIP if you want to see any current reports.
AFTER MARKET UPDATE - WEDNESDAY, APRIL 30TH, 2014
Previous After Market Report Next After Market Report >>>
|
|
|
|
DOW |
+45.47 |
16,580.84 |
+0.27% |
|
Volume |
892,164,890 |
+23% |
|
Volume |
1,909,415,910 |
+7% |
|
NASDAQ |
+11.02 |
4,114.56 |
+0.27% |
|
Advancers |
2,045 |
65% |
|
Advancers |
1,557 |
55% |
|
S&P 500 |
+5.62 |
1,883.95 |
+0.30% |
|
Decliners |
1,016 |
32% |
|
Decliners |
1,202 |
42% |
|
Russell 2000 |
+6.03 |
1,126.86 |
+0.54% |
|
52 Wk Highs |
103 |
|
|
52 Wk Highs |
44 |
|
|
S&P 600 |
+3.71 |
651.97 |
+0.57% |
|
52 Wk Lows |
37 |
|
|
52 Wk Lows |
72 |
|
|
 |
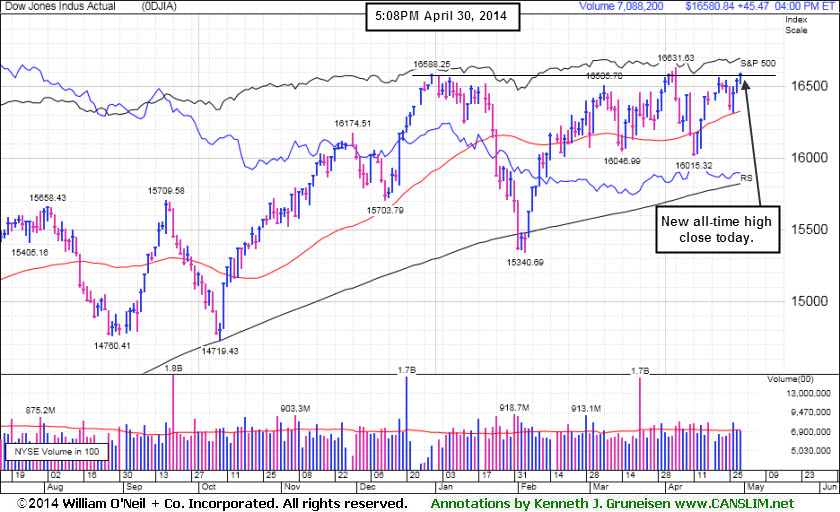
Dow Jones Industrial Average Finished at Best Ever Close
Kenneth J. Gruneisen - Passed the CAN SLIM® Master's Exam
For the month, the Dow was up +0.8%; the S&P 500 climbed +0.6% while the NASDAQ lost -2%. The indices rose on Wednesday’s session with volume totals higher than the prior session totals on the Nasdaq exchange and on the NYSE. Advancers led decliners by a 2-1 margin on the NYSE and by a narrower 5-4 margin on the Nasdaq exchange. There were 21 high-ranked companies from the CANSLIM.net Leaders List that made new 52-week highs and appeared on the CANSLIM.net BreakOuts Page, up from the total of 15 stocks on the prior session. New 52-week highs outnumbered new 52-week lows on the NYSE while new lows outnumbered new highs on the Nasdaq exchange. There were gains all 6 of the high-ranked companies currently included on the Featured Stocks Page. The Dow Jones Industrial Average's new all-time high close arguably suggests that the Market (M criteria) is back in a confirmed uptrend. New buying effort should be selective and only focused in stocks meeting all key criteria of the fact-based investment system. Keep in mind that any sustained and meaningful market advance requires leadership - a healthy crop of stocks hitting new 52-week highs.
The major averages finished higher following the Fed's policy meeting. As expected, the central bank trimmed its monthly asset purchases to $45 billion, citing indications the economy is gaining momentum. Stocks were mixed leading into the Fed statement as investors weighed the latest data releases. Before the open, first-quarter GDP grew +0.1% versus a projected +1.2% increase. Additional reports showed employers added 220,000 jobs in April and manufacturing activity expanded at a faster pace this month.
On the earnings front, Time Warner (TWC +0.09%) edged higher after profits topped estimates. Twitter (TWTR -8.56%) fell hard amid disappointment in first-quarter user growth. EBay (EBAY -4.97%) declined after reducing its sales forecast.
Materials were the best performing on session. Coal producer Peabody Energy (BTU +2.48%). M&A news provided a tailwind to the utilities sector. Pepco Holdings (POM +17.4%) after agreeing to be acquired by Exelon (EXC -3.18%) for $6.8 billion. Energy was the lone group lower as Chevron (CVX -0.36%) ended with a small loss.
Treasuries advanced with the 10-year note up 11/32 to yield 2.65%.
The CANSLIM.net Featured Stocks Page shows the most action-worthy candidates and their latest notes and a Headline Link directs members to the latest detailed analysis with data-packed graphs annotated by a Certified expert along with links to additional resources. The Premium Member Homepage includes "dynamic archives" to all prior pay reports published. Watch for an announcement via email concerning the next WEBCAST.
PICTURED: The Dow Jones Industrial Average managed a new all-time high close.
|
 Kenneth J. Gruneisen started out as a licensed stockbroker in August 1987, a couple of months prior to the historic stock market crash that took the Dow Jones Industrial Average down -22.6% in a single day. He has published daily fact-based fundamental and technical analysis on high-ranked stocks online for two decades. Through FACTBASEDINVESTING.COM, Kenneth provides educational articles, news, market commentary, and other information regarding proven investment systems that work in good times and bad.
Comments contained in the body of this report are technical opinions only and are not necessarily those of Gruneisen Growth Corp. The material herein has been obtained from sources believed to be reliable and accurate, however, its accuracy and completeness cannot be guaranteed. Our firm, employees, and customers may effect transactions, including transactions contrary to any recommendation herein, or have positions in the securities mentioned herein or options with respect thereto. Any recommendation contained in this report may not be suitable for all investors and it is not to be deemed an offer or solicitation on our part with respect to the purchase or sale of any securities. |
|
 |
Financial, Tech, and Energy-Related Groups Rose
Kenneth J. Gruneisen - Passed the CAN SLIM® Master's Exam
The Broker/Dealer Index ($XBD +0.94%) posted a solid gain and the Bank Index ($BKX +0.25%) edged higher while the Retail Index ($RLX +0.08%) finished flat. The Semiconductor Index ($SOX +0.52%) and the Biotechnology Index ($BTK +0.81%) posted modest gains and the Networking Index ($NWX +0.21%) inched higher. The Integrated Oil Index ($XOI +0.13%) and the Oil Services Index ($OSX +0.47%) also had a slightly positive bias. Meanwhile, the Gold & Silver Index ($XAU -0.67%) was a laggard as it edged lower.
Charts courtesy www.stockcharts.com
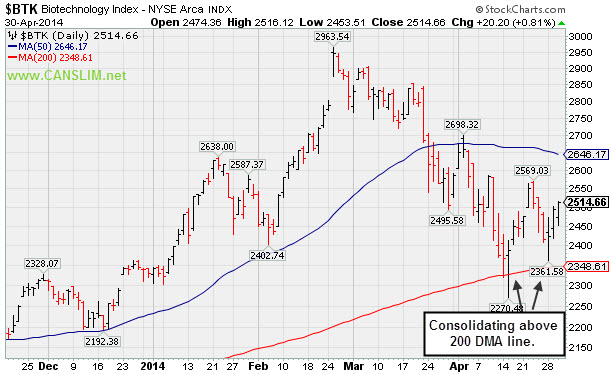
PICTURED: The Biotechnology Index ($BTK +0.81%) is consolidating above its 200-day moving average (DMA) line.
| Oil Services |
$OSX |
294.02 |
+1.37 |
+0.47% |
+4.62% |
| Integrated Oil |
$XOI |
1,610.69 |
+2.16 |
+0.13% |
+7.16% |
| Semiconductor |
$SOX |
575.97 |
+2.98 |
+0.52% |
+7.65% |
| Networking |
$NWX |
328.25 |
+0.69 |
+0.21% |
+1.33% |
| Broker/Dealer |
$XBD |
155.80 |
+1.45 |
+0.94% |
-2.96% |
| Retail |
$RLX |
858.45 |
+0.68 |
+0.08% |
-8.66% |
| Gold & Silver |
$XAU |
92.26 |
-0.62 |
-0.67% |
+9.64% |
| Bank |
$BKX |
68.43 |
+0.17 |
+0.25% |
-1.20% |
| Biotech |
$BTK |
2,514.66 |
+20.20 |
+0.81% |
+7.91% |
|
|
|
 |
Finished Near Session Lows After Encountering Distributional Pressure
Kenneth J. Gruneisen - Passed the CAN SLIM® Master's Exam
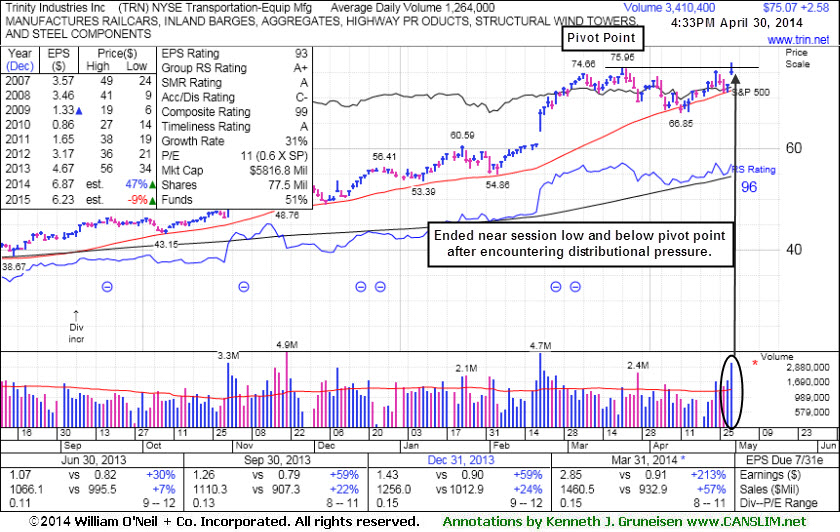
Trinity Industries Inc (TRN +$3.08 or +4.24% to $75.57) was highlighted in yellow with pivot point cited based on its 3/21/14 high plus 10 cents in the earlier mid-day report (read here). It gapped up today hitting a new 52-week high but finished near the session low after encountering distributional pressure. A strong close above the pivot point could have clinched a technical buy signal.
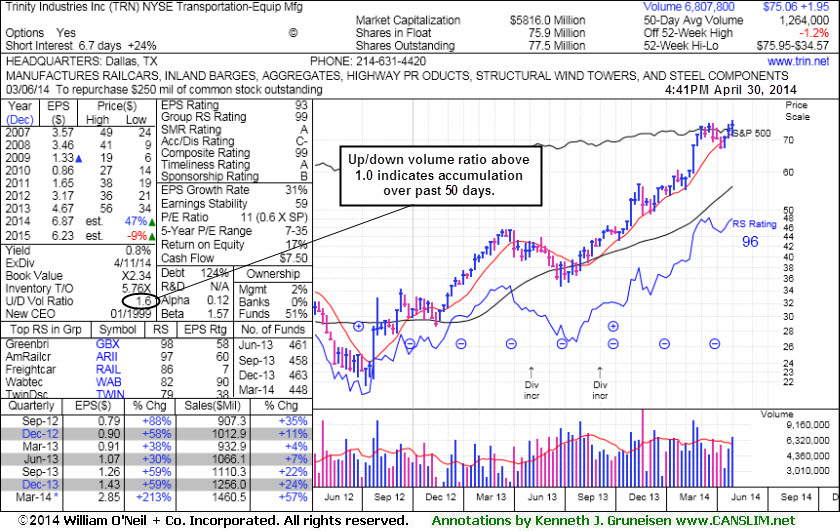
The Transportation - Equipment Manufacturing firm reported earnings +213% on +57% sales revenues for the Mar '14 quarter, and prior quarterly comparisons were above the +25% minimum earnings guideline (C criteria). Annual earnings (A criteria) have improved following a downturn in FY '08-10. It found support at its 50-day moving average (DMA) line recently while making gradual progress. Its current Up/Down Volume Ratio of 1.6 is an unbiased indication that its shares have been under accumulation over the past 50 days.
|
|
|
Color Codes Explained :
Y - Better candidates highlighted by our
staff of experts.
G - Previously featured
in past reports as yellow but may no longer be buyable under the
guidelines.
***Last / Change / Volume data in this table is the closing quote data***
Symbol/Exchange
Company Name
Industry Group |
PRICE |
CHANGE
(%Change) |
Day High |
Volume
(% DAV)
(% 50 day avg vol) |
52 Wk Hi
% From Hi |
Featured
Date |
Price
Featured |
Pivot Featured |
|
Max Buy |
EQM
-
NYSE
E Q T Midstream Partners
ENERGY - Oil and Gas Pipelines
|
$77.03
|
+1.39
1.84% |
$77.12
|
55,855
51.72% of 50 DAV
50 DAV is 108,000
|
$77.77
-0.95%
|
12/12/2013
|
$53.17
|
PP = $56.51
|
|
MB = $59.34
|
 Most Recent Note - 4/30/2014 6:07:58 PM
G - Posted a gain with light volume today for a best-ever close. Its 50 DMA line ($69.43) defines near-term support where a violation may trigger a technical sell signal.
>>> FEATURED STOCK ARTICLE : Stength Contiunues; Earnings Below +25% Minimum Guideline for a 2nd Quarter - 4/28/2014
View all notes |
Set NEW NOTE alert |
CANSLIM.net Company Profile |
SEC
News |
Chart |
Request a new note
C
A N
S L
I M


|
GNRC
-
NYSE
Generac Hldgs Inc
Electrical-Power/Equipmt
|
$58.88
|
+0.32
0.55% |
$59.26
|
960,899
164.54% of 50 DAV
50 DAV is 584,000
|
$62.50
-5.79%
|
2/14/2014
|
$56.50
|
PP = $57.39
|
|
MB = $60.26
|
Most Recent Note - 4/30/2014 6:10:09 PM
Y - Posted a small gain today with above average volume. Finding support near its 50 DMA line. More damaging losses below its recent low ($55.27 on 4/14/14) would raise greater concerns.
>>> FEATURED STOCK ARTICLE : Finished Just Below its 50-Day Average Line - 4/11/2014
View all notes |
Set NEW NOTE alert |
CANSLIM.net Company Profile |
SEC
News |
Chart |
Request a new note
C
A N
S L
I M
|
ICON
-
NASDAQ
Iconix Brand Group Inc
CONSUMER NON-DURABLES - Textile - Apparel Footwear
|
$42.50
|
+2.68
6.73% |
$42.50
|
982,221
170.52% of 50 DAV
50 DAV is 576,000
|
$42.47
0.08%
|
4/30/2014
|
$42.50
|
PP = $42.57
|
|
MB = $44.70
|
Most Recent Note - 4/30/2014 6:06:31 PM
Y - Reported earnings +33% on +11% sales revenues for the Mar '14 quarter, continuing its strong earnings track record satisfying the C criteria. Finished at the session high and a new 52-week high today with a considerable volume-driven gain. No resistance remains due to overhead supply. Color code is changed to yellow with new pivot point cited based on its 3/06/14 high plus 10 cents. Finished near the new pivot point, and confirming gains with above average volume could trigger a new technical buy signal.
>>> FEATURED STOCK ARTICLE : Rebound Above 50-Day Average Needed to Improve Outlook - 4/24/2014
View all notes |
Set NEW NOTE alert |
CANSLIM.net Company Profile |
SEC
News |
Chart |
Request a new note
C
A N
S L
I M
|
PSIX
-
NASDAQ
Power Solutions Intl Inc
Machinery-Gen Industrial
|
$82.75
|
+1.25
1.53% |
$83.07
|
62,687
89.55% of 50 DAV
50 DAV is 70,000
|
$87.40
-5.32%
|
2/28/2014
|
$74.65
|
PP = $76.93
|
|
MB = $80.78
|
Most Recent Note - 4/29/2014 5:36:40 PM
G- Stubbornly holding its ground perched within close striking distance of its 52-week high. The recent low ($66.03 on 4/07/14) defines important near-term support below the 50 DMA line where further deterioration would raise greater concerns.
>>> FEATURED STOCK ARTICLE : Halted Slide After Slump Below 50-Day Moving Average - 4/14/2014
View all notes |
Set NEW NOTE alert |
CANSLIM.net Company Profile |
SEC
News |
Chart |
Request a new note
C
A N
S L
I M
|
TRN
-
NYSE
Trinity Industries Inc
TRANSPORTATION - Railroads
|
$75.06
|
+2.57
3.55% |
$77.00
|
3,518,988
278.40% of 50 DAV
50 DAV is 1,264,000
|
$75.95
-1.17%
|
4/30/2014
|
$75.57
|
PP = $76.05
|
|
MB = $79.85
|
Most Recent Note - 4/30/2014 6:00:04 PM
Y - It was highlighted in yellow with pivot point cited based on its 3/21/14 high plus 10 cents in the earlier mid-day report (read here). Gapped up today hitting a new 52-week high but failed to close above the pivot point and clinch a technical buy signal. Reported earnings +213% on +57% sales revenues for the Mar '14 quarter, and prior quarterly comparisons were above the +25% minimum earnings guideline (C criteria). Annual earnings (A criteria) have improved following a downturn in FY '08-10. Found support at its 50 DMA line while making gradual progress. See the latest FSU analysis for more details and new annotated graphs.
>>> FEATURED STOCK ARTICLE : Finished Near Session Lows After Encountering Distributional Pressure - 4/30/2014
View all notes |
Set NEW NOTE alert |
CANSLIM.net Company Profile |
SEC
News |
Chart |
Request a new note
C
A N
S L
I M
|
Symbol/Exchange
Company Name
Industry Group |
PRICE |
CHANGE
(%Change) |
Day High |
Volume
(% DAV)
(% 50 day avg vol) |
52 Wk Hi
% From Hi |
Featured
Date |
Price
Featured |
Pivot Featured |
|
Max Buy |
WLK
-
NYSE
Westlake Chemical Corp
CHEMICALS - Specialty Chemicals
|
$71.20
|
+0.67
0.95% |
$71.48
|
1,183,380
177.68% of 50 DAV
50 DAV is 666,000
|
$73.38
-2.97%
|
4/29/2014
|
$72.79
|
PP = $69.31
|
|
MB = $72.78
|
Most Recent Note - 4/30/2014 12:43:10 PM
Y - Highlighted in yellow with pivot point cited based on its 4/04/14 high in the 4/29/14 mid-day report (read here). The plastics maker separated its ethylene assets into a tax-advantaged partnership in which it plans to sell shares to the public. Holding its ground today, it gapped up and tallied a considerable gain with more than 4 times average volume for a new 52-week high on the prior session triggering a technical buy signal while rallying from a "double bottom" base. Quarterly earnings increases have been above the +25% minimum (C criteria) in comparisons through Dec '13. Keep in mind that 3 out of 4 stocks tend to move in the same direction of the major averages (M criteria) and confirming gains from the major averages are still needed as reassurance the broader market is strong. See the latest FSU analysis for more details and new annotated graphs.
>>> FEATURED STOCK ARTICLE : Technical Breakout From Double Bottom Base Pattern - 4/29/2014
View all notes |
Set NEW NOTE alert |
CANSLIM.net Company Profile |
SEC
News |
Chart |
Request a new note
C
A N
S L
I M
|
|
|
|
THESE ARE NOT BUY RECOMMENDATIONS!
Comments contained in the body of this report are technical
opinions only. The material herein has been obtained
from sources believed to be reliable and accurate, however,
its accuracy and completeness cannot be guaranteed.
This site is not an investment advisor, hence it does
not endorse or recommend any securities or other investments.
Any recommendation contained in this report may not
be suitable for all investors and it is not to be deemed
an offer or solicitation on our part with respect to
the purchase or sale of any securities. All trademarks,
service marks and trade names appearing in this report
are the property of their respective owners, and are
likewise used for identification purposes only.
This report is a service available
only to active Paid Premium Members.
You may opt-out of receiving report notifications
at any time. Questions or comments may be submitted
by writing to Premium Membership Services 665 S.E. 10 Street, Suite 201 Deerfield Beach, FL 33441-5634 or by calling 1-800-965-8307
or 954-785-1121.
|
|
|

