***Last / Change / Volume data in this table is the closing quote data***
Symbol/Exchange
Company Name
Industry Group |
PRICE |
CHANGE
(%Change) |
Day High |
Volume
(% DAV)
(% 50 day avg vol) |
52 Wk Hi
% From Hi |
Featured
Date |
Price
Featured |
Pivot Featured |
|
Max Buy |
AIXG
-
NASDAQ
Aixtron Se
ELECTRONICS - Semiconductor Equipment andamp; Mate
|
$42.11
|
-1.55
-3.55% |
$42.79
|
380,717
149.48% of 50 DAV
50 DAV is 254,700
|
$44.96
-6.34%
|
4/5/2011
|
$44.14
|
PP = $44.64
|
|
MB = $46.87
|
 Most Recent Note - 4/28/2011 10:54:28 AM
G - Gapped down today after a solid gain and strong close on the prior session, slumping back near its 50 DMA line. Still perched only -6.1% off its all-time high. Rebound above its 50 DMA was noted as a technical improvement that helped its outlook after it recently found support near prior lows in the $38 area.
>>> The latest Featured Stock Update with an annotated graph appeared on 4/5/2011. Click here.
View all notes |
Alert me of new notes |
CANSLIM.net Company Profile |
SEC |
Zacks Reports |
StockTalk |
News |
Chart |
Request a new note
C
A N
S L
I M


|
BIDU
-
NASDAQ
Baidu Inc Ads
INTERNET - Internet Information Providers
|
$148.25
|
-2.86
-1.89% |
$156.04
|
17,178,515
243.79% of 50 DAV
50 DAV is 7,046,400
|
$154.89
-4.29%
|
3/17/2011
|
$121.97
|
PP = $131.73
|
|
MB = $138.32
|
Most Recent Note - 4/28/2011 12:26:21 PM
G - Reported earnings +129% on +96% sales revenues for the quarter ended March 31, 2011 versus the year ago period. Touched another new all-time high early today then reversed into the red. It has been repeatedly noted - "Extended from its latest base. Prior high near $131 defines initial chart support to watch near its rising 50 DMA line."
>>> The latest Featured Stock Update with an annotated graph appeared on 4/7/2011. Click here.
View all notes |
Alert me of new notes |
CANSLIM.net Company Profile |
SEC |
Zacks Reports |
StockTalk |
News |
Chart |
Request a new note
C
A N
S L
I M
|
CMG
-
NYSE
Chipotle Mexican Grill
LEISURE - Restaurants
|
$265.64
|
+2.64
1.00% |
$267.87
|
1,111,163
94.83% of 50 DAV
50 DAV is 1,171,700
|
$289.35
-8.19%
|
4/1/2011
|
$274.00
|
PP = $275.10
|
|
MB = $288.86
|
Most Recent Note - 4/27/2011 4:59:48 PM
G - Small loss today came on 8 times average volume while it nearly tested its 50 DMA line ($261.81 now), an important chart support level. Recently negated its latest technical breakout. Gapped down on 4/21/11 after reporting earnings +23% on +24% sales revenues for the quarter ended March 31, 2011 versus the year ago period, its weakest earnings increase in years, and below the +25% guideline.
>>> The latest Featured Stock Update with an annotated graph appeared on 4/13/2011. Click here.
View all notes |
Alert me of new notes |
CANSLIM.net Company Profile |
SEC |
Zacks Reports |
StockTalk |
News |
Chart |
Request a new note
C
A N
S L
I M
|
CTCT
-
NASDAQ
Constant Contact Inc
MEDIA - Advertising Services
|
$30.62
|
-0.36
-1.16% |
$30.95
|
99,488
21.77% of 50 DAV
50 DAV is 457,000
|
$36.33
-15.72%
|
3/22/2011
|
$33.59
|
PP = $32.49
|
|
MB = $34.11
|
Most Recent Note - 4/28/2011 6:57:24 PM
After the close today it reported earnings -33% on +27% sales revenues for the quarter ended March 31, 2011 versus the year ago. Still lingering below its 50 DMA line since triggering worrisome technical sell signals with damaging losses on heavy volume just over a week ago. Based on technical and fundamental concerns it will be dropped from the Featured Stocks list tonight.
>>> The latest Featured Stock Update with an annotated graph appeared on 4/19/2011. Click here.
View all notes |
Alert me of new notes |
CANSLIM.net Company Profile |
SEC |
Zacks Reports |
StockTalk |
News |
Chart |
Request a new note
C
A N
S L
I M
|
CTSH
-
NASDAQ
Cognizant Tech Sol Cl A
COMPUTER SOFTWARE and SERVICES - Business Software and Services
|
$81.44
|
-0.35
-0.43% |
$82.55
|
1,435,940
65.46% of 50 DAV
50 DAV is 2,193,500
|
$82.93
-1.80%
|
2/7/2011
|
$75.09
|
PP = $76.46
|
|
MB = $80.28
|
Most Recent Note - 4/27/2011 5:23:06 PM
G - Holding its ground -1.4% off its all-time high. Reporting earnings on Tuesday, May 3rd before the open. Last week it tested prior highs in the $77-78 area and its 50 DMA line and found prompt support.
>>> The latest Featured Stock Update with an annotated graph appeared on 4/15/2011. Click here.
View all notes |
Alert me of new notes |
CANSLIM.net Company Profile |
SEC |
Zacks Reports |
StockTalk |
News |
Chart |
Request a new note
C
A N
S L
I M
|
Symbol/Exchange
Company Name
Industry Group |
PRICE |
CHANGE
(%Change) |
Day High |
Volume
(% DAV)
(% 50 day avg vol) |
52 Wk Hi
% From Hi |
Featured
Date |
Price
Featured |
Pivot Featured |
|
Max Buy |
DECK
-
NASDAQ
Deckers Outdoor Corp
CONSUMER NON-DURABLES - Textile - Apparel Footwear
|
$94.45
|
-2.27
-2.35% |
$97.00
|
1,556,233
118.22% of 50 DAV
50 DAV is 1,316,400
|
$97.00
-2.63%
|
2/3/2011
|
$79.61
|
PP = $82.67
|
|
MB = $86.80
|
Most Recent Note - 4/28/2011 5:15:27 PM
G - Down today with higher (near average) volume, enduring mild distributional pressure. Reported earnings only +7% on +31% sales revenues for the quarter ended March 31, 2011 versus the year ago period. Earnings less than the +25% guideline raise concerns. Gains on light volume had been recently noted while rising from a shorter than minimum length "cup-with-handle" type consolidation. Its 50 DMA line defines important chart support to watch.
>>> The latest Featured Stock Update with an annotated graph appeared on 4/6/2011. Click here.
View all notes |
Alert me of new notes |
CANSLIM.net Company Profile |
SEC |
Zacks Reports |
StockTalk |
News |
Chart |
Request a new note
C
A N
S L
I M
|
EZPW
-
NASDAQ
Ezcorp Inc Cl A
SPECIALTY RETAIL - Specialty Retail, Other
|
$30.94
|
+0.43
1.41% |
$31.00
|
379,622
102.77% of 50 DAV
50 DAV is 369,400
|
$33.08
-6.47%
|
2/18/2011
|
$27.94
|
PP = $30.04
|
|
MB = $31.54
|
Most Recent Note - 4/28/2011 5:20:24 PM
G - Closed near the session high today, rebounding further above its 50 DMA line and prior highs in the $29-30 area after negating its recent breakout. It has not formed a sound new base pattern. Reported earnings +31% on +21% sales revenues for the quarter ended March 31, 2011 versus the year ago period.
>>> The latest Featured Stock Update with an annotated graph appeared on 4/11/2011. Click here.
View all notes |
Alert me of new notes |
CANSLIM.net Company Profile |
SEC |
Zacks Reports |
StockTalk |
News |
Chart |
Request a new note
C
A N
S L
I M
|
FOSL
-
NASDAQ
Fossil Inc
CONSUMER DURABLES - Recreational Goods, Other
|
$95.87
|
+0.35
0.37% |
$96.21
|
407,893
42.47% of 50 DAV
50 DAV is 960,400
|
$96.99
-1.15%
|
2/1/2011
|
$73.30
|
PP = $74.44
|
|
MB = $78.16
|
Most Recent Note - 4/27/2011 5:28:24 PM
G - Stubbornly holding its ground with volume totals cooling while perched near its all-time high. Previously noted - "It rallied more than +108% higher in 8 months since first featured in yellow in the 8/10/10 mid-day report (read here). It could produce more climactic gains, but recently it has been noted - "Extended from any sound base. Prior highs in the $83-85 area define chart support to watch above its 50 DMA line."
>>> The latest Featured Stock Update with an annotated graph appeared on 3/30/2011. Click here.
View all notes |
Alert me of new notes |
CANSLIM.net Company Profile |
SEC |
Zacks Reports |
StockTalk |
News |
Chart |
Request a new note
C
A N
S L
I M
|
HMSY
-
NASDAQ
H M S Holdings Corp
COMPUTER SOFTWARE and SERVICES - Healthcare Information Service
|
$80.26
|
-0.55
-0.68% |
$81.60
|
123,529
73.05% of 50 DAV
50 DAV is 169,100
|
$84.82
-5.38%
|
11/19/2010
|
$61.89
|
PP = $63.01
|
|
MB = $66.16
|
Most Recent Note - 4/26/2011 7:32:23 PM
G - Gapped up today but the reversed into the red and closed near the session low -5.1% below its all-time high. Due to report earnings before the open on Friday April 29th. See the latest FSU analysis for more details and a new annotated graph.
>>> The latest Featured Stock Update with an annotated graph appeared on 4/26/2011. Click here.
View all notes |
Alert me of new notes |
CANSLIM.net Company Profile |
SEC |
Zacks Reports |
StockTalk |
News |
Chart |
Request a new note
C
A N
S L
I M
|
HS
-
NYSE
Healthspring Inc
HEALTH SERVICES - Health Care Plans
|
$41.22
|
+0.98
2.44% |
$41.39
|
766,886
86.56% of 50 DAV
50 DAV is 886,000
|
$41.53
-0.75%
|
3/22/2011
|
$38.29
|
PP = $38.85
|
|
MB = $40.79
|
Most Recent Note - 4/28/2011 10:24:45 AM
G - Small gap up today, rising above its "max buy" level, and its color code is changed to green. Its 50 DMA line ($37.83 now) defines important support above recent lows in the $35.50 area.
>>> The latest Featured Stock Update with an annotated graph appeared on 4/21/2011. Click here.
View all notes |
Alert me of new notes |
CANSLIM.net Company Profile |
SEC |
Zacks Reports |
StockTalk |
News |
Chart |
Request a new note
C
A N
S L
I M
|
Symbol/Exchange
Company Name
Industry Group |
PRICE |
CHANGE
(%Change) |
Day High |
Volume
(% DAV)
(% 50 day avg vol) |
52 Wk Hi
% From Hi |
Featured
Date |
Price
Featured |
Pivot Featured |
|
Max Buy |
INFA
-
NASDAQ
Informatica Corp
COMPUTER SOFTWARE and SERVICES - Business Software and Services
|
$54.70
|
-0.40
-0.73% |
$55.10
|
1,063,532
106.01% of 50 DAV
50 DAV is 1,003,200
|
$55.10
-0.73%
|
3/24/2011
|
$50.04
|
PP = $49.86
|
|
MB = $52.35
|
Most Recent Note - 4/27/2011 5:07:42 PM
G - Finished at the session high today with a 5th consecutive gain with above average volume for a new 52-week high. Reported +33% earnings on +24% sales revenues for the quarter ended March 31, 2011 versus the year ago period. Prior highs in the $49 area define support to watch coinciding with its 50 DMA line.
>>> The latest Featured Stock Update with an annotated graph appeared on 4/27/2011. Click here.
View all notes |
Alert me of new notes |
CANSLIM.net Company Profile |
SEC |
Zacks Reports |
StockTalk |
News |
Chart |
Request a new note
C
A N
S L
I M
|
LULU
-
NASDAQ
Lululemon Athletica
MANUFACTURING - Textile Manufacturing
|
$99.33
|
-1.15
-1.14% |
$101.91
|
1,272,744
56.52% of 50 DAV
50 DAV is 2,251,800
|
$102.83
-3.40%
|
3/28/2011
|
$68.11
|
PP = $85.38
|
|
MB = $89.65
|
Most Recent Note - 4/27/2011 4:50:48 PM
G - Perched near its all-time high, this high-ranked Retail-Apparel firm is extended from any sound base pattern. Prior highs and its 50 DMA line in the $85 area define important chart support to watch.
>>> The latest Featured Stock Update with an annotated graph appeared on 3/31/2011. Click here.
View all notes |
Alert me of new notes |
CANSLIM.net Company Profile |
SEC |
Zacks Reports |
StockTalk |
News |
Chart |
Request a new note
C
A N
S L
I M
|
MG
-
NYSE
Mistras Group Inc
DIVERSIFIED SERVICES - Bulding and Faci;ity Management Services
|
$18.26
|
+0.01
0.05% |
$18.30
|
45,732
35.51% of 50 DAV
50 DAV is 128,800
|
$18.46
-1.08%
|
3/15/2011
|
$15.48
|
PP = $15.90
|
|
MB = $16.70
|
Most Recent Note - 4/27/2011 5:34:52 PM
G - Stubbornly holding its ground, extended from any sound base pattern. Its 50 DMA line and prior highs define important support to watch.
>>> The latest Featured Stock Update with an annotated graph appeared on 4/12/2011. Click here.
View all notes |
Alert me of new notes |
CANSLIM.net Company Profile |
SEC |
Zacks Reports |
StockTalk |
News |
Chart |
Request a new note
C
A N
S L
I M
|
MWIV
-
NASDAQ
M W I Veterinary Supply
HEALTH SERVICES - Medical Instruments and; Supplies
|
$81.35
|
+0.35
0.43% |
$81.86
|
72,737
70.28% of 50 DAV
50 DAV is 103,500
|
$84.97
-4.26%
|
11/4/2010
|
$61.79
|
PP = $59.60
|
|
MB = $62.58
|
Most Recent Note - 4/28/2011 5:21:39 PM
G - Holding its ground quietly today perched near all-time highs. Since first featured in yellow on 7/29/10 it has traded as much as +63% higher. Extended from any sound base pattern, its 50 DMA line defines important support to watch.
>>> The latest Featured Stock Update with an annotated graph appeared on 4/8/2011. Click here.
View all notes |
Alert me of new notes |
CANSLIM.net Company Profile |
SEC |
Zacks Reports |
StockTalk |
News |
Chart |
Request a new note
C
A N
S L
I M
|
OPEN
-
NASDAQ
Opentable Inc
INTERNET - Internet Software and Services
|
$108.72
|
-1.95
-1.76% |
$111.54
|
763,166
64.05% of 50 DAV
50 DAV is 1,191,500
|
$118.66
-8.38%
|
3/17/2011
|
$90.71
|
PP = $96.07
|
|
MB = $100.87
|
Most Recent Note - 4/26/2011 3:57:59 PM
G - Down today on heavy volume. Reporting earnings on Tuesday, May 3rd for the quarter ended March 31, 2011. Repeatedly noted - "Extended from its latest base. Prior highs near $96 and its 50 DMA line define support to watch on pullbacks.
>>> The latest Featured Stock Update with an annotated graph appeared on 4/25/2011. Click here.
View all notes |
Alert me of new notes |
CANSLIM.net Company Profile |
SEC |
Zacks Reports |
StockTalk |
News |
Chart |
Request a new note
C
A N
S L
I M
|
Symbol/Exchange
Company Name
Industry Group |
PRICE |
CHANGE
(%Change) |
Day High |
Volume
(% DAV)
(% 50 day avg vol) |
52 Wk Hi
% From Hi |
Featured
Date |
Price
Featured |
Pivot Featured |
|
Max Buy |
PAY
-
NYSE
Verifone Systems Inc
COMPUTER HARDWARE - Transaction Automation Systems
|
$53.64
|
-0.10
-0.19% |
$54.17
|
1,094,780
45.27% of 50 DAV
50 DAV is 2,418,600
|
$58.88
-8.90%
|
1/27/2011
|
$41.77
|
PP = $44.97
|
|
MB = $47.22
|
Most Recent Note - 4/26/2011 4:01:25 PM
G - Reversed into the red after an early gain today. Its 50 DMA line ($51.22 now) defines important chart support to watch.
>>> The latest Featured Stock Update with an annotated graph appeared on 4/4/2011. Click here.
View all notes |
Alert me of new notes |
CANSLIM.net Company Profile |
SEC |
Zacks Reports |
StockTalk |
News |
Chart |
Request a new note
C
A N
S L
I M
|
PCLN
-
NASDAQ
Priceline.Com Inc
INTERNET - Internet Software and Services
|
$550.03
|
+10.58
1.96% |
$551.17
|
832,187
70.76% of 50 DAV
50 DAV is 1,176,000
|
$547.91
0.39%
|
1/3/2011
|
$399.55
|
PP = $428.20
|
|
MB = $449.61
|
Most Recent Note - 4/27/2011 5:37:39 PM
G - Stubbornly holding its ground near its 52-week high with volume totals cooling. It may go on to produce more climactic gains, yet it has been repeatedly noted - "Extended from any sound base pattern. Its 50 DMA line has defined support throughout its advance."
>>> The latest Featured Stock Update with an annotated graph appeared on 4/20/2011. Click here.
View all notes |
Alert me of new notes |
CANSLIM.net Company Profile |
SEC |
Zacks Reports |
StockTalk |
News |
Chart |
Request a new note
C
A N
S L
I M
|
RAX
-
NYSE
Rackspace Hosting Inc
INTERNET - Internet Software and; Services
|
$45.76
|
-0.04
-0.09% |
$46.28
|
1,282,425
79.15% of 50 DAV
50 DAV is 1,620,300
|
$45.93
-0.37%
|
3/16/2011
|
$36.28
|
PP = $40.72
|
|
MB = $42.76
|
Most Recent Note - 4/27/2011 4:45:46 PM
G - Rallied for a new all-time high today, getting more extended from any sound base. Prior highs near $40 define support above its 50 DMA line.
>>> The latest Featured Stock Update with an annotated graph appeared on 4/18/2011. Click here.
View all notes |
Alert me of new notes |
CANSLIM.net Company Profile |
SEC |
Zacks Reports |
StockTalk |
News |
Chart |
Request a new note
C
A N
S L
I M
|
TIBX
-
NASDAQ
Tibco Software Inc
COMPUTER SOFTWARE and SERVICES - Business Software and Services
|
$29.65
|
-0.18
-0.60% |
$30.20
|
2,002,806
81.56% of 50 DAV
50 DAV is 2,455,600
|
$29.99
-1.13%
|
3/18/2011
|
$23.88
|
PP = $26.04
|
|
MB = $27.34
|
Most Recent Note - 4/27/2011 5:16:43 PM
G - Quietly holding its ground near its all-time high, extended from any sound base after a spurt of volume-driven gains. As previously noted, support is defined by prior highs in the $25-26 area and its 50 DMA line.
>>> The latest Featured Stock Update with an annotated graph appeared on 4/14/2011. Click here.
View all notes |
Alert me of new notes |
CANSLIM.net Company Profile |
SEC |
Zacks Reports |
StockTalk |
News |
Chart |
Request a new note
C
A N
S L
I M
|
UA
-
NYSE
Under Armour Inc Cl A
CONSUMER NON-DURABLES - Textile - Apparel Clothing
|
$70.24
|
+0.19
0.27% |
$72.24
|
1,446,636
170.84% of 50 DAV
50 DAV is 846,800
|
$80.00
-12.20%
|
3/31/2011
|
$68.04
|
PP = $70.79
|
|
MB = $74.33
|
Most Recent Note - 4/28/2011 5:17:08 PM
G - Holding its ground above its 50 DMA line and prior chart highs, churning above average volume again. It was down considerably with heavy volume on 4/26/11 after reporting earnings +64% on +36% sales revenues for the quarter ended March 31, 2011 versus the year ago period.
>>> The latest Featured Stock Update with an annotated graph appeared on 4/1/2011. Click here.
View all notes |
Alert me of new notes |
CANSLIM.net Company Profile |
SEC |
Zacks Reports |
StockTalk |
News |
Chart |
Request a new note
C
A N
S L
I M
|
Symbol/Exchange
Company Name
Industry Group |
PRICE |
CHANGE
(%Change) |
Day High |
Volume
(% DAV)
(% 50 day avg vol) |
52 Wk Hi
% From Hi |
Featured
Date |
Price
Featured |
Pivot Featured |
|
Max Buy |
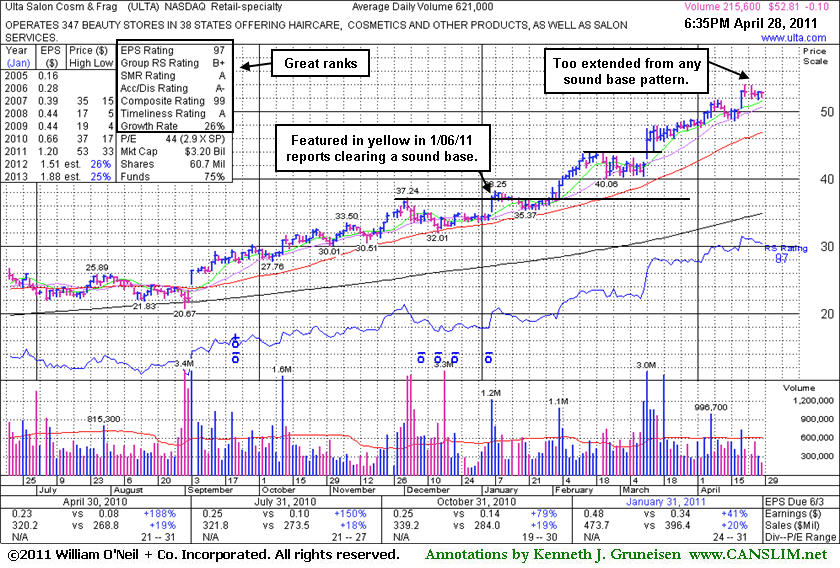
ULTA
-
NASDAQ
Ulta Salon Cosm & Frag
SPECIALTY RETAIL - Specialty Retail, Other
|
$52.81
|
-0.10
-0.19% |
$53.22
|
216,979
34.94% of 50 DAV
50 DAV is 621,000
|
$53.99
-2.19%
|
1/6/2011
|
$36.12
|
PP = $37.34
|
|
MB = $39.21
|
Most Recent Note - 4/28/2011 6:54:20 PM
G - Extended from any sound base now. Its 50 DMA line defines chart support to watch well above prior highs. See the latest FSU analysis for more details and a new annotated graph.
>>> The latest Featured Stock Update with an annotated graph appeared on 4/28/2011. Click here.
View all notes |
Alert me of new notes |
CANSLIM.net Company Profile |
SEC |
Zacks Reports |
StockTalk |
News |
Chart |
Request a new note
C
A N
S L
I M
|