You are not logged in.
This means you
CAN ONLY VIEW reports that were published prior to Monday, April 14, 2025.
You
MUST UPGRADE YOUR MEMBERSHIP if you want to see any current reports.
AFTER MARKET UPDATE - WEDNESDAY, APRIL 28TH, 2010
Previous After Market Report Next After Market Report >>>
|
|
|
|
DOW |
+53.28 |
11,045.27 |
+0.48% |
|
Volume |
1,682,377,090 |
-0% |
|
Volume |
2,599,225,620 |
-3% |
|
NASDAQ |
+0.26 |
2,471.73 |
+0.01% |
|
Advancers |
1,753 |
55% |
|
Advancers |
1,427 |
50% |
|
S&P 500 |
+7.65 |
1,191.36 |
+0.65% |
|
Decliners |
1,299 |
41% |
|
Decliners |
1,303 |
46% |
|
Russell 2000 |
+1.12 |
722.39 |
+0.16% |
|
52 Wk Highs |
92 |
|
|
52 Wk Highs |
103 |
|
|
S&P 600 |
+0.46 |
384.51 |
+0.12% |
|
52 Wk Lows |
14 |
|
|
52 Wk Lows |
16 |
|
|
 |
Indices Rise Without Great Conviction
Adam Sarhan, Contributing Writer,
The major averages ended higher after the Federal Reserve held rates steady near historic lows, and while Spain's debt was downgraded. Volume totals on Wednesday were reported even to slightly lower compared to Tuesday's totals, which suggested that large institutions were not aggressively buying stocks. Advancers led decliners by almost a 3-to-2 ratio on the NYSE, but they only led narrowly on the Nasdaq exchange. Meanwhile, new 52-week highs easily trumped new 52-week lows. There were 15 high-ranked companies from the CANSLIM.net Leaders List that made a new 52-week high and appeared on the CANSLIM.net BreakOuts Page, considerably lower than the 28 issues that appeared on the prior session. A healthy crop of new leaders making new highs bodes well for any market rally.
The Euro slid to a fresh one-year low after Spain's debt rating was downgraded. This has been a tough week for the EU, Greece, Spain and Portugal all saw their debt ratings cut as the fear of default swells. Analysts are concerned that other European nations, (i.e. Ireland and Italy), may be next to see their ratings cut as the continent continues to make its way through the worst financial crisis since WWII!
Around 2pm EST, the Federal Reserve held rates steady and reiterated their stance to keep their benchmark interest rate near zero for an “extended period” as the economy continues to improve. The Fed said, “Economic conditions, including low rates of resource utilization, subdued inflation trends, and stable inflation expectations, are likely to warrant exceptionally low levels of the federal funds rate for an extended period.” Futures trading currently show that there is a 15% chance that the Fed will raise rates by their August meeting. In March, the odds were closer to 50%.
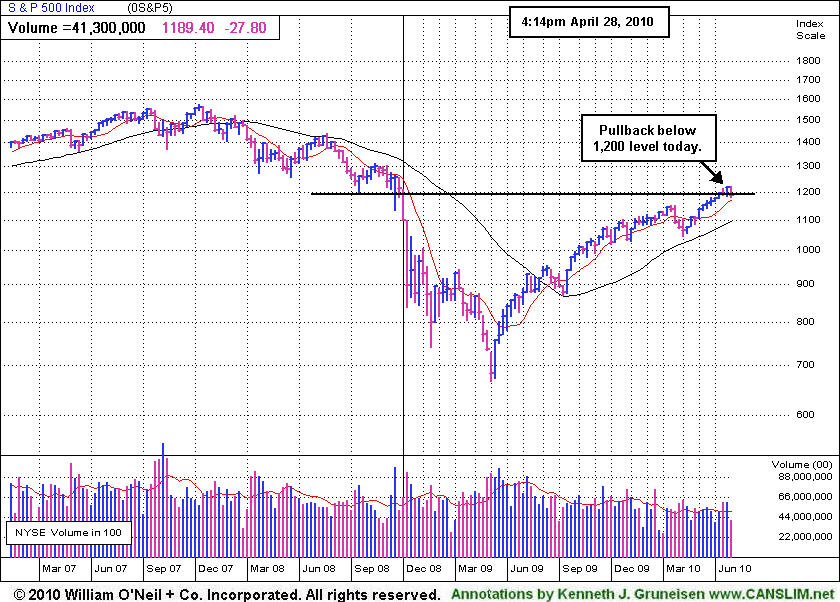
It is important to note that the major averages have been steadily rallying since early February and a pullback of some sort should be expected. Tuesday marked the latest distribution day since the rally was confirmed on the March 1, 2010 follow-through day (FTD). According to the paper, there are 7 distribution days for the NYSE, 6 for the S&P 500, 5 for the Dow, and 3 for the Nasdaq. This puts some pressure on this 9-week rally, but has yet to cause any technical damage.
PICTURED: The weekly chart of the S&P 500 Index illustrates how the benchmark index closed below the 1,200 threshold after recently rallying above it with great volume conviction.
|
|
|
 |
Defensive Groups Clearly Lagging in 2010 Thus Far
Kenneth J. Gruneisen - Passed the CAN SLIM® Master's Exam
The Retail Index ($RLX -0.57%) and Internet Index ($IIX -0.14%) ended Wednesday's session with small losses while most groups posted gains. The Bank Index ($BKX +1.36%) and Broker/Dealer Index ($XBD +1.12%) were among the important positive market influences. Tech shares also rose as the Networking Index ($NWX +0.34%), Semiconductor Index ($SOX +0.48%), and Biotechnology Index ($BTK +1.20%) unanimously posted modest gains. Energy shares also rose as the Integrated Oil Index ($XOI +0.88%), and Oil Services Index ($OSX +1.13%) spurted higher.
The Healthcare Index ($HMO +2.35%) was among the session's best gainers. Yesterday's IGW section (read here) pointed out the substantial YTD gains that have come from influential industry groups like the Retailers and Banks. The defensive "safe haven" groups have clearly not kept pace this year, as shown by the relatively sluggish gains from the Healthcare Index (HMO +3.4% TYD) and Gold & Silver Index (XAU +4.9% YTD) thus far into 2010.
Charts courtesy www.stockcharts.com

PICTURED: The Gold & Silver Index ($XAU +2.74%) traded above its April high intra-day. In the days ahead this is action worth watching. However, few mining firms have solid quarterly and annual earnings histories, or they would be showing up in the daily screenings and reports.
| Oil Services |
$OSX |
220.50 |
+2.46 |
+1.13% |
+13.12% |
| Healthcare |
$HMO |
1,522.71 |
+35.03 |
+2.35% |
+3.38% |
| Integrated Oil |
$XOI |
1,105.81 |
+9.63 |
+0.88% |
+3.52% |
| Semiconductor |
$SOX |
388.63 |
+1.85 |
+0.48% |
+7.98% |
| Networking |
$NWX |
267.11 |
+0.90 |
+0.34% |
+15.60% |
| Internet |
$IIX |
253.28 |
-0.37 |
-0.14% |
+8.31% |
| Broker/Dealer |
$XBD |
119.90 |
+1.33 |
+1.12% |
+4.22% |
| Retail |
$RLX |
478.33 |
-2.74 |
-0.57% |
+16.35% |
| Gold & Silver |
$XAU |
176.60 |
+4.71 |
+2.74% |
+4.96% |
| Bank |
$BKX |
55.16 |
+0.74 |
+1.36% |
+29.15% |
| Biotech |
$BTK |
1,184.98 |
+14.07 |
+1.20% |
+25.78% |
|
|
|
 |
Priceline Perched Near 52-Week High
Kenneth J. Gruneisen - Passed the CAN SLIM® Master's Exam
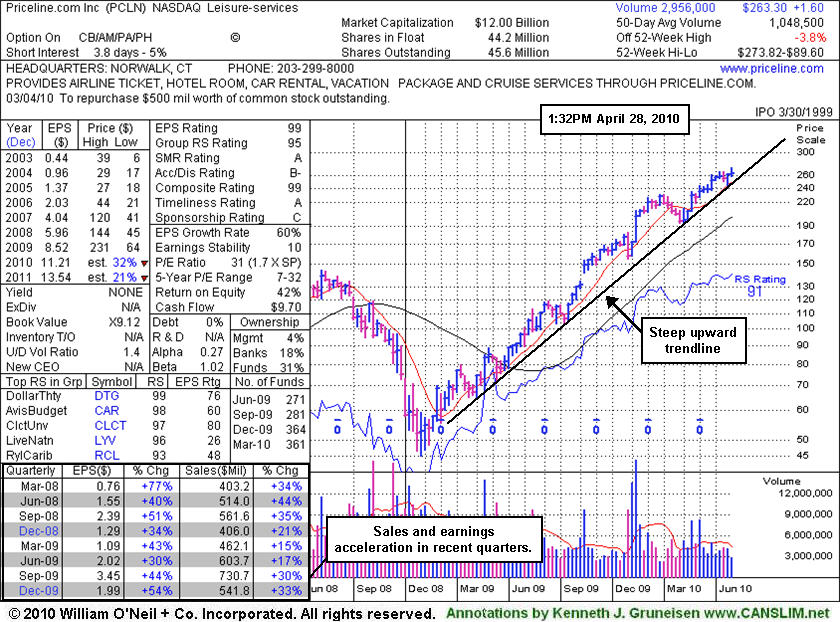
Priceline.com Inc. (PCLN -$2.52 or -0.95% to $261.78) is consolidating on lighter volume. It recently rallied for a considerable gain and new 52-week high with just above average volume following a brief consolidation above its 50-day moving average (DMA) line. It did not spend enough time consolidating to form a sound base pattern, aside from it being only a half-hearted push into new high ground. Still, this high-ranked Leisure-Services firm is has no overhead supply to act as resistance, so it can easily rise unhindered for more climactic gains. Its relatively small supply of only 45.6 million shares (S criteria) can lead to great price volatility in the event of institutional accumulation or distribution. Volume and volatility is often greater near earnings news, and the company is due to report its latest quarterly earnings on May 10th.
Disciplined investors avoid chasing stocks extended from a sound base. PCLN previously appeared in this FSU section on 2/18/10 under the headline "Big Gap Up Gain On 4 Times Average Volume" when triggering a technical buy signal while rising from a 9-week base. It was still color coded yellow on 3/10/10 when it made a subsequent FSU section appearance under the headline "Priceline Remains Perched Near All-Time Highs Following Latest Breakout", but its color code was changed to green after blasting above its "max buy" level.
A summary of past coverage and the stock's subsequent action was published on 11/07/08 under the headline "Multiple Sell Signals Preceded Big Price Decline." That write-up explained the stock's weak action after it had been dropped from the Featured Stocks list after its 200 DMA violation on July 2, 2008. Keep in mind that PCLN was first featured on Friday, November 09, 2007 in the CANSLIM.net Mid Day Breakouts Report after gapping up over the $100 threshold (read here).
|
|
|
Color Codes Explained :
Y - Better candidates highlighted by our
staff of experts.
G - Previously featured
in past reports as yellow but may no longer be buyable under the
guidelines.
***Last / Change / Volume quote data in this table corresponds with the timestamp on the note***
Symbol/Exchange
Company Name
Industry Group |
Last |
Chg. |
Vol
% DAV |
Date Featured |
Price Featured |
Latest Pivot Point
Featured |
Status |
| Latest Max Buy Price |
AMZN
- NASDAQ
Amazon.com Inc
INTERNET - Internet Software & Services
|
$139.35
|
-2.67
|
9,213,734
121% DAV
7,604,900
|
4/23/2010
(Date
Featured) |
$144.41
(Price
Featured) |
PP = $146.01 |
G |
| MB = $153.31 |
Most Recent Note - 4/28/2010 4:22:40 PM
G - Slumped further below its pivot point today and closed near the session low, undercutting its old high closes raised concerns. Color code is changed to green. In recent weeks it rose from a 4-month cup shaped pattern to new multi-year highs. AMZN was featured in the 4/23/10 mid-day report (read here) while encountering distributional pressure following strong results for the March 31, 2010 quarter. Technically, it had risen above the pivot point cited (based on its 12/03/09 high plus .10) with twice average volume behind its 4/22/10 gain. Recent quarterly comparisons show sales revenues acceleration with 3 consecutive quarterly earnings per share increases in the +60% range, along with a solid annual earning history - satisfying the C and A criteria.
>>> The latest Featured Stock Update with an annotated graph appeared on 4/23/2010. click here.
|
|
C
A
S
I |
News |
Chart |
SEC
View all notes Alert
me of new notes
Company
Profile
|
ARUN
- NASDAQ
Aruba Networks Inc
COMPUTER HARDWARE - Networking & Communication Dev
|
$13.08
|
-0.26
|
987,300
61% DAV
1,631,300
|
2/19/2010
(Date
Featured) |
$12.71
(Price
Featured) |
PP = $11.94 |
G |
| MB = $12.54 |
Most Recent Note - 4/28/2010 4:26:19 PM
G - Down today on below average volume, slumping near its 50 DMA line. Below that important short-term average, its recent chart low ($12.21 on 3/19/10) helps define the next nearest chart support above it old pivot point.
>>> The latest Featured Stock Update with an annotated graph appeared on 3/31/2010. click here.
|
|
C
A
S
I |
News |
Chart |
SEC
View all notes Alert
me of new notes
Company
Profile
|
BIDU
- NASDAQ
Baidu Inc Ads
INTERNET - Internet Information Providers
|
$621.38
|
+1.27
|
1,163,605
80% DAV
1,447,600
|
1/13/2010
(Date
Featured) |
$431.25
(Price
Featured) |
PP = $426.75 |
G |
| MB = $448.09 |
Most Recent Note - 4/28/2010 4:27:46 PM
G - Consolidating after 12 consecutive weekly gains. It is extended from any sound base, yet repeatedly noted it - "could produce more climactic gains, especially due to the small supply (S criteria) of shares outstanding. Earnings news is due on Wednesday, 4/28/10."
>>> The latest Featured Stock Update with an annotated graph appeared on 4/20/2010. click here.
|
|
C
A
S
I |
News |
Chart |
SEC
View all notes Alert
me of new notes
Company
Profile
|
BPI
- NYSE
Bridgepoint Education
DIVERSIFIED SERVICES - Education &; Training Services
|
$25.65
|
+0.25
|
215,415
48% DAV
450,100
|
4/13/2010
(Date
Featured) |
$25.59
(Price
Featured) |
PP = $25.76 |
Y |
| MB = $27.05 |
Most Recent Note - 4/28/2010 4:30:23 PM
Y- Consolidating near its pivot point. Fears that for-profit schools could be hurt by proposed regulatory changes hurt its peers this week. Its 4/23/10 low ($24.30) is a near-term chart support level to watch above its 50 DMA line. The Commercial Services - Schools firm was featured in yellow in the 4/13/10 mid-day report (read here) as rose from a cup-with-high-handle.
>>> The latest Featured Stock Update with an annotated graph appeared on 4/13/2010. click here.
|
|
C
A
S
I |
News |
Chart |
SEC
View all notes Alert
me of new notes
Company
Profile
|
BRLI
- NASDAQ
Bio Reference Labs Inc
HEALTH SERVICES - Medical Laboratories & Researc
|
$23.77
|
+0.52
|
105,326
53% DAV
200,000
|
2/12/2010
(Date
Featured) |
$39.02
(Price
Featured) |
PP = $20.49 |
G |
| MB = $21.51 |
Most Recent Note - 4/28/2010 4:31:37 PM
G - Gapped up today for a gain on light volume, still consolidating after a big winning streak and a 2:1 stock split. Prior chart highs and its 50 DMA line are support levels to watch.
>>> The latest Featured Stock Update with an annotated graph appeared on 4/16/2010. click here.
|
|
C
A
S
I |
News |
Chart |
SEC
View all notes Alert
me of new notes
Company
Profile
|
CISG
- NASDAQ
Cninsure Inc Ads
INSURANCE - Insurance Brokers
|
$27.40
|
+2.25
|
179,487
72% DAV
250,300
|
3/3/2010
(Date
Featured) |
$24.38
(Price
Featured) |
PP = $23.10 |
G |
| MB = $24.26 |
Most Recent Note - 4/28/2010 4:33:28 PM
G - Rallied for a considerable gain today on light volume. Its 50 DMA line and recent lows define important support near earlier chart highs. CISG traded up as much as +17.4% since featured in yellow in the 3/03/10 mid-day report (read here).
>>> The latest Featured Stock Update with an annotated graph appeared on 4/19/2010. click here.
|
|
C
A
S
I |
News |
Chart |
SEC
View all notes Alert
me of new notes
Company
Profile
|
CRM
- NYSE
Salesforce.com Inc
INTERNET - Internet Software & Services
|
$86.15
|
+0.34
|
1,467,550
85% DAV
1,736,700
|
3/5/2010
(Date
Featured) |
$72.28
(Price
Featured) |
PP = $75.53 |
G |
| MB = $79.31 |
Most Recent Note - 4/28/2010 4:34:41 PM
G - Consolidating near its all-time high, extended from prior chart highs and well above its "max buy" level. Patience may allow disciplined investors to accumulate shares without chasing it too far from a sound base.
>>> The latest Featured Stock Update with an annotated graph appeared on 4/21/2010. click here.
|
|
C
A
S
I |
News |
Chart |
SEC
View all notes Alert
me of new notes
Company
Profile
|
CTRP
- NASDAQ
Ctrip.com Intl Ltd Adr
LEISURE - Resorts & Casinos
|
$37.92
|
+0.21
|
1,100,412
57% DAV
1,919,000
|
3/25/2010
(Date
Featured) |
$40.74
(Price
Featured) |
PP = $39.40 |
Y |
| MB = $41.37 |
Most Recent Note - 4/28/2010 4:39:19 PM
Y - Consolidating near its 50 DMA line, any violation of its 4/21/10 low ($35.60) would complete a bearish head-and-shoulders pattern and raise serious concerns. In recent months it has encountered stubborn resistance in the $40 area. Confirming gains with heavy volume for new high closes would be a welcome reassurance shares are being accumulated. Distributional pressure has been noted since the 3/25/10 Stock Bulletin was published (read here).
>>> The latest Featured Stock Update with an annotated graph appeared on 4/12/2010. click here.
|
|
C
A
S
I |
News |
Chart |
SEC
View all notes Alert
me of new notes
Company
Profile
|
EZPW
- NASDAQ
Ezcorp Inc Cl A
SPECIALTY RETAIL - Specialty Retail, Other
|
$22.39
|
+0.24
|
382,331
72% DAV
531,100
|
4/14/2010
(Date
Featured) |
$21.80
(Price
Featured) |
PP = $22.29 |
Y |
| MB = $23.40 |
Most Recent Note - 4/28/2010 4:56:30 PM
Y - Held its ground near its pivot point today after a considerable loss on 4/27/10 with above average volume raised concerns. Rose from a 5-week flat base with no overhead supply to act as resistance for this high-ranked Finance - Consumer/Commercial Loans firm.
>>> The latest Featured Stock Update with an annotated graph appeared on 4/27/2010. click here.
|
|
C
A
S
I |
News |
Chart |
SEC
View all notes Alert
me of new notes
Company
Profile
|
ISRG
- NASDAQ
Intuitive Surgical Inc
HEALTH SERVICES - Medical Appliances & Equipment
|
$360.09
|
+2.29
|
355,818
62% DAV
577,700
|
4/13/2010
(Date
Featured) |
$363.46
(Price
Featured) |
PP = $367.10 |
Y |
| MB = $385.46 |
Most Recent Note - 4/28/2010 4:58:23 PM
Y - Still consolidating quietly, but it has slumped under its pivot point. A subsequent violation of its recent chart low or 50 DMA line could raise more serious concerns and trigger sell signals. ISRG was featured again in the 4/13/10 mid-day report (read here) with new pivot point cited based on its 3/03/10 high.
>>> The latest Featured Stock Update with an annotated graph appeared on 4/7/2010. click here.
|
|
C
A
S
I |
News |
Chart |
SEC
View all notes Alert
me of new notes
Company
Profile
|
LL
- NYSE
Lumber Liquidators Hldgs
RETAIL - Home Improvement Stores
|
$30.74
|
+0.14
|
1,361,278
336% DAV
404,800
|
4/22/2010
(Date
Featured) |
$29.87
(Price
Featured) |
PP = $29.03 |
G |
| MB = $30.48 |
Most Recent Note - 4/28/2010 5:13:05 PM
G - Following earnings news it gapped down again today, then managed a "positive reversal" to close back above its max buy level. First featured in yellow at $29.87 in the 4/22/10 the mid-day report (read here) - "rising from an orderly cup shaped pattern (without a proper handle) formed since last noted on 12/17/09. It rallied steadily after a 'breakaway gap' on 8/05/09 helped it clear stubborn resistance in the $17 area. Quarterly sales and earnings increases have recently shown encouraging acceleration while growth rates have previously been noted as below the investment system's guidelines."
>>> The latest Featured Stock Update with an annotated graph appeared on 4/26/2010. click here.
|
|
C
A
S
I |
News |
Chart |
SEC
View all notes Alert
me of new notes
Company
Profile
|
LOPE
- NASDAQ
Grand Canyon Education
DIVERSIFIED SERVICES - Education &; Training Services
|
$24.96
|
-0.09
|
246,368
71% DAV
347,500
|
4/13/2010
(Date
Featured) |
$27.71
(Price
Featured) |
PP = $27.33 |
G |
| MB = $28.70 |
Most Recent Note - 4/28/2010 5:14:52 PM
G - Down again today for a 6th consecutive loss, near important support at its 50 DMA line. Closed under its prior chart lows as distributional pressure negated its breakout from an advanced "3-weeks tight" type pattern, raising concerns.
>>> The latest Featured Stock Update with an annotated graph appeared on 4/14/2010. click here.
|
|
C
A
S
I |
News |
Chart |
SEC
View all notes Alert
me of new notes
Company
Profile
|
PCLN
- NASDAQ
Priceline.com Inc
INTERNET - Internet Software & Services
|
$399.55
|
-4.72
|
584,812
N/A
|
11/1/2002
(Date
Featured) |
$399.55
(Price
Featured) |
PP = $428.20 |
Y |
| MB = $449.61 |
Most Recent Note - 1/2/2011
Y - Returns to Featured Stocks list with its appearance in the January 2011 CANSLIM.net News including detailed analysis and annotated daily and weekly graphs.
>>> The latest Featured Stock Update with an annotated graph appeared on 4/28/2010. click here.
|
|
C
A
S
I |
News |
Chart |
SEC
View all notes Alert
me of new notes
Company
Profile
|
ROVI
- NASDAQ
Rovi Corp
COMPUTER SOFTWARE & SERVICES - Security Software & Services
|
$39.54
|
+0.34
|
1,018,585
76% DAV
1,344,200
|
4/20/2010
(Date
Featured) |
$37.62
(Price
Featured) |
PP = $38.60 |
Y |
| MB = $40.53 |
Most Recent Note - 4/28/2010 5:17:20 PM
Y - Still quietly perched near its 52-week high. Its 50 DMA line and recent chart low ($35.91 on 4/08/10) define important support to watch. Earnings news is due on May 6th.
>>> The latest Featured Stock Update with an annotated graph appeared on 4/8/2010. click here.
|
|
C
A
S
I |
News |
Chart |
SEC
View all notes Alert
me of new notes
Company
Profile
|
SIRO
- NASDAQ
Sirona Dental Systems
HEALTH SERVICES - Medical Instruments & Supplies
|
$42.07
|
+0.11
|
546,867
100% DAV
548,400
|
2/16/2010
(Date
Featured) |
$36.43
(Price
Featured) |
PP = $36.15 |
G |
| MB = $37.96 |
Most Recent Note - 4/28/2010 5:18:00 PM
G - Holding its ground stubbornly since its 4/23/10 gap up for a considerable gain and new 52-week high. Extended from any sound base, its prior chart highs and 50 DMA line in the $36 area define an initial support level to watch. Earnings release is scheduled for May 5th.
>>> The latest Featured Stock Update with an annotated graph appeared on 4/22/2010. click here.
|
|
C
A
S
I |
News |
Chart |
SEC
View all notes Alert
me of new notes
Company
Profile
|
ULTA
- NASDAQ
Ulta Salon Cosm & Frag
SPECIALTY RETAIL - Specialty Retail, Other
|
$22.98
|
+0.23
|
408,046
103% DAV
394,600
|
3/12/2010
(Date
Featured) |
$22.81
(Price
Featured) |
PP = $21.72 |
G |
| MB = $22.81 |
Most Recent Note - 4/28/2010 5:18:40 PM
G - Gapped up today and held its ground. Traded near its 50 DMA line and pivot point on the prior sesssion, then found prompt support and closed in the middle of its intra-day range after gapping down in reaction to an analyst downgrade. The distributional action followed a negative reversal on 4/26/10 after reaching a new 52-week high.
>>> The latest Featured Stock Update with an annotated graph appeared on 4/1/2010. click here.
|
|
C
A
S
I |
News |
Chart |
SEC
View all notes Alert
me of new notes
Company
Profile
|
VIT
-
|
$23.83
|
-1.69
|
1,647,983
251% DAV
657,800
|
4/9/2010
(Date
Featured) |
$23.79
(Price
Featured) |
PP = $23.95 |
Y |
| MB = $25.15 |
Most Recent Note - 4/28/2010 5:23:05 PM
Y - Considerable loss today with volume more than 2 times average led to a close below its pivot point, raising concerns. Testing support near prior chart highs, meanwhile the next support to watch is its 50 DMA line. Color code was changed to yellow on the pullback. More damaging losses would raise serious concerns, and a subsequent close below its 3/09/10 close ($23.41) would technically negate its latest breakout. Featured in the 4/09/10 mid-day report (read here).
>>> The latest Featured Stock Update with an annotated graph appeared on 4/9/2010. click here.
|
|
C
A
S
I |
News |
Chart |
SEC
View all notes Alert
me of new notes
Company
Profile
|
VPRT
- NASDAQ
Vistaprint Nv
DIVERSIFIED SERVICES - Business/Management Services
|
$58.30
|
-1.79
|
675,809
188% DAV
358,700
|
4/23/2010
(Date
Featured) |
$61.46
(Price
Featured) |
PP = $62.64 |
G |
| MB = $65.77 |
Most Recent Note - 4/28/2010 5:25:04 PM
G - Loss today with above average volume as it violated its 50 DMA line raises concerns. Color code is changed to green. Volume +50% above average or greater is still required with a gain above its pivot point to trigger a proper technical buy signal.
>>> The latest Featured Stock Update with an annotated graph appeared on 4/15/2010. click here.
|
|
C
A
S
I |
News |
Chart |
SEC
View all notes Alert
me of new notes
Company
Profile
|
|
|
|
THESE ARE NOT BUY RECOMMENDATIONS!
Comments contained in the body of this report are technical
opinions only. The material herein has been obtained
from sources believed to be reliable and accurate, however,
its accuracy and completeness cannot be guaranteed.
This site is not an investment advisor, hence it does
not endorse or recommend any securities or other investments.
Any recommendation contained in this report may not
be suitable for all investors and it is not to be deemed
an offer or solicitation on our part with respect to
the purchase or sale of any securities. All trademarks,
service marks and trade names appearing in this report
are the property of their respective owners, and are
likewise used for identification purposes only.
This report is a service available
only to active Paid Premium Members.
You may opt-out of receiving report notifications
at any time. Questions or comments may be submitted
by writing to Premium Membership Services 665 S.E. 10 Street, Suite 201 Deerfield Beach, FL 33441-5634 or by calling 1-800-965-8307
or 954-785-1121.
|
|
|


