***Last / Change / Volume data in this table is the closing quote data***
Symbol/Exchange
Company Name
Industry Group |
PRICE |
CHANGE
(%Change) |
Day High |
Volume
(% DAV)
(% 50 day avg vol) |
52 Wk Hi
% From Hi |
Featured
Date |
Price
Featured |
Pivot Featured |
|
Max Buy |
ACN
-
NYSE
Accenture Plc
DIVERSIFIED SERVICES - Business/Management Services
|
$65.02
|
+0.68
1.06% |
$65.20
|
3,491,714
107.16% of 50 DAV
50 DAV is 3,258,500
|
$65.89
-1.32%
|
3/23/2012
|
$64.13
|
PP = $63.76
|
|
MB = $66.95
|
Most Recent Note - 4/23/2012 11:51:09 AM
Y - Gapped down today amid widespread market weakness. Slumping back below its pivot point near prior highs in the $62-63 area and its 50 DMA line defining important near-term support.
>>> The latest Featured Stock Update with an annotated graph appeared on 3/23/2012. Click here.
View all notes |
Alert me of new notes |
CANSLIM.net Company Profile |
SEC |
Zacks Reports |
StockTalk |
News |
Chart |
Request a new note
C
A N
S L
I M


|
ADS
-
NYSE
Alliance Data Sys Corp
COMPUTER SOFTWARE and SERVICES - Information and Delivery Service
|
$130.28
|
+0.47
0.36% |
$130.66
|
461,450
78.04% of 50 DAV
50 DAV is 591,300
|
$130.34
-0.05%
|
1/17/2012
|
$108.24
|
PP = $107.43
|
|
MB = $112.80
|
Most Recent Note - 4/24/2012 6:58:14 PM
G - Still holding its ground near its all-time high today. Reported earnings +17% on +20% sales revenues for the quarter ended March 31, 2012 versus the year-ago period. Fundamental concerns were raised earlier by earnings reported +9%, well below the +25% minimum guideline, for the latest quarter ended December 31, 2011 versus the year-ago period. See the latest FSU analysis for more details and a new annotated graph.
>>> The latest Featured Stock Update with an annotated graph appeared on 4/24/2012. Click here.
View all notes |
Alert me of new notes |
CANSLIM.net Company Profile |
SEC |
Zacks Reports |
StockTalk |
News |
Chart |
Request a new note
C
A N
S L
I M
|
ALLT
-
NASDAQ
Allot Communications Ltd
COMPUTER SOFTWARE andamp; SERVICES - Technical andamp; System Software
|
$24.70
|
+0.04
0.16% |
$24.85
|
189,614
41.81% of 50 DAV
50 DAV is 453,500
|
$25.36
-2.60%
|
3/13/2012
|
$19.72
|
PP = $18.91
|
|
MB = $19.86
|
Most Recent Note - 4/26/2012 3:45:01 PM
G - Up today with lighter than average volume, poised for a best-ever close. Volume totals have been cooling while stubbornly holding its ground, a sign that few are exiting. It has not formed a sound new base while staying well above its 50 DMA line and prior highs near $18-19 that define support to watch on pullbacks.
>>> The latest Featured Stock Update with an annotated graph appeared on 3/19/2012. Click here.
View all notes |
Alert me of new notes |
CANSLIM.net Company Profile |
SEC |
Zacks Reports |
StockTalk |
News |
Chart |
Request a new note
C
A N
S L
I M
|
ALXN
-
NASDAQ
Alexion Pharmaceuticals
DRUGS - Drug Manufacturers - Other
|
$90.56
|
+1.18
1.32% |
$91.74
|
1,031,398
82.86% of 50 DAV
50 DAV is 1,244,700
|
$95.01
-4.68%
|
3/12/2012
|
$87.87
|
PP = $87.73
|
|
MB = $92.12
|
Most Recent Note - 4/24/2012 12:00:40 PM
G - Gapped up today but then reversed into the red. Recently found support at its 50 DMA line, and it is now consolidating above that important short-term average, possibly building a new late-stage base.
>>> The latest Featured Stock Update with an annotated graph appeared on 4/16/2012. Click here.
View all notes |
Alert me of new notes |
CANSLIM.net Company Profile |
SEC |
Zacks Reports |
StockTalk |
News |
Chart |
Request a new note
C
A N
S L
I M
|
ARBA
-
NASDAQ
Ariba Inc
INTERNET - Internet Software and Services
|
$39.35
|
+3.99
11.28% |
$40.45
|
5,009,932
586.85% of 50 DAV
50 DAV is 853,700
|
$37.14
5.95%
|
4/27/2012
|
$38.53
|
PP = $37.24
|
|
MB = $39.10
|
 Most Recent Note - 4/27/2012 11:54:29 AM
Y - Color code is changed to yellow with pivot point cited based on its 7/11/11 high plus 10 cents. Reported earnings +32% on +21% sales revenues for the quarter ended March 31, 2012 versus the year ago period. Technically it broke out of a long choppy base formed since July as it gapped up and rallied for new highs with a considerable volume-driven gain. On track for its 12th weekly gain in the span of 13 weeks. The Sep and Dec '11 quarterly comparisons showed earnings increases above the +25% guideline, and its annual earnings (A criteria) history has been good.
There are no Featured Stock Updates™ available for this stock at this time. You may request one by clicking the Request a New Note link below
View all notes |
Alert me of new notes |
CANSLIM.net Company Profile |
SEC |
Zacks Reports |
StockTalk |
News |
Chart |
Request a new note
C
A N
S L
I M
|
Symbol/Exchange
Company Name
Industry Group |
PRICE |
CHANGE
(%Change) |
Day High |
Volume
(% DAV)
(% 50 day avg vol) |
52 Wk Hi
% From Hi |
Featured
Date |
Price
Featured |
Pivot Featured |
|
Max Buy |
BODY
-
NASDAQ
Body Central Corp
RETAIL - Catalog andamp; Mail Order Houses
|
$30.69
|
+1.71
5.90% |
$30.88
|
192,770
101.09% of 50 DAV
50 DAV is 190,700
|
$29.49
4.07%
|
4/18/2012
|
$27.44
|
PP = $29.59
|
|
MB = $31.07
|
Most Recent Note - 4/27/2012 3:46:51 PM
Y - Considerable gain today above the pivot point for a new high, however volume is not running at a very heavy pace. Gains above the pivot point backed by a minimum of +40% above average volume are needed to trigger a proper new (or add-on) technical buy signal.
>>> The latest Featured Stock Update with an annotated graph appeared on 3/13/2012. Click here.
View all notes |
Alert me of new notes |
CANSLIM.net Company Profile |
SEC |
Zacks Reports |
StockTalk |
News |
Chart |
Request a new note
C
A N
S L
I M
|
CDNS
-
NASDAQ
Cadence Design Systems
COMPUTER SOFTWARE and SERVICES - Technical and System Software
|
$11.86
|
-0.02
-0.17% |
$11.91
|
2,963,520
102.86% of 50 DAV
50 DAV is 2,881,200
|
$12.60
-5.87%
|
2/3/2012
|
$11.66
|
PP = $11.15
|
|
MB = $11.71
|
Most Recent Note - 4/25/2012 10:25:25 AM
G - Up today following a streak of 5 consecutive losses and distributional pressure that briefly undercut the prior low ($11.20 on 4/10/12) and raised more serious concerns. Its 50 DMA line acted as resistance since last noted, and a rebound above that important short-term average is needed for its technical stance and outlook to improve.
>>> The latest Featured Stock Update with an annotated graph appeared on 3/28/2012. Click here.
View all notes |
Alert me of new notes |
CANSLIM.net Company Profile |
SEC |
Zacks Reports |
StockTalk |
News |
Chart |
Request a new note
C
A N
S L
I M
|
CELG
-
NASDAQ
Celgene Corp
DRUGS - Drug Manufacturers - Major
|
$73.38
|
+0.46
0.63% |
$73.56
|
6,037,128
213.09% of 50 DAV
50 DAV is 2,833,200
|
$80.42
-8.75%
|
2/2/2012
|
$74.16
|
PP = $75.21
|
|
MB = $78.97
|
Most Recent Note - 4/26/2012 12:09:02 PM
G - Reported earnings +30% on +13% sales revenues for the quarter ended March 31, 2012 versus the year ago period. Volume and volatility often increase near earnings news. It gapped down today, violating its 50 DMA line and triggering a technical sell signal. Only a prompt rebound above its 50 DMA line would help its outlook improve.
>>> The latest Featured Stock Update with an annotated graph appeared on 3/26/2012. Click here.
View all notes |
Alert me of new notes |
CANSLIM.net Company Profile |
SEC |
Zacks Reports |
StockTalk |
News |
Chart |
Request a new note
C
A N
S L
I M
|
CERN
-
NASDAQ
Cerner Corp
COMPUTER SOFTWARE and SERVICES - Healthcare Information Service
|
$77.51
|
+3.69
5.00% |
$79.82
|
2,972,812
297.88% of 50 DAV
50 DAV is 998,000
|
$78.53
-1.30%
|
4/27/2012
|
$77.23
|
PP = $78.63
|
|
MB = $82.56
|
Most Recent Note - 4/27/2012 12:09:42 PM
Y - Color code is changed to yellow with pivot point cited based on its 3/26/12 high plus 10 cents after a 5 week consolidation that included a dip below its 50 DMA line. This Computer Software - Medical firm hit a new 52-week high today, and while no overhead supply remains to act as resistance, a strong finish may clinch a technical buy signal. Reported earnings +35% on +30% sales revenues for the quarter ended March 31, 2012 versus the year ago period. Its quarterly sales revenues and earnings per share track record and its annual earnings history (C and A criteria) satisfy the investment system's fundamental guidelines. The number of top-rated funds owning its shares rose from 885 in Jun '11 to 996 in Mar '12, a reassuring sign concerning the I criteria. It is already heavily owned by the institutional crowd.
>>> The latest Featured Stock Update with an annotated graph appeared on 10/27/2005. Click here.
View all notes |
Alert me of new notes |
CANSLIM.net Company Profile |
SEC |
Zacks Reports |
StockTalk |
News |
Chart |
Request a new note
C
A N
S L
I M
|
COO
-
NYSE
Cooper Companies Inc
HEALTH SERVICES - Medical Instruments and Supplies
|
$88.56
|
+2.09
2.42% |
$88.74
|
429,093
97.74% of 50 DAV
50 DAV is 439,000
|
$87.54
1.17%
|
3/9/2012
|
$83.05
|
PP = $81.02
|
|
MB = $85.07
|
Most Recent Note - 4/25/2012 10:32:17 AM
G - Up today without great volume conviction while trading to new 52-week and all-time highs above its "max buy" level. Color code is changed to green after getting extended from its prior base.
>>> The latest Featured Stock Update with an annotated graph appeared on 3/9/2012. Click here.
View all notes |
Alert me of new notes |
CANSLIM.net Company Profile |
SEC |
Zacks Reports |
StockTalk |
News |
Chart |
Request a new note
C
A N
S L
I M
|
Symbol/Exchange
Company Name
Industry Group |
PRICE |
CHANGE
(%Change) |
Day High |
Volume
(% DAV)
(% 50 day avg vol) |
52 Wk Hi
% From Hi |
Featured
Date |
Price
Featured |
Pivot Featured |
|
Max Buy |
DISH
-
NASDAQ
Dish Network Corp Cl A
CONSUMER DURABLES - Electronic Equipment
|
$32.15
|
+0.34
1.07% |
$32.33
|
1,082,253
42.51% of 50 DAV
50 DAV is 2,546,100
|
$35.64
-9.79%
|
3/7/2012
|
$30.83
|
PP = $30.10
|
|
MB = $31.61
|
Most Recent Note - 4/25/2012 8:13:52 PM
G - Today's gain on light volume helped it bounce from important support at its 50 DMA line. Continued support near that important short-term average would help its outlook, but further deterioration would raise more serious concerns.
>>> The latest Featured Stock Update with an annotated graph appeared on 3/14/2012. Click here.
View all notes |
Alert me of new notes |
CANSLIM.net Company Profile |
SEC |
Zacks Reports |
StockTalk |
News |
Chart |
Request a new note
C
A N
S L
I M
|
EXPE
-
NASDAQ
Expedia Inc
INTERNET - Internet Information Providers
|
$40.31
|
+7.68
23.54% |
$43.00
|
24,787,987
720.56% of 50 DAV
50 DAV is 3,440,100
|
$35.57
13.33%
|
4/27/2012
|
$41.80
|
PP = $35.57
|
|
MB = $37.35
|
Most Recent Note - 4/27/2012 12:23:21 PM
Y - Color code is changed to yellow with pivot point cited based on its 3/26/12 high plus 10 cents. Considerable "breakaway gap" up today for new 52-week highs came after reporting earnings +63% on +12% sales revenues for the quarter ended March 31, 2012 versus the year ago period. Quarterly earnings have been above the +25% minimum guideline in 3 of the past 4 comparisons and its annual earnings (A criteria) history has been good.
There are no Featured Stock Updates™ available for this stock at this time. You may request one by clicking the Request a New Note link below
View all notes |
Alert me of new notes |
CANSLIM.net Company Profile |
SEC |
Zacks Reports |
StockTalk |
News |
Chart |
Request a new note
C
A N
S L
I M
|
FEIC
-
NASDAQ
F E I Co
ELECTRONICS - Diversified Electronics
|
$50.23
|
+0.67
1.35% |
$50.34
|
239,456
78.61% of 50 DAV
50 DAV is 304,600
|
$49.92
0.62%
|
12/7/2011
|
$41.41
|
PP = $42.35
|
|
MB = $44.47
|
Most Recent Note - 4/25/2012 10:19:54 AM
G - Consolidating above its 50 DMA line, building a new base. The latest quarterly report showed +21% earnings for the Dec '11 quarter, below the +25% minimum guideline for earnings growth.
>>> The latest Featured Stock Update with an annotated graph appeared on 3/12/2012. Click here.
View all notes |
Alert me of new notes |
CANSLIM.net Company Profile |
SEC |
Zacks Reports |
StockTalk |
News |
Chart |
Request a new note
C
A N
S L
I M
|
GNC
-
NYSE
G N C Holdings Inc
RETAIL - Drug Stores
|
$40.99
|
+0.90
2.24% |
$41.95
|
2,134,450
117.87% of 50 DAV
50 DAV is 1,810,800
|
$40.82
0.42%
|
1/19/2012
|
$28.99
|
PP = $29.60
|
|
MB = $31.08
|
Most Recent Note - 4/26/2012 5:48:02 PM
G - Held its ground today following a considerable gap up gain with heavy volume for a new all-time high on the prior session after reporting earnings +82% on +23% sales revenues for the quarter ended March 31, 2012 versus the year ago period. See the latest FSU analysis for more details and a new annotated graph.
>>> The latest Featured Stock Update with an annotated graph appeared on 4/26/2012. Click here.
View all notes |
Alert me of new notes |
CANSLIM.net Company Profile |
SEC |
Zacks Reports |
StockTalk |
News |
Chart |
Request a new note
C
A N
S L
I M
|
HLF
-
NYSE
Herbalife Ltd
DRUGS - Nutrition and Weight Management
|
$70.47
|
-1.76
-2.44% |
$72.99
|
2,248,122
155.05% of 50 DAV
50 DAV is 1,449,900
|
$73.00
-3.47%
|
4/18/2012
|
$71.19
|
PP = $72.21
|
|
MB = $75.82
|
Most Recent Note - 4/26/2012 3:47:30 PM
Y - Up today without great volume conviction while rising above its pivot point near its 52-week high. Found support at its 50 DMA line after a damaging 4/24/12 loss. Previously noted - "Churning above average volume this week without making meaningful price progress above prior highs. Volume-driven gains for new highs did not trigger a proper new (or add-on) technical buy signal."
>>> The latest Featured Stock Update with an annotated graph appeared on 4/13/2012. Click here.
View all notes |
Alert me of new notes |
CANSLIM.net Company Profile |
SEC |
Zacks Reports |
StockTalk |
News |
Chart |
Request a new note
C
A N
S L
I M
|
Symbol/Exchange
Company Name
Industry Group |
PRICE |
CHANGE
(%Change) |
Day High |
Volume
(% DAV)
(% 50 day avg vol) |
52 Wk Hi
% From Hi |
Featured
Date |
Price
Featured |
Pivot Featured |
|
Max Buy |
ISRG
-
NASDAQ
Intuitive Surgical Inc
HEALTH SERVICES - Medical Appliances and Equipment
|
$585.82
|
+9.18
1.59% |
$586.36
|
252,353
88.24% of 50 DAV
50 DAV is 286,000
|
$594.89
-1.53%
|
12/20/2011
|
$442.43
|
PP = $449.16
|
|
MB = $471.62
|
Most Recent Note - 4/26/2012 4:05:31 PM
G - Hovering near its all-time high with volume totals cooling since a considerable gap up gain on 4/18/12. It may produce more climactic gains, however it has not spent much time basing since its last "Featured Date" when highlighted in yellow on 12/23/11. Disciplined investors always limit losses if any stock falls -7% from their purchase price. It is on track for an 11th consecutive weekly gain.
>>> The latest Featured Stock Update with an annotated graph appeared on 3/1/2012. Click here.
View all notes |
Alert me of new notes |
CANSLIM.net Company Profile |
SEC |
Zacks Reports |
StockTalk |
News |
Chart |
Request a new note
C
A N
S L
I M
|
JAZZ
-
NASDAQ
Jazz Pharmaceuticals Plc
DRUGS - Biotechnology
|
$51.72
|
+6.52
14.42% |
$54.50
|
4,298,242
443.62% of 50 DAV
50 DAV is 968,900
|
$53.10
-2.60%
|
4/27/2012
|
$51.93
|
PP = $51.39
|
|
MB = $53.96
|
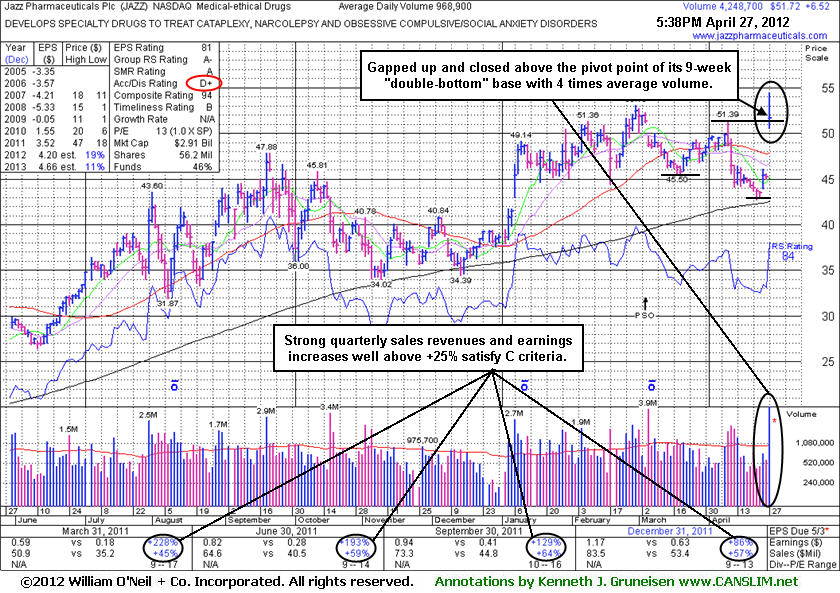
Most Recent Note - 4/27/2012 6:07:32 PM
Y - Considerable gap up gain today backed by 4 times average volume, rising from a "double bottom" base and touching a new all-time high. Color code was changed to yellow and pivot point cited is based on its 4/10/12 high in the mid-day report. See the latest FSU analysis for more details and a new annotated graph.
>>> The latest Featured Stock Update with an annotated graph appeared on 4/27/2012. Click here.
View all notes |
Alert me of new notes |
CANSLIM.net Company Profile |
SEC |
Zacks Reports |
StockTalk |
News |
Chart |
Request a new note
C
A N
S L
I M
|
LULU
-
NASDAQ
Lululemon Athletica
MANUFACTURING - Textile Manufacturing
|
$74.71
|
+1.29
1.76% |
$74.91
|
1,667,975
82.84% of 50 DAV
50 DAV is 2,013,400
|
$77.13
-3.14%
|
1/10/2012
|
$60.97
|
PP = $59.46
|
|
MB = $62.43
|
Most Recent Note - 4/24/2012 2:06:21 PM
G - Raising concerns with yet another distribution day, it violated its 50 DMA line with today's loss on higher volume. Only a prompt rebound above its short-term average would help its outlook.
>>> The latest Featured Stock Update with an annotated graph appeared on 4/12/2012. Click here.
View all notes |
Alert me of new notes |
CANSLIM.net Company Profile |
SEC |
Zacks Reports |
StockTalk |
News |
Chart |
Request a new note
C
A N
S L
I M
|
MA
-
NYSE
Mastercard Inc Cl A
DIVERSIFIED SERVICES - Business/Management Services
|
$457.58
|
+3.60
0.79% |
$462.34
|
1,084,648
130.82% of 50 DAV
50 DAV is 829,100
|
$456.49
0.24%
|
3/12/2012
|
$419.86
|
PP = $428.67
|
|
MB = $450.10
|
Most Recent Note - 4/25/2012 8:08:54 PM
Y - Considerable gain today with slightly above average volume for new 52-week and all-time highs. This week it tested its 50 DMA line and found support.
>>> The latest Featured Stock Update with an annotated graph appeared on 4/11/2012. Click here.
View all notes |
Alert me of new notes |
CANSLIM.net Company Profile |
SEC |
Zacks Reports |
StockTalk |
News |
Chart |
Request a new note
C
A N
S L
I M
|
MELI
-
NASDAQ
Mercadolibre Inc
INTERNET - Internet Software and; Services
|
$94.85
|
+2.38
2.57% |
$95.25
|
461,505
94.36% of 50 DAV
50 DAV is 489,100
|
$104.50
-9.23%
|
2/6/2012
|
$97.09
|
PP = $95.58
|
|
MB = $100.36
|
Most Recent Note - 4/25/2012 8:10:03 PM
G - It remains well below its 50 DMA line while today's gain on light volume broke a streak of 3 consecutive losses. It now faces resistance due to overhead supply up through the $104 level that will hinder its progress.
>>> The latest Featured Stock Update with an annotated graph appeared on 3/29/2012. Click here.
View all notes |
Alert me of new notes |
CANSLIM.net Company Profile |
SEC |
Zacks Reports |
StockTalk |
News |
Chart |
Request a new note
C
A N
S L
I M
|
Symbol/Exchange
Company Name
Industry Group |
PRICE |
CHANGE
(%Change) |
Day High |
Volume
(% DAV)
(% 50 day avg vol) |
52 Wk Hi
% From Hi |
Featured
Date |
Price
Featured |
Pivot Featured |
|
Max Buy |
MG
-
NYSE
Mistras Group Inc
DIVERSIFIED SERVICES - Bulding and Faci;ity Management Services
|
$24.36
|
+0.90
3.84% |
$24.46
|
44,431
45.34% of 50 DAV
50 DAV is 98,000
|
$26.24
-7.16%
|
3/22/2012
|
$24.96
|
PP = $26.34
|
|
MB = $27.66
|
Most Recent Note - 4/27/2012 3:53:29 PM
G - Rallying from its 50 DMA line without great volume conviction behind today's gain. The recent low ($22.60 on 4/19/12) defines the next near-term support above its 200 DMA line. Previously noted - "A volume-driven gain above its recent chart high ($25.49 on 3/21/12) may help trigger a proper technical buy signal after a new base formation, however no new (lower) pivot point is currently being cited, and it may continue encountering stubborn resistance."
>>> The latest Featured Stock Update with an annotated graph appeared on 4/2/2012. Click here.
View all notes |
Alert me of new notes |
CANSLIM.net Company Profile |
SEC |
Zacks Reports |
StockTalk |
News |
Chart |
Request a new note
C
A N
S L
I M
|
MKTX
-
NASDAQ
Marketaxess Holdings Inc
FINANCIAL SERVICES - Investment Brokerage - Nationa
|
$34.75
|
-0.27
-0.77% |
$35.43
|
247,367
78.21% of 50 DAV
50 DAV is 316,300
|
$37.95
-8.43%
|
3/8/2012
|
$35.80
|
PP = $35.52
|
|
MB = $37.30
|
Most Recent Note - 4/26/2012 3:56:19 PM
Y - Volume driven-gains would be a welcome sign after recent distributional action. Trading near its session high after dipping below its 50 DMA line today. Gains lacked volume conviction after its intra-day violation of the 50 DMA line on 4/12/12
>>> The latest Featured Stock Update with an annotated graph appeared on 3/8/2012. Click here.
View all notes |
Alert me of new notes |
CANSLIM.net Company Profile |
SEC |
Zacks Reports |
StockTalk |
News |
Chart |
Request a new note
C
A N
S L
I M
|
NTES
-
NASDAQ
Netease Inc Adr
INTERNET - Internet Information Providers
|
$60.00
|
-0.42
-0.70% |
$60.39
|
615,953
89.44% of 50 DAV
50 DAV is 688,700
|
$61.45
-2.36%
|
3/19/2012
|
$56.18
|
PP = $55.10
|
|
MB = $57.86
|
Most Recent Note - 4/23/2012 2:53:14 PM
G - Consolidating just above its "max buy" level and its color code is changed to green. Recent lows and prior highs in the $55 area define important near-term chart support to watch above its 50 DMA line.
>>> The latest Featured Stock Update with an annotated graph appeared on 3/27/2012. Click here.
View all notes |
Alert me of new notes |
CANSLIM.net Company Profile |
SEC |
Zacks Reports |
StockTalk |
News |
Chart |
Request a new note
C
A N
S L
I M
|
PCLN
-
NASDAQ
Priceline.Com Inc
INTERNET - Internet Software and Services
|
$762.13
|
+28.86
3.94% |
$767.50
|
1,849,379
159.26% of 50 DAV
50 DAV is 1,161,200
|
$774.96
-1.66%
|
4/27/2012
|
$539.46
|
PP = $774.96
|
|
MB = $813.71
|
Most Recent Note - 4/27/2012 12:53:39 PM
Y - Gapped up today, rallying from support at its 50 DMA line to within close striking distance of its 52-week high. Color code is changed to yellow while rallying from its first test of its 10-week moving average (WMA) since breaking out above resistance in the $554 area in February. In the Certification they teach that after an earlier breakout a secondary buy point exists between the first successful test of the 10 WMA up to +5% above its latest high. The 2-week consolidation is not considered a sound base pattern, yet the pivot point cited is based on that recent high. Prior mid-day reports noted - "Technically, it broke out on 2/13/12 with a volume-driven gain, and now it is getting extended from its prior base. Fundamentals have remained strong since dropped from the Featured Stocks list on 9/29/11. Patient investors may watch for secondary buy points to possibly develop and be noted."
>>> The latest Featured Stock Update with an annotated graph appeared on 9/22/2011. Click here.
View all notes |
Alert me of new notes |
CANSLIM.net Company Profile |
SEC |
Zacks Reports |
StockTalk |
News |
Chart |
Request a new note
C
A N
S L
I M
|
RAX
-
NYSE
Rackspace Hosting Inc
INTERNET - Internet Software and; Services
|
$59.04
|
+0.60
1.03% |
$59.75
|
1,433,754
80.82% of 50 DAV
50 DAV is 1,773,900
|
$60.00
-1.60%
|
4/26/2012
|
$58.39
|
PP = $59.53
|
|
MB = $62.51
|
Most Recent Note - 4/26/2012 3:35:07 PM
Y - Considerable gain today after promptly rebounding to and above its 50 DMA line helping its technical stance. Color code is changed to yellow with new pivot point cited based on its 3/27/12 high plus 10 cents following a 5-week consolidation. Volume-driven gains for new highs may trigger a new (or add-on) technical buy signal.
>>> The latest Featured Stock Update with an annotated graph appeared on 4/10/2012. Click here.
View all notes |
Alert me of new notes |
CANSLIM.net Company Profile |
SEC |
Zacks Reports |
StockTalk |
News |
Chart |
Request a new note
C
A N
S L
I M
|
Symbol/Exchange
Company Name
Industry Group |
PRICE |
CHANGE
(%Change) |
Day High |
Volume
(% DAV)
(% 50 day avg vol) |
52 Wk Hi
% From Hi |
Featured
Date |
Price
Featured |
Pivot Featured |
|
Max Buy |
RGR
-
NYSE
Sturm Ruger & Co Inc
CONSUMER DURABLES - Sporting Goods
|
$55.14
|
+0.51
0.93% |
$55.42
|
699,767
167.69% of 50 DAV
50 DAV is 417,300
|
$56.28
-2.03%
|
3/22/2012
|
$46.49
|
PP = $46.78
|
|
MB = $49.12
|
Most Recent Note - 4/26/2012 3:37:10 PM
G - Hitting a new 52-week high today with above average volume behind its gain, getting more extended from any sound base. Found prompt support after a pullback near its prior high in the $46 area previously noted as support to watch above its 50 DMA line.
>>> The latest Featured Stock Update with an annotated graph appeared on 3/22/2012. Click here.
View all notes |
Alert me of new notes |
CANSLIM.net Company Profile |
SEC |
Zacks Reports |
StockTalk |
News |
Chart |
Request a new note
C
A N
S L
I M
|
RNF
-
NYSE
Rentech Nitrogen Ptnr Lp
CHEMICALS - Agricultural Chemicals
|
$29.26
|
+1.01
3.58% |
$29.91
|
699,545
352.95% of 50 DAV
50 DAV is 198,200
|
$28.87
1.35%
|
4/27/2012
|
$29.32
|
PP = $28.60
|
|
MB = $30.03
|
Most Recent Note - 4/27/2012 1:04:57 PM
Y - Hit a new 52-week high today with a gap up gain. The recent orderly consolidation in a tight range was longer than a "3-weeks tight" base pattern. Color code is changed to yellow with pivot point cited based on its 4/12/12 high plus 10 cents. It has sufficient ranks and showed strong earnings increases satisfying the C criteria. Its 11/04/11 IPO was priced at $20, and its limited history is a concern.
There are no Featured Stock Updates™ available for this stock at this time. You may request one by clicking the Request a New Note link below
View all notes |
Alert me of new notes |
CANSLIM.net Company Profile |
SEC |
Zacks Reports |
StockTalk |
News |
Chart |
Request a new note
C
A N
S L
I M
|
RRTS
-
NYSE
Roadrunner Trans Systems
TRANSPORTATION - Air Delivery and Freight Service
|
$16.95
|
+0.22
1.32% |
$16.98
|
114,821
115.86% of 50 DAV
50 DAV is 99,100
|
$18.59
-8.82%
|
2/10/2012
|
$17.40
|
PP = $17.50
|
|
MB = $18.38
|
Most Recent Note - 4/24/2012 4:47:46 PM
G - Down today with higher (near average) volume. Its 50 DMA line acted as resistance when it rebounded from its latest lows. After finding recent support, any subsequent deterioration below the prior low ($16.65 on 4/10/12) would raise more serious concerns and trigger more worrisome sell signals.
>>> The latest Featured Stock Update with an annotated graph appeared on 4/9/2012. Click here.
View all notes |
Alert me of new notes |
CANSLIM.net Company Profile |
SEC |
Zacks Reports |
StockTalk |
News |
Chart |
Request a new note
C
A N
S L
I M
|
SHFL
-
NASDAQ
Shuffle Master Inc
MANUFACTURING - Diversified Machinery
|
$17.87
|
+0.74
4.32% |
$18.37
|
942,134
141.14% of 50 DAV
50 DAV is 667,500
|
$18.77
-4.79%
|
3/6/2012
|
$17.07
|
PP = $15.25
|
|
MB = $16.01
|
Most Recent Note - 4/27/2012 3:49:47 PM
G - Considerable gain today backed by above average volume, challenging its 52-week high. Found support at its 50 DMA line recently, important near-term chart support to watch. Recent consolidation is not a sufficient length base pattern.
>>> The latest Featured Stock Update with an annotated graph appeared on 3/15/2012. Click here.
View all notes |
Alert me of new notes |
CANSLIM.net Company Profile |
SEC |
Zacks Reports |
StockTalk |
News |
Chart |
Request a new note
C
A N
S L
I M
|
SHOO
-
NASDAQ
Steven Madden Limited
CONSUMER NON-DURABLES - Textile - Apparel Footwear
|
$43.19
|
-0.89
-2.02% |
$44.35
|
803,419
235.19% of 50 DAV
50 DAV is 341,600
|
$45.70
-5.49%
|
4/27/2012
|
$43.20
|
PP = $45.32
|
|
MB = $47.59
|
Most Recent Note - 4/27/2012 1:11:00 PM
Y - Color code is changed to yellow with pivot point cited based on its 3/26/12 high while it is still working on a "double bottom" base pattern. Sales revenues showed impressive acceleration in the Jun, Sep, and Dec '11 quarterly comparisons with earnings increases above the +25% minimum guideline in the 2 latest comparisons. Subsequent volume-driven gains above the pivot point may trigger a technical buy signal, meanwhile it is ideal for investors' watchlists.
>>> The latest Featured Stock Update with an annotated graph appeared on 1/4/2011. Click here.
View all notes |
Alert me of new notes |
CANSLIM.net Company Profile |
SEC |
Zacks Reports |
StockTalk |
News |
Chart |
Request a new note
C
A N
S L
I M
|
Symbol/Exchange
Company Name
Industry Group |
PRICE |
CHANGE
(%Change) |
Day High |
Volume
(% DAV)
(% 50 day avg vol) |
52 Wk Hi
% From Hi |
Featured
Date |
Price
Featured |
Pivot Featured |
|
Max Buy |
SWI
-
NYSE
Solarwinds Inc
COMPUTER SOFTWARE and SERVICES - Application Software
|
$46.60
|
+1.22
2.69% |
$46.38
|
1,593,730
146.50% of 50 DAV
50 DAV is 1,087,900
|
$46.38
0.47%
|
4/26/2012
|
$45.15
|
PP = $42.32
|
|
MB = $44.44
|
Most Recent Note - 4/27/2012 6:58:59 PM
G - Color code is changed to green after getting more extended from its prior highs with today's 3rd consecutive volume-driven gain. The volume-driven gain to new highs triggered a new buy signal on 4/26/12 as it was featured in the mid-day report and noted - "Reported earnings +43% on +39% sales revenues for the quarter ended March 31, 2012 versus the year ago period. It held its ground stubbornly after violating its 50 DMA line when a damaging loss with above average volume triggered technical sell signals on 4/10/12 and it was dropped from the Featured Stocks list. Earnings below the +25% guideline for the Dec '11 quarter (+21%) had also raised fundamental concerns at that time, however the stock's resilience and impressive acceleration means that 3 of the past 4 quarterly comparisons are now above the minimum guideline concerning the C criteria. Its annual earnings (A criteria) history has been strong."
>>> The latest Featured Stock Update with an annotated graph appeared on 3/16/2012. Click here.
View all notes |
Alert me of new notes |
CANSLIM.net Company Profile |
SEC |
Zacks Reports |
StockTalk |
News |
Chart |
Request a new note
C
A N
S L
I M
|
SXCI
-
NASDAQ
S X C Health Solutions
COMPUTER SOFTWARE and SERVICES - Healthcare Information Service
|
$91.71
|
+0.04
0.04% |
$93.18
|
994,788
111.12% of 50 DAV
50 DAV is 895,200
|
$100.50
-8.75%
|
2/23/2012
|
$68.24
|
PP = $66.05
|
|
MB = $69.35
|
Most Recent Note - 4/23/2012 2:44:55 PM
G - Perched near its all-time high today, very extended from its prior base. The market cheered the 4/18/12 news it will acquire and merge with Catalyst Health Solutions Inc (CHSI), rallying with volume-driven gains.
>>> The latest Featured Stock Update with an annotated graph appeared on 3/6/2012. Click here.
View all notes |
Alert me of new notes |
CANSLIM.net Company Profile |
SEC |
Zacks Reports |
StockTalk |
News |
Chart |
Request a new note
C
A N
S L
I M
|
TDG
-
NYSE
Transdigm Group Inc
AEROSPACE/DEFENSE - Aerospace/Defense Products and; Services
|
$127.14
|
+1.73
1.38% |
$126.40
|
506,455
123.08% of 50 DAV
50 DAV is 411,500
|
$126.40
0.59%
|
2/29/2012
|
$120.10
|
PP = $118.93
|
|
MB = $124.88
|
Most Recent Note - 4/25/2012 1:29:42 PM
Y - Small gap up today, hitting new 52-week and all-time highs and approaching the previously cited "max buy" level. Solid gain on 4/20/12 with +75% above average volume met the guideline for a proper technical buy signal. The encouraging sign of fresh institutional buying demand may signal the beginning of a meaningful leg up, but keep in mind 3 out of 4 stocks follow the direction of the major averages (M criteria) and the market has recently been pulling back under distributional pressure. Prior highs in the $118-121 area define initial chart support to watch on pullbacks.
>>> The latest Featured Stock Update with an annotated graph appeared on 3/30/2012. Click here.
View all notes |
Alert me of new notes |
CANSLIM.net Company Profile |
SEC |
Zacks Reports |
StockTalk |
News |
Chart |
Request a new note
C
A N
S L
I M
|
TIBX
-
NASDAQ
Tibco Software Inc
COMPUTER SOFTWARE and SERVICES - Business Software and Services
|
$33.18
|
-0.08
-0.24% |
$33.52
|
2,024,306
69.61% of 50 DAV
50 DAV is 2,907,900
|
$34.67
-4.30%
|
3/30/2012
|
$31.01
|
PP = $31.25
|
|
MB = $32.81
|
Most Recent Note - 4/26/2012 4:01:26 PM
G - Up today for a 2nd consecutive gain on lighter volume. Traded under its "max buy" level this week yet found support above prior highs in the $31 area and its 50 DMA line. More damaging losses would raise serious concerns.
>>> The latest Featured Stock Update with an annotated graph appeared on 4/5/2012. Click here.
View all notes |
Alert me of new notes |
CANSLIM.net Company Profile |
SEC |
Zacks Reports |
StockTalk |
News |
Chart |
Request a new note
C
A N
S L
I M
|
TNGO
-
NASDAQ
Tangoe Inc
COMPUTER SOFTWARE and SERVICES - Technical and System Software
|
$21.18
|
+0.60
2.92% |
$20.94
|
243,511
37.67% of 50 DAV
50 DAV is 646,400
|
$21.74
-2.58%
|
3/27/2012
|
$19.35
|
PP = $20.00
|
|
MB = $21.00
|
Most Recent Note - 4/27/2012 6:54:51 PM
Y - Its 3 consecutive gains came on very light volume, yet it rallied to its second-best close. It found support near prior highs in the $20 area previously noted as initial support to watch on pullbacks following its 4/19/12 breakout. The 50 DMA line ($18.81 now) defines important support to watch.
>>> The latest Featured Stock Update with an annotated graph appeared on 4/3/2012. Click here.
View all notes |
Alert me of new notes |
CANSLIM.net Company Profile |
SEC |
Zacks Reports |
StockTalk |
News |
Chart |
Request a new note
C
A N
S L
I M
|
Symbol/Exchange
Company Name
Industry Group |
PRICE |
CHANGE
(%Change) |
Day High |
Volume
(% DAV)
(% 50 day avg vol) |
52 Wk Hi
% From Hi |
Featured
Date |
Price
Featured |
Pivot Featured |
|
Max Buy |
TSCO
-
NASDAQ
Tractor Supply Co
SPECIALTY RETAIL - Specialty Retail, Other
|
$99.48
|
+1.96
2.01% |
$99.46
|
723,615
94.95% of 50 DAV
50 DAV is 762,100
|
$101.20
-1.70%
|
1/12/2012
|
$79.12
|
PP = $75.58
|
|
MB = $79.36
|
Most Recent Note - 4/24/2012 4:08:07 PM
G - Loss today with higher volume indicated another day of distributional pressure. Still holding its ground near its all-time high, very extended from its prior base. Its 50 DMA line defines support to watch on pullbacks.
>>> The latest Featured Stock Update with an annotated graph appeared on 4/17/2012. Click here.
View all notes |
Alert me of new notes |
CANSLIM.net Company Profile |
SEC |
Zacks Reports |
StockTalk |
News |
Chart |
Request a new note
C
A N
S L
I M
|
UA
-
NYSE
Under Armour Inc Cl A
CONSUMER NON-DURABLES - Textile - Apparel Clothing
|
$98.89
|
+1.30
1.33% |
$97.90
|
1,084,019
109.55% of 50 DAV
50 DAV is 989,500
|
$102.86
-3.86%
|
2/15/2012
|
$85.77
|
PP = $84.86
|
|
MB = $89.10
|
Most Recent Note - 4/24/2012 12:36:11 PM
G - Slumping under prior highs with a loss today. No overhead supply remains to act as resistance, however no new pivot point was cited following its latest base. Concerns were raised by weaker fundamentals. Reported earnings +22% on +23% sales revenues for the quarter ended March 31, 2012 versus the year ago period, its first quarterly earnings increase below the +25% minimum guideline in more than 2 years.
>>> The latest Featured Stock Update with an annotated graph appeared on 4/4/2012. Click here.
View all notes |
Alert me of new notes |
CANSLIM.net Company Profile |
SEC |
Zacks Reports |
StockTalk |
News |
Chart |
Request a new note
C
A N
S L
I M
|
UBNT
-
NASDAQ
Ubiquiti Networks Inc
TELECOMMUNICATIONS - Diversified Communication Serv
|
$33.75
|
+1.01
3.08% |
$32.83
|
626,765
175.47% of 50 DAV
50 DAV is 357,200
|
$35.32
-4.45%
|
4/12/2012
|
$33.89
|
PP = $34.07
|
|
MB = $35.77
|
Most Recent Note - 4/27/2012 3:51:44 PM
Y - Rallying today with +47% above average volume thus far, trading above its pivot point within close striking distance of its best-ever close. Formed an advanced "ascending base" pattern marked by 3 pullbacks of 10-20% following its previous breakout. Prior low ($30.25 on 4/09/12) defines initial support above its 50 DMA line.
>>> The latest Featured Stock Update with an annotated graph appeared on 4/20/2012. Click here.
View all notes |
Alert me of new notes |
CANSLIM.net Company Profile |
SEC |
Zacks Reports |
StockTalk |
News |
Chart |
Request a new note
C
A N
S L
I M
|
ULTA
-
NASDAQ
Ulta Salon Cosm & Frag
SPECIALTY RETAIL - Specialty Retail, Other
|
$89.62
|
+0.09
0.10% |
$90.53
|
742,431
107.32% of 50 DAV
50 DAV is 691,800
|
$96.65
-7.27%
|
1/11/2012
|
$71.97
|
PP = $75.80
|
|
MB = $79.59
|
Most Recent Note - 4/24/2012 1:59:49 PM
G - Violated its 50 DMA line with heavy volume behind a damaging loss today raising concerns. Prior highs in the $75 area are the next important support level to watch. See the latest FSU analysis for more details and a new annotated graph.
>>> The latest Featured Stock Update with an annotated graph appeared on 4/23/2012. Click here.
View all notes |
Alert me of new notes |
CANSLIM.net Company Profile |
SEC |
Zacks Reports |
StockTalk |
News |
Chart |
Request a new note
C
A N
S L
I M
|
V
-
NYSE
Visa Inc Cl A
DIVERSIFIED SERVICES - Business/Management Services
|
$123.52
|
+0.33
0.27% |
$123.50
|
2,164,786
69.12% of 50 DAV
50 DAV is 3,131,900
|
$123.68
-0.13%
|
3/12/2012
|
$116.53
|
PP = $119.46
|
|
MB = $125.43
|
Most Recent Note - 4/26/2012 4:07:37 PM
Y - Gain today on light volume helped it finish a penny below its best-ever close. Found support near its 50 DMA line this week. Sputtering since its 4/13/12 gain backed by +49% above average volume technically confirmed a buy signal. Its 50 DMA line defines support to watch well above prior highs in the $103-104 area.
>>> The latest Featured Stock Update with an annotated graph appeared on 3/7/2012. Click here.
View all notes |
Alert me of new notes |
CANSLIM.net Company Profile |
SEC |
Zacks Reports |
StockTalk |
News |
Chart |
Request a new note
C
A N
S L
I M
|
Symbol/Exchange
Company Name
Industry Group |
PRICE |
CHANGE
(%Change) |
Day High |
Volume
(% DAV)
(% 50 day avg vol) |
52 Wk Hi
% From Hi |
Featured
Date |
Price
Featured |
Pivot Featured |
|
Max Buy |
VMW
-
NYSE
Vmware Inc Cl A
COMPUTER SOFTWARE andamp; SERVICES - Technical andamp; System Software
|
$112.41
|
+1.49
1.34% |
$111.40
|
1,591,806
99.98% of 50 DAV
50 DAV is 1,592,200
|
$118.79
-5.37%
|
4/18/2012
|
$110.04
|
PP = $115.29
|
|
MB = $121.05
|
Most Recent Note - 4/26/2012 3:40:08 PM
Y - Color code is changed to yellow after promptly repairing a brief 50 DMA line breach, technically showing signs it attracted institutional support near that important short-term average. Reported +38% earnings on +25% sales revenues for the quarter ended March 31, 2012 versus the year ago period.
>>> The latest Featured Stock Update with an annotated graph appeared on 4/18/2012. Click here.
View all notes |
Alert me of new notes |
CANSLIM.net Company Profile |
SEC |
Zacks Reports |
StockTalk |
News |
Chart |
Request a new note
C
A N
S L
I M
|
VSI
-
NYSE
Vitamin Shoppe Inc
SPECIALTY RETAIL - Specialty Retail, Other
|
$48.90
|
+0.74
1.54% |
$48.39
|
291,763
89.50% of 50 DAV
50 DAV is 326,000
|
$48.39
1.05%
|
4/25/2012
|
$47.77
|
PP = $48.46
|
|
MB = $50.88
|
Most Recent Note - 4/26/2012 3:42:03 PM
Y - Up today without great volume conviction, rising within pennies of its 52-week high and pivot point. Color code was changed to yellow with pivot point based on its 7/05/11 high after a near 10-month cup shaped base. See the latest FSU analysis for more details and an annotated graph.
>>> The latest Featured Stock Update with an annotated graph appeared on 4/25/2012. Click here.
View all notes |
Alert me of new notes |
CANSLIM.net Company Profile |
SEC |
Zacks Reports |
StockTalk |
News |
Chart |
Request a new note
C
A N
S L
I M
|