***Last / Change / Volume quote data in this table corresponds with the timestamp on the note***
Symbol/Exchange
Company Name
Industry Group |
Last |
Chg. |
Vol
% DAV |
Date Featured |
Price Featured |
Latest Pivot Point
Featured |
Status |
| Latest Max Buy Price |
AMZN
- NASDAQ
Amazon.com Inc
INTERNET - Internet Software & Services
|
$141.95
|
-5.16
|
7,994,249
105% DAV
7,585,400
|
4/23/2010
(Date
Featured) |
$144.41
(Price
Featured) |
PP = $146.01 |
Y |
| MB = $153.31 |
Most Recent Note - 4/27/2010 4:07:39 PM
Y - Gapped down for a loss today, falling below its pivot point amid widespread weakness. In recent weeks it rose from a 4-month cup shaped pattern to new multi-year highs. AMZN was featured in the 4/23/10 mid-day report (read here) while encountering distributional pressure following strong results for the March 31, 2010 quarter. Technically, it had risen above the pivot point cited (based on its 12/03/09 high plus .10) with twice average volume behind its 4/22/10 gain. Subsequent losses undercutting its old high closes would raise concerns. Recent quarterly comparisons show sales revenues acceleration with 3 consecutive quarterly earnings per share increases in the +60% range, along with a solid annual earning history - satisfying the C and A criteria.
>>> The latest Featured Stock Update with an annotated graph appeared on 4/23/2010. click here.
|
|
C
A
S
I |
News |
Chart |
SEC
View all notes Alert
me of new notes
Company
Profile
|
ARUN
- NASDAQ
Aruba Networks Inc
COMPUTER HARDWARE - Networking & Communication Dev
|
$13.34
|
-0.23
|
801,569
49% DAV
1,621,300
|
2/19/2010
(Date
Featured) |
$12.71
(Price
Featured) |
PP = $11.94 |
G |
| MB = $12.54 |
Most Recent Note - 4/27/2010 4:08:57 PM
G - Down today on light volume. It found prompt support last week near its 50 DMA line and above its recent chart low ($12.21 on 3/19/10).
>>> The latest Featured Stock Update with an annotated graph appeared on 3/31/2010. click here.
|
|
C
A
S
I |
News |
Chart |
SEC
View all notes Alert
me of new notes
Company
Profile
|
BIDU
- NASDAQ
Baidu Inc Ads
INTERNET - Internet Information Providers
|
$620.11
|
-20.74
|
1,288,680
87% DAV
1,473,400
|
1/13/2010
(Date
Featured) |
$431.25
(Price
Featured) |
PP = $426.75 |
G |
| MB = $448.09 |
Most Recent Note - 4/27/2010 4:11:40 PM
G - Gapped down today, falling from all-time highs with below average volume. After 12 consecutive weekly gains it is extended from any sound base, yet repeatedly noted it - "could produce more climactic gains, especially due to the small supply (S criteria) of shares outstanding. Earnings news is due on Wednesday, 4/28/10."
>>> The latest Featured Stock Update with an annotated graph appeared on 4/20/2010. click here.
|
|
C
A
S
I |
News |
Chart |
SEC
View all notes Alert
me of new notes
Company
Profile
|
BPI
- NYSE
Bridgepoint Education
DIVERSIFIED SERVICES - Education &; Training Services
|
$25.40
|
-0.58
|
331,626
75% DAV
442,100
|
4/13/2010
(Date
Featured) |
$25.59
(Price
Featured) |
PP = $25.76 |
Y |
| MB = $27.05 |
Most Recent Note - 4/27/2010 4:19:52 PM
Y- Negatively reversed today for a loss on lighter volume, closing below its pivot point. Fears that for-profit schools could be hurt by proposed regulatory changes hurt its peers this week. The Commercial Services - Schools firm was featured in yellow in the 4/13/10 mid-day report (read here) as rose from a cup-with-high-handle.
>>> The latest Featured Stock Update with an annotated graph appeared on 4/13/2010. click here.
|
|
C
A
S
I |
News |
Chart |
SEC
View all notes Alert
me of new notes
Company
Profile
|
BRLI
- NASDAQ
Bio Reference Labs Inc
HEALTH SERVICES - Medical Laboratories & Researc
|
$23.25
|
-0.38
|
174,469
88% DAV
198,000
|
2/12/2010
(Date
Featured) |
$39.02
(Price
Featured) |
PP = $20.49 |
G |
| MB = $21.51 |
Most Recent Note - 4/27/2010 4:25:02 PM
G - Pulling back on lighter volume after a big winning streak and a 2:1 stock split. Prior chart highs and its 50 DMA line are support levels to watch.
>>> The latest Featured Stock Update with an annotated graph appeared on 4/16/2010. click here.
|
|
C
A
S
I |
News |
Chart |
SEC
View all notes Alert
me of new notes
Company
Profile
|
CISG
- NASDAQ
Cninsure Inc Ads
INSURANCE - Insurance Brokers
|
$25.15
|
-1.26
|
248,600
97% DAV
257,300
|
3/3/2010
(Date
Featured) |
$24.38
(Price
Featured) |
PP = $23.10 |
G |
| MB = $24.26 |
Most Recent Note - 4/27/2010 4:27:33 PM
G - Considerable loss today on average volume, closing below its 50 DMA line, raising concerns. Its recent low ($24.77 on 4/19/10) helps define important support near earlier chart hghs. CISG traded up as much as +17.4% since featured in yellow in the 3/03/10 mid-day report (read here).
>>> The latest Featured Stock Update with an annotated graph appeared on 4/19/2010. click here.
|
|
C
A
S
I |
News |
Chart |
SEC
View all notes Alert
me of new notes
Company
Profile
|
CRM
- NYSE
Salesforce.com Inc
INTERNET - Internet Software & Services
|
$85.81
|
-2.68
|
1,276,185
73% DAV
1,749,500
|
3/5/2010
(Date
Featured) |
$72.28
(Price
Featured) |
PP = $75.53 |
G |
| MB = $79.31 |
Most Recent Note - 4/27/2010 4:31:35 PM
G - Pulling back from its all-time high, extended from prior chart highs and well above its "max buy" level. Patience may allow disciplined investors to accumulate shares without chasing it too far from a sound base.
>>> The latest Featured Stock Update with an annotated graph appeared on 4/21/2010. click here.
|
|
C
A
S
I |
News |
Chart |
SEC
View all notes Alert
me of new notes
Company
Profile
|
CTRP
- NASDAQ
Ctrip.com Intl Ltd Adr
LEISURE - Resorts & Casinos
|
$37.71
|
-1.73
|
1,282,212
65% DAV
1,964,200
|
3/25/2010
(Date
Featured) |
$40.74
(Price
Featured) |
PP = $39.40 |
Y |
| MB = $41.37 |
Most Recent Note - 4/27/2010 4:33:05 PM
Y - Slumped back under its 50 DMA line and its old pivot point with today's loss on light volume after showing encouraging signs of support in the past week. In recent months it has encountered stubborn resistance in the $40 area, so confirming gains with heavy volume for new highs would be a welcome reassurance shares are being accumulated. Distributional pressure has been noted since the 3/25/10 Stock Bulletin was published (read here).
>>> The latest Featured Stock Update with an annotated graph appeared on 4/12/2010. click here.
|
|
C
A
S
I |
News |
Chart |
SEC
View all notes Alert
me of new notes
Company
Profile
|
EZPW
- NASDAQ
Ezcorp Inc Cl A
SPECIALTY RETAIL - Specialty Retail, Other
|
$22.15
|
-1.19
|
757,852
144% DAV
527,700
|
4/14/2010
(Date
Featured) |
$21.80
(Price
Featured) |
PP = $22.29 |
Y |
| MB = $23.40 |
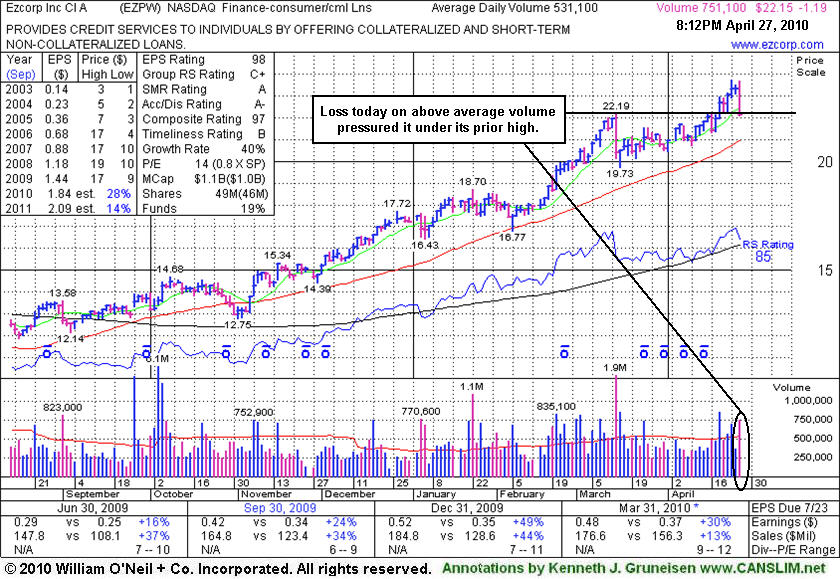
Most Recent Note - 4/27/2010 4:39:11 PM
Y - Considerable loss today on above average volume, closing below its pivot point, raising concerns. Rose from a 5-week flat base with no overhead supply to act as resistance for this high-ranked Finance - Consumer/Commercial Loans firm.
>>> The latest Featured Stock Update with an annotated graph appeared on 4/27/2010. click here.
|
|
C
A
S
I |
News |
Chart |
SEC
View all notes Alert
me of new notes
Company
Profile
|
ISRG
- NASDAQ
Intuitive Surgical Inc
HEALTH SERVICES - Medical Appliances & Equipment
|
$357.80
|
-4.37
|
470,438
81% DAV
577,700
|
4/13/2010
(Date
Featured) |
$363.46
(Price
Featured) |
PP = $367.10 |
Y |
| MB = $385.46 |
Most Recent Note - 4/27/2010 4:47:16 PM
Y - Consolidating quietly, and a subsequent violation of its recent chart low or 50 DMA line could raise more serious concerns. ISRG was featured again in the 4/13/10 mid-day report (read here) with new pivot point cited based on its 3/03/10 high.
>>> The latest Featured Stock Update with an annotated graph appeared on 4/7/2010. click here.
|
|
C
A
S
I |
News |
Chart |
SEC
View all notes Alert
me of new notes
Company
Profile
|
LL
- NYSE
Lumber Liquidators Hldgs
RETAIL - Home Improvement Stores
|
$30.60
|
-1.27
|
911,603
235% DAV
387,200
|
4/22/2010
(Date
Featured) |
$29.87
(Price
Featured) |
PP = $29.03 |
G |
| MB = $30.48 |
Most Recent Note - 4/27/2010 4:51:19 PM
G - Pulled back near its "max buy" level with a loss today after a worrisome negative reversal on the prior session. It is due to report earnings before the open on Wednesday, 4/28/10. First featured in yellow at $29.87 in the 4/22/10 the mid-day report (read here) - "rising from an orderly cup shaped pattern (without a proper handle) formed since last noted on 12/17/09. It rallied steadily after a 'breakaway gap' on 8/05/09 helped it clear stubborn resistance in the $17 area. Quarterly sales and earnings increases have recently shown encouraging acceleration while growth rates have previously been noted as below the investment system's guidelines."
>>> The latest Featured Stock Update with an annotated graph appeared on 4/26/2010. click here.
|
|
C
A
S
I |
News |
Chart |
SEC
View all notes Alert
me of new notes
Company
Profile
|
LOPE
- NASDAQ
Grand Canyon Education
DIVERSIFIED SERVICES - Education &; Training Services
|
$25.05
|
-0.78
|
840,081
244% DAV
344,900
|
4/13/2010
(Date
Featured) |
$27.71
(Price
Featured) |
PP = $27.33 |
G |
| MB = $28.70 |
Most Recent Note - 4/27/2010 7:11:22 PM
G - Down today on above average volume for a 5th consecutive loss. Closed under its prior chart lows as distributional pressure negated its breakout from an advanced "3-weeks tight" type pattern, leaving it just above important support at its 50 DMA line.
>>> The latest Featured Stock Update with an annotated graph appeared on 4/14/2010. click here.
|
|
C
A
S
I |
News |
Chart |
SEC
View all notes Alert
me of new notes
Company
Profile
|
PCLN
- NASDAQ
Priceline.com Inc
INTERNET - Internet Software & Services
|
$399.55
|
-4.72
|
584,812
N/A
|
11/1/2002
(Date
Featured) |
$399.55
(Price
Featured) |
PP = $428.20 |
Y |
| MB = $449.61 |
Most Recent Note - 1/2/2011
Y - Returns to Featured Stocks list with its appearance in the January 2011 CANSLIM.net News including detailed analysis and annotated daily and weekly graphs.
>>> The latest Featured Stock Update with an annotated graph appeared on 3/30/2010. click here.
|
|
C
A
S
I |
News |
Chart |
SEC
View all notes Alert
me of new notes
Company
Profile
|
ROVI
- NASDAQ
Rovi Corp
COMPUTER SOFTWARE & SERVICES - Security Software & Services
|
$39.20
|
-0.57
|
1,140,751
84% DAV
1,350,300
|
4/20/2010
(Date
Featured) |
$37.62
(Price
Featured) |
PP = $38.60 |
Y |
| MB = $40.53 |
Most Recent Note - 4/27/2010 7:15:25 PM
Y - Quietly perched near its 52-week high, its 50 DMA line and recent chart low ($35.91 on 4/08/10) define important support to watch. Earnings news is due on May 6th.
>>> The latest Featured Stock Update with an annotated graph appeared on 4/8/2010. click here.
|
|
C
A
S
I |
News |
Chart |
SEC
View all notes Alert
me of new notes
Company
Profile
|
SIRO
- NASDAQ
Sirona Dental Systems
HEALTH SERVICES - Medical Instruments & Supplies
|
$41.96
|
-0.08
|
482,237
88% DAV
546,000
|
2/16/2010
(Date
Featured) |
$36.43
(Price
Featured) |
PP = $36.15 |
G |
| MB = $37.96 |
Most Recent Note - 4/27/2010 7:16:29 PM
G - Pulling back on quieter volume following its 4/23/10 gap up for a considerable gain and new 52-week high. Extended from any sound base, its prior chart highs and 50 DMA line in the $36 area define an initial support level to watch. Earnings release is scheduled for May 5th.
>>> The latest Featured Stock Update with an annotated graph appeared on 4/22/2010. click here.
|
|
C
A
S
I |
News |
Chart |
SEC
View all notes Alert
me of new notes
Company
Profile
|
ULTA
- NASDAQ
Ulta Salon Cosm & Frag
SPECIALTY RETAIL - Specialty Retail, Other
|
$22.75
|
-2.22
|
1,542,925
392% DAV
393,600
|
3/12/2010
(Date
Featured) |
$22.81
(Price
Featured) |
PP = $21.72 |
G |
| MB = $22.81 |
Most Recent Note - 4/27/2010 7:18:44 PM
G - Traded near its 50 DMA line and pivot point, then found prompt support and closed in the middle of its intra-day range after gapping down today in reaction to an analyst downgrade. The distributional action followed a negative reversal on 4/26/10 after reaching a new 52-week high.
>>> The latest Featured Stock Update with an annotated graph appeared on 4/1/2010. click here.
|
|
C
A
S
I |
News |
Chart |
SEC
View all notes Alert
me of new notes
Company
Profile
|
VIT
-
|
$25.52
|
-0.85
|
581,688
89% DAV
652,700
|
4/9/2010
(Date
Featured) |
$23.79
(Price
Featured) |
PP = $23.95 |
G |
| MB = $25.15 |
Most Recent Note - 4/27/2010 7:19:16 PM
G - Extended above its "max buy" level, prior chart highs in the $23 area are an initial support level to watch above its 50 DMA line. Featured in the 4/09/10 mid-day report (read here).
>>> The latest Featured Stock Update with an annotated graph appeared on 4/9/2010. click here.
|
|
C
A
S
I |
News |
Chart |
SEC
View all notes Alert
me of new notes
Company
Profile
|
VPRT
- NASDAQ
Vistaprint Nv
DIVERSIFIED SERVICES - Business/Management Services
|
$60.09
|
-1.34
|
328,452
92% DAV
356,400
|
4/23/2010
(Date
Featured) |
$61.46
(Price
Featured) |
PP = $62.64 |
Y |
| MB = $65.77 |
Most Recent Note - 4/27/2010 7:20:48 PM
Y - Found support near its 50 DMA line, and its color code was changed to yellow with new pivot point cited. Volume +50% above average or greater is still required with a gain above its pivot point to trigger a proper technical buy signal.
>>> The latest Featured Stock Update with an annotated graph appeared on 4/15/2010. click here.
|
|
C
A
S
I |
News |
Chart |
SEC
View all notes Alert
me of new notes
Company
Profile
|