You are not logged in.
This means you
CAN ONLY VIEW reports that were published prior to Monday, April 14, 2025.
You
MUST UPGRADE YOUR MEMBERSHIP if you want to see any current reports.
AFTER MARKET UPDATE - THURSDAY, APRIL 26TH, 2012
Previous After Market Report Next After Market Report >>>
|
|
|
|
DOW |
+113.98 |
13,204.70 |
+0.87% |
|
Volume |
780,183,850 |
-5% |
|
Volume |
1,694,411,680 |
+1% |
|
NASDAQ |
+20.98 |
3,050.61 |
+0.69% |
|
Advancers |
2,061 |
65% |
|
Advancers |
1,574 |
60% |
|
S&P 500 |
+9.31 |
1,400.00 |
+0.67% |
|
Decliners |
974 |
31% |
|
Decliners |
947 |
36% |
|
Russell 2000 |
+6.21 |
818.33 |
+0.76% |
|
52 Wk Highs |
160 |
|
|
52 Wk Highs |
90 |
|
|
S&P 600 |
+3.59 |
457.45 |
+0.79% |
|
52 Wk Lows |
15 |
|
|
52 Wk Lows |
27 |
|
|
Make sure to read the bold portion of the Market Commentary carefully for important remarks regarding the current market direction (M criteria). Also, be sure to check out another "Ken's Mailbag Q&A" included below the Featured Stock table near the bottom of this evening's report.
|
 |
Weight of Evidence Argues Market Rally Still Continues
Kenneth J. Gruneisen - Passed the CAN SLIM® Master's Exam
U.S. equities rose on Thursday, adding to Wednesday's gains which helped the major averages rebound above their respective 50-day moving average lines. Volume totals were reported mixed, lighter than the prior session totals on the NYSE and slightly higher on the Nasdaq exchange. Advancers led decliners by about 2-1 on the NYSE and by about 3-2 on the Nasdaq exchange. The total number of stocks hitting new 52-week highs swelled even more meaningfully and easily outnumbered new 52-week lows on both the NYSE and on the Nasdaq exchange. There were 72 high-ranked companies from the CANSLIM.net Leaders List that made new 52-week highs and appeared on the CANSLIM.net BreakOuts Page, up considerably again from the prior session total of 48 stocks. The session concluded with gains for 28 of the 35 high-ranked companies currently included on the Featured Stocks Page.
The major averages advanced as an increase pending homes sales offset a slightly higher-than-expected weekly initial jobless claims report. The weekly initial jobless claims report showed 388,000 workers filed for first time unemployment benefits versus the consensus expectations of 375,000. The March pending home sales index jumped +4.1%, significantly topping consensus estimates for a +1% gain. While weekly jobless claims disappointed, they have still showed improvement over the longer-term.
Markets were also busy digesting earnings results. Corporate earnings were mixed throughout the day, but have been largely better-than-forecasts. Consumer stocks rallied on the session. Shares of Skechers USA Inc (SKX +13.67%) and Dunkin Brands (DNKN +2.68%) rose after both companies posted better-than-expected profit tallies. Homebuilders gained after PulteGroup Inc (PHM +10.11%) reported a narrower loss than analyst projections, and Toll Brothers Inc (TOL +3.91%) also traded higher. However, market bellwethers Exxon Mobile Corp (XOM -0.90%) and United Parcel Service Inc (UPS -1.76%) were lower as their quarterly results missed consensus expectations. Telecom stocks were the best performing sector with AT&T Inc (T +2.21%) climbing.
European markets finished higher as earnings by automakers offset a report that showed consumer sentiment in the region fell. The FTSE in London and the DAX in Germany both gained +0.5% on the session. U.S. Treasuries were higher along the curve. The 10-year note was up 11 ticks to yield 1.95% and the 30-year bond was higher by 7/16 of a point to yield 3.12%.
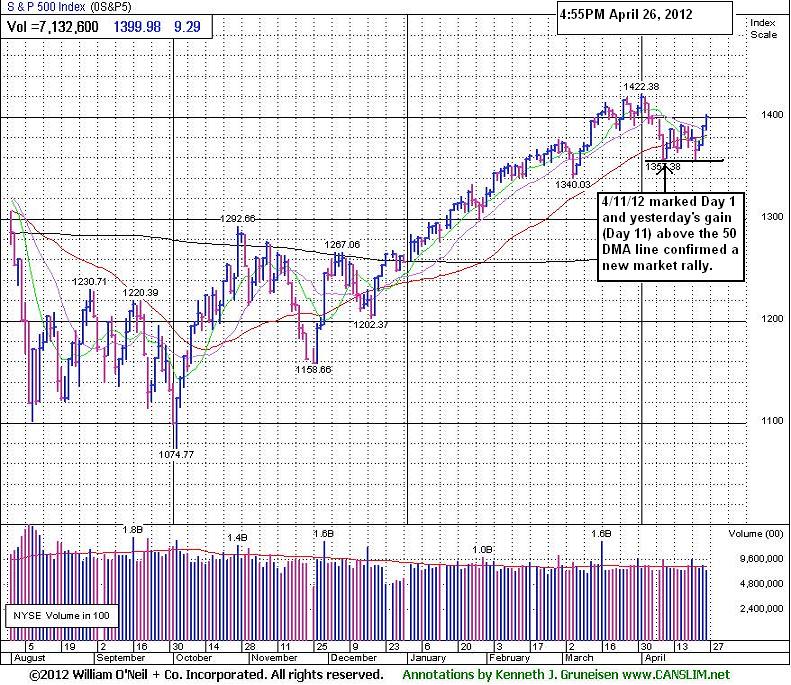
Wednesday's gains helped the major averages' (M criteria) stance improve meaningfully, as this commentary noted their rebound above their respective 50-day moving average (DMA) lines. Analysts at the paper recognized the action as a powerful enough session to be considered a "follow-through-day", thus putting the market back in a "confirmed uptrend" and giving investors the signal to consider new buying efforts as any ideal candidates emerge from sound base patterns. Subsequent deterioration in the major averages' charts below their 50-day moving average lines and latest lows would quickly raise more serious concerns.
Members have asked us on occasion to summarize historical market "corrections" and new rallies confirmed with a "follow-through day". In practice, however, long-time readers have seen numerous examples in recent years where the changes in market direction were not abundantly clear based on the fact that even the guidelines for a proper follow-through day have been somewhat flexible. As a result, we have quickly and explicitly pointed out in this commentary when there may ever have been any brief disconnects between what both have published. Summed up further, assessing the market health is an ongoing endeavor that usually requires more than a one-day slice in time, and it is important to use a broad "weight of the evidence" study to stay adequately in tune with what direction the market averages are headed.
Healthy market leadership (stocks making new 52-week highs) is critical to any market rally, so investors should watch for further expansion in the new highs lists and an increase in the number of stocks reaching the CANSLIM.net BreakOuts Page. As repeatedly noted here, "On a case-by-case basis, eliminating any stocks showing signs of fundamental or technical weakness is precisely how the fact-based system helps investors raise cash and avoid setbacks during any market downturn. "
PICTURED: The benchmark S&P 500 Index posted a 3rd consecutive gain. The prior session marked a "follow-through-day" as the S&P 500 Index posted a +1.36% gain on higher volume than the prior session (Day 11 of its rally attempt) coupled with an expansion in the number of stocks hitting new 52-week highs. The broad-based gains halted a three-week correction, powered by intense buying in a mixture of leading growth stocks and cyclical names.
|
 Kenneth J. Gruneisen started out as a licensed stockbroker in August 1987, a couple of months prior to the historic stock market crash that took the Dow Jones Industrial Average down -22.6% in a single day. He has published daily fact-based fundamental and technical analysis on high-ranked stocks online for two decades. Through FACTBASEDINVESTING.COM, Kenneth provides educational articles, news, market commentary, and other information regarding proven investment systems that work in good times and bad.
Comments contained in the body of this report are technical opinions only and are not necessarily those of Gruneisen Growth Corp. The material herein has been obtained from sources believed to be reliable and accurate, however, its accuracy and completeness cannot be guaranteed. Our firm, employees, and customers may effect transactions, including transactions contrary to any recommendation herein, or have positions in the securities mentioned herein or options with respect thereto. Any recommendation contained in this report may not be suitable for all investors and it is not to be deemed an offer or solicitation on our part with respect to the purchase or sale of any securities. |
|
 |
Defensive Groups Fell; Financial, Retail, and Energy-Related Groups Rose
Kenneth J. Gruneisen - Passed the CAN SLIM® Master's Exam
Defensive groups were laggards as the Healthcare Index ($HMO -1.85%) tumbled and the Gold & Silver Index ($XAU -0.39%) finished with a modest loss. The Networking Index ($NWX -1.40%) lost ground, meanwhile other tech sector indices posted gains including the Semiconductor Index ($SOX +2.17%), Biotechnology Index ($BTK +1.16%), and the Internet Index ($IIX +0.46%). The Retail Index ($RLX +0.90%) was also a positive influence on the major averages along with financial shares as the Bank Index ($BKX +0.79%) and the Broker/Dealer Index ($XBD +1.16%) posted gains. Additionally, energy-related shares had a positive bias as the Integrated Oil Index ($XOI +1.63%) outpaced the Oil Services Index ($OSX +0.37%).
Charts courtesy www.stockcharts.com
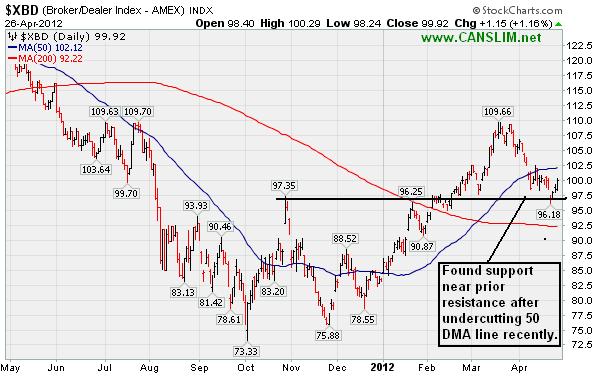
PICTURED: The Broker/Dealer Index ($XBD +1.16%) found support near a prior resistance level after recently undercutting its 50-day moving average (DMA) line.
| Oil Services |
$OSX |
235.84 |
+0.87 |
+0.37% |
+9.04% |
| Healthcare |
$HMO |
2,555.49 |
-48.27 |
-1.85% |
+12.00% |
| Integrated Oil |
$XOI |
1,224.53 |
+19.61 |
+1.63% |
-0.37% |
| Semiconductor |
$SOX |
415.20 |
+8.80 |
+2.17% |
+13.93% |
| Networking |
$NWX |
236.53 |
-3.37 |
-1.40% |
+9.93% |
| Internet |
$IIX |
321.49 |
+1.48 |
+0.46% |
+14.11% |
| Broker/Dealer |
$XBD |
99.92 |
+1.15 |
+1.16% |
+19.99% |
| Retail |
$RLX |
627.86 |
+5.63 |
+0.90% |
+20.00% |
| Gold & Silver |
$XAU |
163.58 |
-0.64 |
-0.39% |
-9.44% |
| Bank |
$BKX |
48.71 |
+0.38 |
+0.79% |
+23.69% |
| Biotech |
$BTK |
1,480.77 |
+16.99 |
+1.16% |
+35.67% |
|
|
|
 |
Gap Up Followed Another Strong Earnings Report
Kenneth J. Gruneisen - Passed the CAN SLIM® Master's Exam
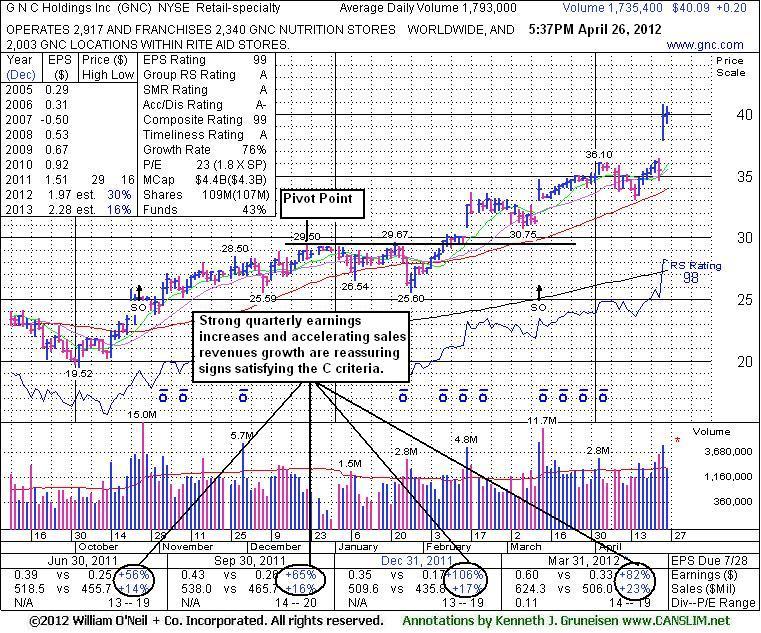
GNC Holdings Inc (GNC +$0.20 or +0.50% to $40.09) held its ground today following a considerable gap up and volume-driven gain for a new all-time high noted on the prior session after reporting earnings +82% on +23% sales revenues for the quarter ended March 31, 2012 versus the year ago period. Volume-driven gains into new high territory, especially gaps up, are recognized as very reassuring signs of institutional accumulation. It has shown bullish action in recent weeks but did not form a sound new base pattern. Prior highs in the $36 area now define chart support to watch on pullbacks. Disciplined investors realize that it is extended more than +5% above its prior highs and not near any sound base, thus not buyable at present under the fact-based system's guidelines.
GNC completed Secondary Offerings on 10/25/11 and 3/13/12 after making steady progress following its 4/01/11 IPO. Its last appearance in this FSU section was on 3/05/12 with an annotated graph under the headline, "Encouraging Action Following Powerful Gap Up". As mentioned in prior analysis, new institutional owners are often attracted when a company has the help of underwriters in placing shares during offerings. The number of top-rated funds owning its shares rose from 148 in June to 291 in Mar '12, a reassuring sign concerning the I criteria. Its strong quarterly earnings increases with accelerating sales growth and a great annual earnings history satisfies the C and A criteria and helped it earn stellar ranks.
|
|
|
Color Codes Explained :
Y - Better candidates highlighted by our
staff of experts.
G - Previously featured
in past reports as yellow but may no longer be buyable under the
guidelines.
***Last / Change / Volume data in this table is the closing quote data***
Symbol/Exchange
Company Name
Industry Group |
PRICE |
CHANGE
(%Change) |
Day High |
Volume
(% DAV)
(% 50 day avg vol) |
52 Wk Hi
% From Hi |
Featured
Date |
Price
Featured |
Pivot Featured |
|
Max Buy |
ACN
-
NYSE
Accenture Plc
DIVERSIFIED SERVICES - Business/Management Services
|
$64.34
|
+0.28
0.44% |
$64.66
|
2,152,086
65.74% of 50 DAV
50 DAV is 3,273,500
|
$65.89
-2.35%
|
3/23/2012
|
$64.13
|
PP = $63.76
|
|
MB = $66.95
|
Most Recent Note - 4/23/2012 11:51:09 AM
Y - Gapped down today amid widespread market weakness. Slumping back below its pivot point near prior highs in the $62-63 area and its 50 DMA line defining important near-term support.
>>> The latest Featured Stock Update with an annotated graph appeared on 3/23/2012. Click here.
View all notes |
Alert me of new notes |
CANSLIM.net Company Profile |
SEC |
Zacks Reports |
StockTalk |
News |
Chart |
Request a new note
C
A N
S L
I M


|
ADS
-
NYSE
Alliance Data Sys Corp
COMPUTER SOFTWARE and SERVICES - Information and Delivery Service
|
$129.81
|
+0.96
0.75% |
$130.34
|
380,780
63.70% of 50 DAV
50 DAV is 597,800
|
$130.31
-0.38%
|
1/17/2012
|
$108.24
|
PP = $107.43
|
|
MB = $112.80
|
Most Recent Note - 4/24/2012 6:58:14 PM
G - Still holding its ground near its all-time high today. Reported earnings +17% on +20% sales revenues for the quarter ended March 31, 2012 versus the year-ago period. Fundamental concerns were raised earlier by earnings reported +9%, well below the +25% minimum guideline, for the latest quarter ended December 31, 2011 versus the year-ago period. See the latest FSU analysis for more details and a new annotated graph.
>>> The latest Featured Stock Update with an annotated graph appeared on 4/24/2012. Click here.
View all notes |
Alert me of new notes |
CANSLIM.net Company Profile |
SEC |
Zacks Reports |
StockTalk |
News |
Chart |
Request a new note
C
A N
S L
I M
|
ALLT
-
NASDAQ
Allot Communications Ltd
COMPUTER SOFTWARE andamp; SERVICES - Technical andamp; System Software
|
$24.66
|
+0.92
3.88% |
$24.90
|
248,149
54.67% of 50 DAV
50 DAV is 453,900
|
$25.36
-2.76%
|
3/13/2012
|
$19.72
|
PP = $18.91
|
|
MB = $19.86
|
 Most Recent Note - 4/26/2012 3:45:01 PM
G - Up today with lighter than average volume, poised for a best-ever close. Volume totals have been cooling while stubbornly holding its ground, a sign that few are exiting. It has not formed a sound new base while staying well above its 50 DMA line and prior highs near $18-19 that define support to watch on pullbacks.
>>> The latest Featured Stock Update with an annotated graph appeared on 3/19/2012. Click here.
View all notes |
Alert me of new notes |
CANSLIM.net Company Profile |
SEC |
Zacks Reports |
StockTalk |
News |
Chart |
Request a new note
C
A N
S L
I M
|
ALXN
-
NASDAQ
Alexion Pharmaceuticals
DRUGS - Drug Manufacturers - Other
|
$89.38
|
-1.08
-1.19% |
$90.74
|
1,218,732
97.58% of 50 DAV
50 DAV is 1,248,900
|
$95.01
-5.93%
|
3/12/2012
|
$87.87
|
PP = $87.73
|
|
MB = $92.12
|
Most Recent Note - 4/24/2012 12:00:40 PM
G - Gapped up today but then reversed into the red. Recently found support at its 50 DMA line, and it is now consolidating above that important short-term average, possibly building a new late-stage base.
>>> The latest Featured Stock Update with an annotated graph appeared on 4/16/2012. Click here.
View all notes |
Alert me of new notes |
CANSLIM.net Company Profile |
SEC |
Zacks Reports |
StockTalk |
News |
Chart |
Request a new note
C
A N
S L
I M
|
BODY
-
NASDAQ
Body Central Corp
RETAIL - Catalog andamp; Mail Order Houses
|
$28.98
|
+0.69
2.44% |
$29.25
|
181,496
91.57% of 50 DAV
50 DAV is 198,200
|
$29.49
-1.73%
|
4/18/2012
|
$27.44
|
PP = $29.59
|
|
MB = $31.07
|
Most Recent Note - 4/25/2012 8:11:58 PM
Y - Rebounded above its 50 DMA line today. Volume-driven gains above the pivot point may trigger a new (or add-on) technical buy signal. Subsequent damaging losses below its recent lows (near $25) would raise more serious concerns and trigger additional sell signals.
>>> The latest Featured Stock Update with an annotated graph appeared on 3/13/2012. Click here.
View all notes |
Alert me of new notes |
CANSLIM.net Company Profile |
SEC |
Zacks Reports |
StockTalk |
News |
Chart |
Request a new note
C
A N
S L
I M
|
Symbol/Exchange
Company Name
Industry Group |
PRICE |
CHANGE
(%Change) |
Day High |
Volume
(% DAV)
(% 50 day avg vol) |
52 Wk Hi
% From Hi |
Featured
Date |
Price
Featured |
Pivot Featured |
|
Max Buy |
CDNS
-
NASDAQ
Cadence Design Systems
COMPUTER SOFTWARE and SERVICES - Technical and System Software
|
$11.88
|
+0.21
1.80% |
$12.16
|
4,341,330
152.41% of 50 DAV
50 DAV is 2,848,500
|
$12.60
-5.71%
|
2/3/2012
|
$11.66
|
PP = $11.15
|
|
MB = $11.71
|
Most Recent Note - 4/25/2012 10:25:25 AM
G - Up today following a streak of 5 consecutive losses and distributional pressure that briefly undercut the prior low ($11.20 on 4/10/12) and raised more serious concerns. Its 50 DMA line acted as resistance since last noted, and a rebound above that important short-term average is needed for its technical stance and outlook to improve.
>>> The latest Featured Stock Update with an annotated graph appeared on 3/28/2012. Click here.
View all notes |
Alert me of new notes |
CANSLIM.net Company Profile |
SEC |
Zacks Reports |
StockTalk |
News |
Chart |
Request a new note
C
A N
S L
I M
|
CELG
-
NASDAQ
Celgene Corp
DRUGS - Drug Manufacturers - Major
|
$72.92
|
-4.99
-6.40% |
$75.98
|
10,514,662
391.11% of 50 DAV
50 DAV is 2,688,400
|
$80.42
-9.33%
|
2/2/2012
|
$74.16
|
PP = $75.21
|
|
MB = $78.97
|
Most Recent Note - 4/26/2012 12:09:02 PM
G - Reported earnings +30% on +13% sales revenues for the quarter ended March 31, 2012 versus the year ago period. Volume and volatility often increase near earnings news. It gapped down today, violating its 50 DMA line and triggering a technical sell signal. Only a prompt rebound above its 50 DMA line would help its outlook improve.
>>> The latest Featured Stock Update with an annotated graph appeared on 3/26/2012. Click here.
View all notes |
Alert me of new notes |
CANSLIM.net Company Profile |
SEC |
Zacks Reports |
StockTalk |
News |
Chart |
Request a new note
C
A N
S L
I M
|
COO
-
NYSE
Cooper Companies Inc
HEALTH SERVICES - Medical Instruments and Supplies
|
$86.47
|
-0.22
-0.25% |
$87.07
|
394,260
90.47% of 50 DAV
50 DAV is 435,800
|
$87.54
-1.22%
|
3/9/2012
|
$83.05
|
PP = $81.02
|
|
MB = $85.07
|
Most Recent Note - 4/25/2012 10:32:17 AM
G - Up today without great volume conviction while trading to new 52-week and all-time highs above its "max buy" level. Color code is changed to green after getting extended from its prior base.
>>> The latest Featured Stock Update with an annotated graph appeared on 3/9/2012. Click here.
View all notes |
Alert me of new notes |
CANSLIM.net Company Profile |
SEC |
Zacks Reports |
StockTalk |
News |
Chart |
Request a new note
C
A N
S L
I M
|
DISH
-
NASDAQ
Dish Network Corp Cl A
CONSUMER DURABLES - Electronic Equipment
|
$31.81
|
+0.17
0.54% |
$32.00
|
1,124,425
43.97% of 50 DAV
50 DAV is 2,557,100
|
$35.64
-10.75%
|
3/7/2012
|
$30.83
|
PP = $30.10
|
|
MB = $31.61
|
Most Recent Note - 4/25/2012 8:13:52 PM
G - Today's gain on light volume helped it bounce from important support at its 50 DMA line. Continued support near that important short-term average would help its outlook, but further deterioration would raise more serious concerns.
>>> The latest Featured Stock Update with an annotated graph appeared on 3/14/2012. Click here.
View all notes |
Alert me of new notes |
CANSLIM.net Company Profile |
SEC |
Zacks Reports |
StockTalk |
News |
Chart |
Request a new note
C
A N
S L
I M
|
FEIC
-
NASDAQ
F E I Co
ELECTRONICS - Diversified Electronics
|
$49.56
|
+1.00
2.06% |
$49.86
|
318,348
104.72% of 50 DAV
50 DAV is 304,000
|
$49.92
-0.72%
|
12/7/2011
|
$41.41
|
PP = $42.35
|
|
MB = $44.47
|
Most Recent Note - 4/25/2012 10:19:54 AM
G - Consolidating above its 50 DMA line, building a new base. The latest quarterly report showed +21% earnings for the Dec '11 quarter, below the +25% minimum guideline for earnings growth.
>>> The latest Featured Stock Update with an annotated graph appeared on 3/12/2012. Click here.
View all notes |
Alert me of new notes |
CANSLIM.net Company Profile |
SEC |
Zacks Reports |
StockTalk |
News |
Chart |
Request a new note
C
A N
S L
I M
|
Symbol/Exchange
Company Name
Industry Group |
PRICE |
CHANGE
(%Change) |
Day High |
Volume
(% DAV)
(% 50 day avg vol) |
52 Wk Hi
% From Hi |
Featured
Date |
Price
Featured |
Pivot Featured |
|
Max Buy |
GNC
-
NYSE
G N C Holdings Inc
RETAIL - Drug Stores
|
$40.09
|
+0.20
0.50% |
$40.70
|
1,740,307
97.06% of 50 DAV
50 DAV is 1,793,000
|
$40.82
-1.79%
|
1/19/2012
|
$28.99
|
PP = $29.60
|
|
MB = $31.08
|
Most Recent Note - 4/26/2012 5:48:02 PM
G - Held its ground today following a considerable gap up gain with heavy volume for a new all-time high on the prior session after reporting earnings +82% on +23% sales revenues for the quarter ended March 31, 2012 versus the year ago period. See the latest FSU analysis for more details and a new annotated graph.
>>> The latest Featured Stock Update with an annotated graph appeared on 4/26/2012. Click here.
View all notes |
Alert me of new notes |
CANSLIM.net Company Profile |
SEC |
Zacks Reports |
StockTalk |
News |
Chart |
Request a new note
C
A N
S L
I M
|
HLF
-
NYSE
Herbalife Ltd
DRUGS - Nutrition and Weight Management
|
$72.23
|
+2.08
2.97% |
$72.37
|
1,361,936
94.53% of 50 DAV
50 DAV is 1,440,700
|
$73.00
-1.05%
|
4/18/2012
|
$71.19
|
PP = $72.21
|
|
MB = $75.82
|
Most Recent Note - 4/26/2012 3:47:30 PM
Y - Up today without great volume conviction while rising above its pivot point near its 52-week high. Found support at its 50 DMA line after a damaging 4/24/12 loss. Previously noted - "Churning above average volume this week without making meaningful price progress above prior highs. Volume-driven gains for new highs did not trigger a proper new (or add-on) technical buy signal."
>>> The latest Featured Stock Update with an annotated graph appeared on 4/13/2012. Click here.
View all notes |
Alert me of new notes |
CANSLIM.net Company Profile |
SEC |
Zacks Reports |
StockTalk |
News |
Chart |
Request a new note
C
A N
S L
I M
|
ISRG
-
NASDAQ
Intuitive Surgical Inc
HEALTH SERVICES - Medical Appliances and Equipment
|
$576.64
|
+1.14
0.20% |
$578.75
|
178,927
61.28% of 50 DAV
50 DAV is 292,000
|
$594.89
-3.07%
|
12/20/2011
|
$442.43
|
PP = $449.16
|
|
MB = $471.62
|
Most Recent Note - 4/26/2012 4:05:31 PM
G - Hovering near its all-time high with volume totals cooling since a considerable gap up gain on 4/18/12. It may produce more climactic gains, however it has not spent much time basing since its last "Featured Date" when highlighted in yellow on 12/23/11. Disciplined investors always limit losses if any stock falls -7% from their purchase price. It is on track for an 11th consecutive weekly gain.
>>> The latest Featured Stock Update with an annotated graph appeared on 3/1/2012. Click here.
View all notes |
Alert me of new notes |
CANSLIM.net Company Profile |
SEC |
Zacks Reports |
StockTalk |
News |
Chart |
Request a new note
C
A N
S L
I M
|
LULU
-
NASDAQ
Lululemon Athletica
MANUFACTURING - Textile Manufacturing
|
$73.42
|
+1.49
2.07% |
$73.68
|
1,492,934
74.00% of 50 DAV
50 DAV is 2,017,500
|
$77.13
-4.81%
|
1/10/2012
|
$60.97
|
PP = $59.46
|
|
MB = $62.43
|
Most Recent Note - 4/24/2012 2:06:21 PM
G - Raising concerns with yet another distribution day, it violated its 50 DMA line with today's loss on higher volume. Only a prompt rebound above its short-term average would help its outlook.
>>> The latest Featured Stock Update with an annotated graph appeared on 4/12/2012. Click here.
View all notes |
Alert me of new notes |
CANSLIM.net Company Profile |
SEC |
Zacks Reports |
StockTalk |
News |
Chart |
Request a new note
C
A N
S L
I M
|
MA
-
NYSE
Mastercard Inc Cl A
DIVERSIFIED SERVICES - Business/Management Services
|
$453.98
|
+8.92
2.00% |
$456.49
|
1,040,503
126.34% of 50 DAV
50 DAV is 823,600
|
$445.06
2.00%
|
3/12/2012
|
$419.86
|
PP = $428.67
|
|
MB = $450.10
|
Most Recent Note - 4/25/2012 8:08:54 PM
Y - Considerable gain today with slightly above average volume for new 52-week and all-time highs. This week it tested its 50 DMA line and found support.
>>> The latest Featured Stock Update with an annotated graph appeared on 4/11/2012. Click here.
View all notes |
Alert me of new notes |
CANSLIM.net Company Profile |
SEC |
Zacks Reports |
StockTalk |
News |
Chart |
Request a new note
C
A N
S L
I M
|
Symbol/Exchange
Company Name
Industry Group |
PRICE |
CHANGE
(%Change) |
Day High |
Volume
(% DAV)
(% 50 day avg vol) |
52 Wk Hi
% From Hi |
Featured
Date |
Price
Featured |
Pivot Featured |
|
Max Buy |
MELI
-
NASDAQ
Mercadolibre Inc
INTERNET - Internet Software and; Services
|
$92.47
|
+0.90
0.98% |
$92.89
|
268,396
54.72% of 50 DAV
50 DAV is 490,500
|
$104.50
-11.51%
|
2/6/2012
|
$97.09
|
PP = $95.58
|
|
MB = $100.36
|
Most Recent Note - 4/25/2012 8:10:03 PM
G - It remains well below its 50 DMA line while today's gain on light volume broke a streak of 3 consecutive losses. It now faces resistance due to overhead supply up through the $104 level that will hinder its progress.
>>> The latest Featured Stock Update with an annotated graph appeared on 3/29/2012. Click here.
View all notes |
Alert me of new notes |
CANSLIM.net Company Profile |
SEC |
Zacks Reports |
StockTalk |
News |
Chart |
Request a new note
C
A N
S L
I M
|
MG
-
NYSE
Mistras Group Inc
DIVERSIFIED SERVICES - Bulding and Faci;ity Management Services
|
$23.46
|
-0.27
-1.14% |
$23.83
|
36,104
36.36% of 50 DAV
50 DAV is 99,300
|
$26.24
-10.59%
|
3/22/2012
|
$24.96
|
PP = $26.34
|
|
MB = $27.66
|
Most Recent Note - 4/26/2012 3:51:34 PM
G - Still consolidating near its 50 DMA line. The recent low ($22.60 on 4/19/12) defines the next near-term support above its 200 DMA line. Previously noted - "A volume-driven gain above its recent chart high ($25.49 on 3/21/12) may help trigger a proper technical buy signal after a new base formation, however no new (lower) pivot point is currently being cited, and it may continue encountering stubborn resistance."
>>> The latest Featured Stock Update with an annotated graph appeared on 4/2/2012. Click here.
View all notes |
Alert me of new notes |
CANSLIM.net Company Profile |
SEC |
Zacks Reports |
StockTalk |
News |
Chart |
Request a new note
C
A N
S L
I M
|
MKTX
-
NASDAQ
Marketaxess Holdings Inc
FINANCIAL SERVICES - Investment Brokerage - Nationa
|
$35.02
|
-0.37
-1.05% |
$35.31
|
263,496
84.24% of 50 DAV
50 DAV is 312,800
|
$37.95
-7.72%
|
3/8/2012
|
$35.80
|
PP = $35.52
|
|
MB = $37.30
|
Most Recent Note - 4/26/2012 3:56:19 PM
Y - Volume driven-gains would be a welcome sign after recent distributional action. Trading near its session high after dipping below its 50 DMA line today. Gains lacked volume conviction after its intra-day violation of the 50 DMA line on 4/12/12
>>> The latest Featured Stock Update with an annotated graph appeared on 3/8/2012. Click here.
View all notes |
Alert me of new notes |
CANSLIM.net Company Profile |
SEC |
Zacks Reports |
StockTalk |
News |
Chart |
Request a new note
C
A N
S L
I M
|
NTES
-
NASDAQ
Netease Inc Adr
INTERNET - Internet Information Providers
|
$60.42
|
+0.79
1.32% |
$61.45
|
641,485
93.02% of 50 DAV
50 DAV is 689,600
|
$60.50
-0.13%
|
3/19/2012
|
$56.18
|
PP = $55.10
|
|
MB = $57.86
|
Most Recent Note - 4/23/2012 2:53:14 PM
G - Consolidating just above its "max buy" level and its color code is changed to green. Recent lows and prior highs in the $55 area define important near-term chart support to watch above its 50 DMA line.
>>> The latest Featured Stock Update with an annotated graph appeared on 3/27/2012. Click here.
View all notes |
Alert me of new notes |
CANSLIM.net Company Profile |
SEC |
Zacks Reports |
StockTalk |
News |
Chart |
Request a new note
C
A N
S L
I M
|
RAX
-
NYSE
Rackspace Hosting Inc
INTERNET - Internet Software and; Services
|
$58.44
|
+3.15
5.70% |
$58.74
|
2,268,091
116.55% of 50 DAV
50 DAV is 1,946,000
|
$60.00
-2.60%
|
4/26/2012
|
$58.39
|
PP = $59.53
|
|
MB = $62.51
|
Most Recent Note - 4/26/2012 3:35:07 PM
Y - Considerable gain today after promptly rebounding to and above its 50 DMA line helping its technical stance. Color code is changed to yellow with new pivot point cited based on its 3/27/12 high plus 10 cents following a 5-week consolidation. Volume-driven gains for new highs may trigger a new (or add-on) technical buy signal.
>>> The latest Featured Stock Update with an annotated graph appeared on 4/10/2012. Click here.
View all notes |
Alert me of new notes |
CANSLIM.net Company Profile |
SEC |
Zacks Reports |
StockTalk |
News |
Chart |
Request a new note
C
A N
S L
I M
|
Symbol/Exchange
Company Name
Industry Group |
PRICE |
CHANGE
(%Change) |
Day High |
Volume
(% DAV)
(% 50 day avg vol) |
52 Wk Hi
% From Hi |
Featured
Date |
Price
Featured |
Pivot Featured |
|
Max Buy |
RGR
-
NYSE
Sturm Ruger & Co Inc
CONSUMER DURABLES - Sporting Goods
|
$54.63
|
+0.03
0.05% |
$56.28
|
741,555
182.25% of 50 DAV
50 DAV is 406,900
|
$54.77
-0.25%
|
3/22/2012
|
$46.49
|
PP = $46.78
|
|
MB = $49.12
|
Most Recent Note - 4/26/2012 3:37:10 PM
G - Hitting a new 52-week high today with above average volume behind its gain, getting more extended from any sound base. Found prompt support after a pullback near its prior high in the $46 area previously noted as support to watch above its 50 DMA line.
>>> The latest Featured Stock Update with an annotated graph appeared on 3/22/2012. Click here.
View all notes |
Alert me of new notes |
CANSLIM.net Company Profile |
SEC |
Zacks Reports |
StockTalk |
News |
Chart |
Request a new note
C
A N
S L
I M
|
RRTS
-
NYSE
Roadrunner Trans Systems
TRANSPORTATION - Air Delivery and Freight Service
|
$16.73
|
-0.24
-1.41% |
$16.94
|
56,722
56.16% of 50 DAV
50 DAV is 101,000
|
$18.59
-10.01%
|
2/10/2012
|
$17.40
|
PP = $17.50
|
|
MB = $18.38
|
Most Recent Note - 4/24/2012 4:47:46 PM
G - Down today with higher (near average) volume. Its 50 DMA line acted as resistance when it rebounded from its latest lows. After finding recent support, any subsequent deterioration below the prior low ($16.65 on 4/10/12) would raise more serious concerns and trigger more worrisome sell signals.
>>> The latest Featured Stock Update with an annotated graph appeared on 4/9/2012. Click here.
View all notes |
Alert me of new notes |
CANSLIM.net Company Profile |
SEC |
Zacks Reports |
StockTalk |
News |
Chart |
Request a new note
C
A N
S L
I M
|
SHFL
-
NASDAQ
Shuffle Master Inc
MANUFACTURING - Diversified Machinery
|
$17.13
|
+0.22
1.30% |
$17.32
|
366,717
55.09% of 50 DAV
50 DAV is 665,700
|
$18.77
-8.74%
|
3/6/2012
|
$17.07
|
PP = $15.25
|
|
MB = $16.01
|
Most Recent Note - 4/24/2012 4:44:45 PM
G - Consolidating just above its 50 DMA line. Its prior low ($16.14 on 4/10/12) and its short-term average define important near-term chart support to watch. It is -11.7% off its 52-week high today, extended from any sound base pattern.
>>> The latest Featured Stock Update with an annotated graph appeared on 3/15/2012. Click here.
View all notes |
Alert me of new notes |
CANSLIM.net Company Profile |
SEC |
Zacks Reports |
StockTalk |
News |
Chart |
Request a new note
C
A N
S L
I M
|
SWI
-
NYSE
Solarwinds Inc
COMPUTER SOFTWARE and SERVICES - Application Software
|
$45.38
|
+7.56
19.99% |
$46.38
|
4,194,298
410.76% of 50 DAV
50 DAV is 1,021,100
|
$42.22
7.48%
|
4/26/2012
|
$45.15
|
PP = $42.32
|
|
MB = $44.44
|
Most Recent Note - 4/26/2012 1:19:45 PM
Y - Reported earnings +43% on +39% sales revenues for the quarter ended March 31, 2012 versus the year ago period. It held its ground stubbornly after violating its 50 DMA line when a damaging loss with above average volume triggered technical sell signals on 4/10/12 and it was dropped from the Featured Stocks list. Earnings below the +25% guideline for the Dec '11 quarter (+21%) had also raised fundamental concerns at that time, however the stock's resilience and impressive acceleration means that 3 of the past 4 quarterly comparisons are now above the minimum guideline concerning the C criteria. Its annual earnings (A criteria) history has been strong. Color code is changed to yellow with pivot point based on its 3/26/12 high plus 10 cents after a short flat base or "square box" base pattern. The volume-driven gain to new highs triggered a new buy signal.
>>> The latest Featured Stock Update with an annotated graph appeared on 3/16/2012. Click here.
View all notes |
Alert me of new notes |
CANSLIM.net Company Profile |
SEC |
Zacks Reports |
StockTalk |
News |
Chart |
Request a new note
C
A N
S L
I M
|
SXCI
-
NASDAQ
S X C Health Solutions
COMPUTER SOFTWARE and SERVICES - Healthcare Information Service
|
$91.67
|
-1.14
-1.23% |
$93.18
|
1,295,483
147.73% of 50 DAV
50 DAV is 876,900
|
$100.50
-8.79%
|
2/23/2012
|
$68.24
|
PP = $66.05
|
|
MB = $69.35
|
Most Recent Note - 4/23/2012 2:44:55 PM
G - Perched near its all-time high today, very extended from its prior base. The market cheered the 4/18/12 news it will acquire and merge with Catalyst Health Solutions Inc (CHSI), rallying with volume-driven gains.
>>> The latest Featured Stock Update with an annotated graph appeared on 3/6/2012. Click here.
View all notes |
Alert me of new notes |
CANSLIM.net Company Profile |
SEC |
Zacks Reports |
StockTalk |
News |
Chart |
Request a new note
C
A N
S L
I M
|
Symbol/Exchange
Company Name
Industry Group |
PRICE |
CHANGE
(%Change) |
Day High |
Volume
(% DAV)
(% 50 day avg vol) |
52 Wk Hi
% From Hi |
Featured
Date |
Price
Featured |
Pivot Featured |
|
Max Buy |
TDG
-
NYSE
Transdigm Group Inc
AEROSPACE/DEFENSE - Aerospace/Defense Products and; Services
|
$125.41
|
+0.71
0.57% |
$126.40
|
468,586
114.01% of 50 DAV
50 DAV is 411,000
|
$125.00
0.33%
|
2/29/2012
|
$120.10
|
PP = $118.93
|
|
MB = $124.88
|
Most Recent Note - 4/25/2012 1:29:42 PM
Y - Small gap up today, hitting new 52-week and all-time highs and approaching the previously cited "max buy" level. Solid gain on 4/20/12 with +75% above average volume met the guideline for a proper technical buy signal. The encouraging sign of fresh institutional buying demand may signal the beginning of a meaningful leg up, but keep in mind 3 out of 4 stocks follow the direction of the major averages (M criteria) and the market has recently been pulling back under distributional pressure. Prior highs in the $118-121 area define initial chart support to watch on pullbacks.
>>> The latest Featured Stock Update with an annotated graph appeared on 3/30/2012. Click here.
View all notes |
Alert me of new notes |
CANSLIM.net Company Profile |
SEC |
Zacks Reports |
StockTalk |
News |
Chart |
Request a new note
C
A N
S L
I M
|
TIBX
-
NASDAQ
Tibco Software Inc
COMPUTER SOFTWARE and SERVICES - Business Software and Services
|
$33.26
|
+0.69
2.12% |
$33.52
|
2,358,540
81.65% of 50 DAV
50 DAV is 2,888,600
|
$34.67
-4.06%
|
3/30/2012
|
$31.01
|
PP = $31.25
|
|
MB = $32.81
|
Most Recent Note - 4/26/2012 4:01:26 PM
G - Up today for a 2nd consecutive gain on lighter volume. Traded under its "max buy" level this week yet found support above prior highs in the $31 area and its 50 DMA line. More damaging losses would raise serious concerns.
>>> The latest Featured Stock Update with an annotated graph appeared on 4/5/2012. Click here.
View all notes |
Alert me of new notes |
CANSLIM.net Company Profile |
SEC |
Zacks Reports |
StockTalk |
News |
Chart |
Request a new note
C
A N
S L
I M
|
TNGO
-
NASDAQ
Tangoe Inc
COMPUTER SOFTWARE and SERVICES - Technical and System Software
|
$20.58
|
+0.23
1.13% |
$20.94
|
240,354
35.71% of 50 DAV
50 DAV is 673,100
|
$21.74
-5.34%
|
3/27/2012
|
$19.35
|
PP = $20.00
|
|
MB = $21.00
|
Most Recent Note - 4/25/2012 8:06:31 PM
Y - Today's gain came on lighter volume following 3 consecutive losses, yet it rebounded above prior highs in the $20 area previously noted as initial support to watch on pullbacks. The 50 DMA line ($18.66) is the next important support level to watch.
>>> The latest Featured Stock Update with an annotated graph appeared on 4/3/2012. Click here.
View all notes |
Alert me of new notes |
CANSLIM.net Company Profile |
SEC |
Zacks Reports |
StockTalk |
News |
Chart |
Request a new note
C
A N
S L
I M
|
TSCO
-
NASDAQ
Tractor Supply Co
SPECIALTY RETAIL - Specialty Retail, Other
|
$97.52
|
+0.03
0.03% |
$99.46
|
856,805
113.94% of 50 DAV
50 DAV is 752,000
|
$101.20
-3.64%
|
1/12/2012
|
$79.12
|
PP = $75.58
|
|
MB = $79.36
|
Most Recent Note - 4/24/2012 4:08:07 PM
G - Loss today with higher volume indicated another day of distributional pressure. Still holding its ground near its all-time high, very extended from its prior base. Its 50 DMA line defines support to watch on pullbacks.
>>> The latest Featured Stock Update with an annotated graph appeared on 4/17/2012. Click here.
View all notes |
Alert me of new notes |
CANSLIM.net Company Profile |
SEC |
Zacks Reports |
StockTalk |
News |
Chart |
Request a new note
C
A N
S L
I M
|
UA
-
NYSE
Under Armour Inc Cl A
CONSUMER NON-DURABLES - Textile - Apparel Clothing
|
$97.59
|
+0.93
0.96% |
$97.90
|
834,225
83.53% of 50 DAV
50 DAV is 998,700
|
$102.86
-5.12%
|
2/15/2012
|
$85.77
|
PP = $84.86
|
|
MB = $89.10
|
Most Recent Note - 4/24/2012 12:36:11 PM
G - Slumping under prior highs with a loss today. No overhead supply remains to act as resistance, however no new pivot point was cited following its latest base. Concerns were raised by weaker fundamentals. Reported earnings +22% on +23% sales revenues for the quarter ended March 31, 2012 versus the year ago period, its first quarterly earnings increase below the +25% minimum guideline in more than 2 years.
>>> The latest Featured Stock Update with an annotated graph appeared on 4/4/2012. Click here.
View all notes |
Alert me of new notes |
CANSLIM.net Company Profile |
SEC |
Zacks Reports |
StockTalk |
News |
Chart |
Request a new note
C
A N
S L
I M
|
Symbol/Exchange
Company Name
Industry Group |
PRICE |
CHANGE
(%Change) |
Day High |
Volume
(% DAV)
(% 50 day avg vol) |
52 Wk Hi
% From Hi |
Featured
Date |
Price
Featured |
Pivot Featured |
|
Max Buy |
UBNT
-
NASDAQ
Ubiquiti Networks Inc
TELECOMMUNICATIONS - Diversified Communication Serv
|
$32.74
|
+0.81
2.54% |
$32.83
|
412,477
117.45% of 50 DAV
50 DAV is 351,200
|
$35.32
-7.30%
|
4/12/2012
|
$33.89
|
PP = $34.07
|
|
MB = $35.77
|
Most Recent Note - 4/26/2012 4:03:34 PM
Y - Up today with higher (near average) volume, finishing the session -8.3% off its all-time high. Formed an advanced "ascending base" pattern marked by 3 pullbacks of 10-20% following its previous breakout. Prior low ($30.25 on 4/09/12) defines initial support above its 50 DMA line.
>>> The latest Featured Stock Update with an annotated graph appeared on 4/20/2012. Click here.
View all notes |
Alert me of new notes |
CANSLIM.net Company Profile |
SEC |
Zacks Reports |
StockTalk |
News |
Chart |
Request a new note
C
A N
S L
I M
|
ULTA
-
NASDAQ
Ulta Salon Cosm & Frag
SPECIALTY RETAIL - Specialty Retail, Other
|
$89.53
|
+0.40
0.45% |
$90.53
|
591,229
85.57% of 50 DAV
50 DAV is 690,900
|
$96.65
-7.37%
|
1/11/2012
|
$71.97
|
PP = $75.80
|
|
MB = $79.59
|
Most Recent Note - 4/24/2012 1:59:49 PM
G - Violated its 50 DMA line with heavy volume behind a damaging loss today raising concerns. Prior highs in the $75 area are the next important support level to watch. See the latest FSU analysis for more details and a new annotated graph.
>>> The latest Featured Stock Update with an annotated graph appeared on 4/23/2012. Click here.
View all notes |
Alert me of new notes |
CANSLIM.net Company Profile |
SEC |
Zacks Reports |
StockTalk |
News |
Chart |
Request a new note
C
A N
S L
I M
|
V
-
NYSE
Visa Inc Cl A
DIVERSIFIED SERVICES - Business/Management Services
|
$123.19
|
+1.40
1.15% |
$123.50
|
2,776,977
87.71% of 50 DAV
50 DAV is 3,166,200
|
$123.68
-0.40%
|
3/12/2012
|
$116.53
|
PP = $119.46
|
|
MB = $125.43
|
Most Recent Note - 4/26/2012 4:07:37 PM
Y - Gain today on light volume helped it finish a penny below its best-ever close. Found support near its 50 DMA line this week. Sputtering since its 4/13/12 gain backed by +49% above average volume technically confirmed a buy signal. Its 50 DMA line defines support to watch well above prior highs in the $103-104 area.
>>> The latest Featured Stock Update with an annotated graph appeared on 3/7/2012. Click here.
View all notes |
Alert me of new notes |
CANSLIM.net Company Profile |
SEC |
Zacks Reports |
StockTalk |
News |
Chart |
Request a new note
C
A N
S L
I M
|
VMW
-
NYSE
Vmware Inc Cl A
COMPUTER SOFTWARE andamp; SERVICES - Technical andamp; System Software
|
$110.92
|
+4.23
3.96% |
$111.40
|
2,251,410
142.74% of 50 DAV
50 DAV is 1,577,300
|
$118.79
-6.63%
|
4/18/2012
|
$110.04
|
PP = $115.29
|
|
MB = $121.05
|
Most Recent Note - 4/26/2012 3:40:08 PM
Y - Color code is changed to yellow after promptly repairing a brief 50 DMA line breach, technically showing signs it attracted institutional support near that important short-term average. Reported +38% earnings on +25% sales revenues for the quarter ended March 31, 2012 versus the year ago period.
>>> The latest Featured Stock Update with an annotated graph appeared on 4/18/2012. Click here.
View all notes |
Alert me of new notes |
CANSLIM.net Company Profile |
SEC |
Zacks Reports |
StockTalk |
News |
Chart |
Request a new note
C
A N
S L
I M
|
VSI
-
NYSE
Vitamin Shoppe Inc
SPECIALTY RETAIL - Specialty Retail, Other
|
$48.16
|
+0.72
1.52% |
$48.39
|
238,527
73.39% of 50 DAV
50 DAV is 325,000
|
$48.36
-0.41%
|
4/25/2012
|
$47.77
|
PP = $48.46
|
|
MB = $50.88
|
Most Recent Note - 4/26/2012 3:42:03 PM
Y - Up today without great volume conviction, rising within pennies of its 52-week high and pivot point. Color code was changed to yellow with pivot point based on its 7/05/11 high after a near 10-month cup shaped base. See the latest FSU analysis for more details and an annotated graph.
>>> The latest Featured Stock Update with an annotated graph appeared on 4/25/2012. Click here.
View all notes |
Alert me of new notes |
CANSLIM.net Company Profile |
SEC |
Zacks Reports |
StockTalk |
News |
Chart |
Request a new note
C
A N
S L
I M
|
Symbol/Exchange
Company Name
Industry Group |
PRICE |
CHANGE
(%Change) |
Day High |
Volume
(% DAV)
(% 50 day avg vol) |
52 Wk Hi
% From Hi |
Featured
Date |
Price
Featured |
Pivot Featured |
|
Max Buy |
|
 |
| Subscriber Question: |
April 9, 2012 |
Dear Ken,
WHY IN THE WORLD is AAPL not on your Featured Stocks List?
Thanks for your response. Don |
| Ken's Response: |
April 26, 2012 |
Dear Don:
Thanks for writing in. I appreciate that you have been a loyal long-time member and I sincerely apologize for the unusual delay in responding to your question asked 4/09/12, "WHY IN THE WORLD is AAPL not on your Featured Stocks List?" As you know, it subsequently reversed from an all-time high of $644 on 4/10/12 for a streak of 10 losses marked by above average volume over the span of the 11 prior sessions. It sank below its 50-day moving average (DMA) line and as much as -13.4% from its high, then gapped up above the 50 DMA line with a considerable gain on strong earnings news yesterday which we commented on yet again in the mid-day and after-market reports.
I wanted to take the time to thoroughly review our extensive prior coverage on it and do my best to summarize and explain matters for you and everyone else who might ask, especially since Apple Inc is such a popular and truly exceptional company. Please forgive the length of the message, however there is very much history and past work that has gone into covering it which members might easily overlook.
CANSLIM.net services are designed to help investors discover ideal CANSLIM-based buy candidates before they are familiar names which are widely owned by the institutional crowd. The fact-based investment system our service supports is focused on action-worthy small and mid-sized companies which are demonstrating superior earnings and sales revenues growth rates. Historic studies have shown that the stock market's biggest winners rarely included large cap stocks. While AAPL has run up and become the largest of all large caps, we have noted in the more recent past that its Goliath size makes it not a good match with the winning models from the book - "How to Make Money In Stocks". I will go into some specific instances in a moment.
First, however, we can acknowledge that AAPL has run up a lot, especially in recent months. During that time numerous other stocks have also run up, including many companies lacking the stellar earnings growth that disciplined investors require in all buy candidates. Many stocks advanced despite having flaws with respect to the fact-based system, however a consequence of a strong bullish market (M criteria) environment is that MOST stocks go up! During bullish market periods, we still firmly believe that investors have the best odds of getting "above average" returns by concentrating their buying efforts exclusively on companies within the system's guidelines and matching all of the fundamental and technical investment criteria.
It is virtually impossible for a high-ranked leader to run up and up, yet not show up in CANSLIM.net reports with notes and analysis by our experts. AAPL has not gone unmentioned by us! In fact, to date AAPL was noted 25 times in the mid-day report during 2012 - upgraded members can review via the "view all notes" tab and details included on the Company Profile page. It was also mentioned 13 times in 2012 in the market commentary portion of the CANSLIM.net After Market Update. Additionally, it was noted and mentioned more than 100 times in mid-day reports and market commentaries in 2011. http://premium.canslim.net/Archives/2011/default.asp
In the commentary we occasionally repeated the concerns at the time, such as:
2/28/12 market commentary - "Tech stocks led sector gainers with shares of Apple Inc (AAPL +1.84%) rallying on expectations the tech giant would unveil the iPad 3 in March. On the earnings front, Priceline.com Inc (PCLN +6.97%) gapped up after the company's fourth-quarter profit and sales topped projections. Shares of AutoZone Inc (AZO +2.82%) gained following the company's better-than-expected second-quarter results. While the above mentioned companies made the daily headlines, closely following the high-ranked companies included on the Featured Stocks Page and reading the daily mid-day and after-market reports allows upgraded members to discover many action-worthy candidates based on the fact-based investment system before they become familiar household names which are heavily owned by the institutional crowd."
2/14/12 market commentary - "Among the standout decliners was miner Freeport-McMoRan Copper & Gold (FCX -3.81%). On the plus side, Boeing Co (BA +0.95%) rose after it signed a $22.4 billion aircraft order. Apple Inc (AAPL +1.5%) also extended its recent winning streak. In contrast with the three companies mentioned above, there were one-day gains of greater than +12% posted by 2 of the companies currently included on the Featured Stocks page. Arguably, their big gains helps to demonstrate the superior profit potential typically found in smaller companies - high ranked leaders which are not well known by the institutional crowd, yet under accumulation by top-rated funds due to strong underlying earnings growth!"
The past included a time when AAPL was noted in the mid-day report in yellow and added to the Featured Stocks page as follows:
9/16/2011 12:12:38 PM - Y - Approaching its 52-week high with today's 5th consecutive gain after finding support near its 50 DMA line and prior chart highs during its 8-week consolidation. Color code is changed to yellow with pivot point based on its 52-week high plus 10 cents. Volume-driven gains above its pivot point may trigger a technical buy signal, but disciplined investors will watch for fresh proof of heavy buying demand before taking action. Recently rallied after reporting very strong earnings +122% on +82% sales revenues for the quarter ended June 30, 2011 versus the year ago period. Stellar earnings track record that solidly satisfies the C and A criteria. However, it is already heavily owned by the institutional crowd, and ownership by top-rated funds fell from 4,365 in Mar '11 to 4,347 in Jun '11.
It was not added to the Featured Stocks page again but noted as follows:
1/25/2012 11:55:21 AM - Considerable breakaway gap today following an advanced "3-weeks tight" base pattern, hitting new all-time highs and rallying near the upper limit of a trading channel defined by connecting its Feb, Jul, Sep, Oct '11 highs. Reported earnings +116% on +73% sales revenues for the quarter ended December 31, 2011 versus the year ago period. Found support at its 200 DMA line and rebounded to new highs since dropped from the Featured Stocks list on 11/18/11.
Hindsight being 20/20 we might have looked better in everyone's eyes to have added AAPL to the Featured Stocks list again when noted on 1/25/12. Based on its size and heavy institutional interest extant, it was only hesitatingly featured back on 9/16/11. The choppy action in the months that followed made the price/volume chart not a good basic base pattern, but a trickier advanced base and then a "breakaway gap". CANSLIM.net's regular readers know that breakaway gaps have been noted by us in the past as the one exception which allows for buying efforts more than +5% above a prior high.
For the reasons specified above, AAPL truly has been an exceptional stock. Staying true to the fact-based investment system via CANSLIM.net reports with detailed analysis and annotated graphs will surely help members like you find many exceptional stocks to invest in during bullish markets. The reports also help members avoid painful setbacks during market downdrafts.
Rest assured we aim to help you and all of our members find action-worthy candidates that become big winners, and we will do this by staying keenly focused on the best buy candidates under the system's guidelines. Not to be facetious, but hopefully you might appreciate the usefulness of contrary indicators. Please do not be upset when I tell you that whenever members are writing in or calling in and asking us why a well-known stock which has already run up tremendously and is very extended from any sound base pattern IS NOT on the Featured Stocks list, the call-ins and write-ins are contrary indicators that all-too-often spell danger ahead.
We appreciate any suggestions you may have on how we can improve our services. Please use the inquiry form if you have any other questions about the upgraded services we provide. We always say around here that if one person asks a question there were probably 20 other members who had the same question, but they were too busy and didn't take time to ask!
We wish you the utmost success with the fact-based investment system we support.
Best regards,

Kenneth J. Gruneisen
Founder & Contributing Writer for CANSLIM.net
www.canslim.net |
|
|
|
THESE ARE NOT BUY RECOMMENDATIONS!
Comments contained in the body of this report are technical
opinions only. The material herein has been obtained
from sources believed to be reliable and accurate, however,
its accuracy and completeness cannot be guaranteed.
This site is not an investment advisor, hence it does
not endorse or recommend any securities or other investments.
Any recommendation contained in this report may not
be suitable for all investors and it is not to be deemed
an offer or solicitation on our part with respect to
the purchase or sale of any securities. All trademarks,
service marks and trade names appearing in this report
are the property of their respective owners, and are
likewise used for identification purposes only.
This report is a service available
only to active Paid Premium Members.
You may opt-out of receiving report notifications
at any time. Questions or comments may be submitted
by writing to Premium Membership Services 665 S.E. 10 Street, Suite 201 Deerfield Beach, FL 33441-5634 or by calling 1-800-965-8307
or 954-785-1121.
|
|
|

